8
1

Delete article

Deleted articles cannot be recovered.

Draft of this article would be also deleted.

Are you sure you want to delete this article?

More than 1 year has passed since last update.

MapLibreAdvent Calendar 2023

Day 24

MapLibre GL JSと標高タイルで等高線を描画する

Last updated at Posted at 2023-12-23

TL;DR

  • maplibre-contourを使えば、標高タイルから等高線を描画出来る

image.png

MapLibre User Group Japan@Kanahiroです。標高タイルから生成する等高線についての記事です。

標高タイル

MapLibre、ないしWeb地図の世界では、標高データ(DEM)を効率よく扱うため、標高値をRGBにエンコードした「標高タイル」が利用されています。技術的背景・利活用には以下の記事が詳しいです。

MapLibre GL JSと標高タイル

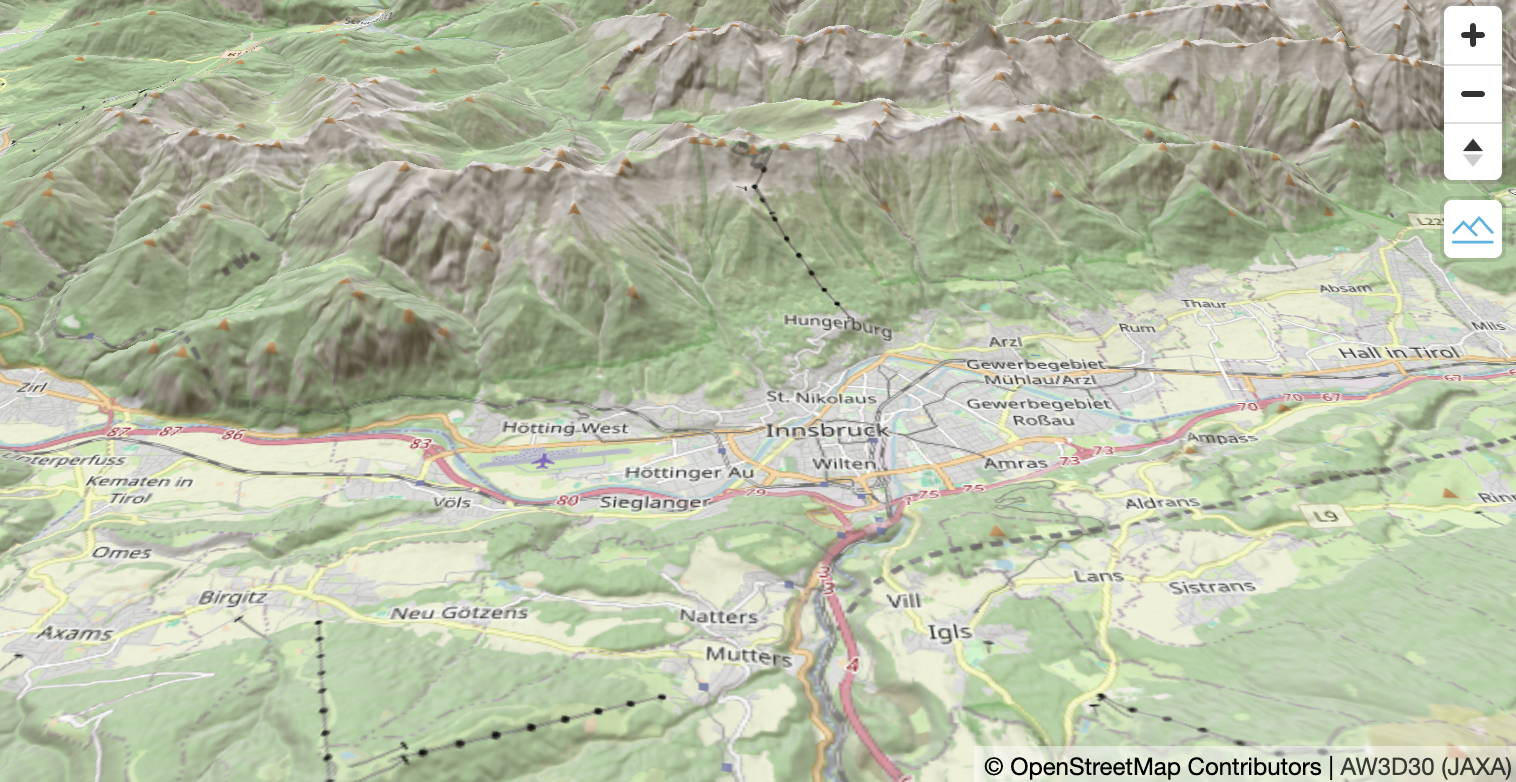
GL JSでは、標高タイル(raster-dem)を用いると、陰影図や3D地形を描画することが出来ます。

Screenshot 2023-12-20 at 8.38.29.png

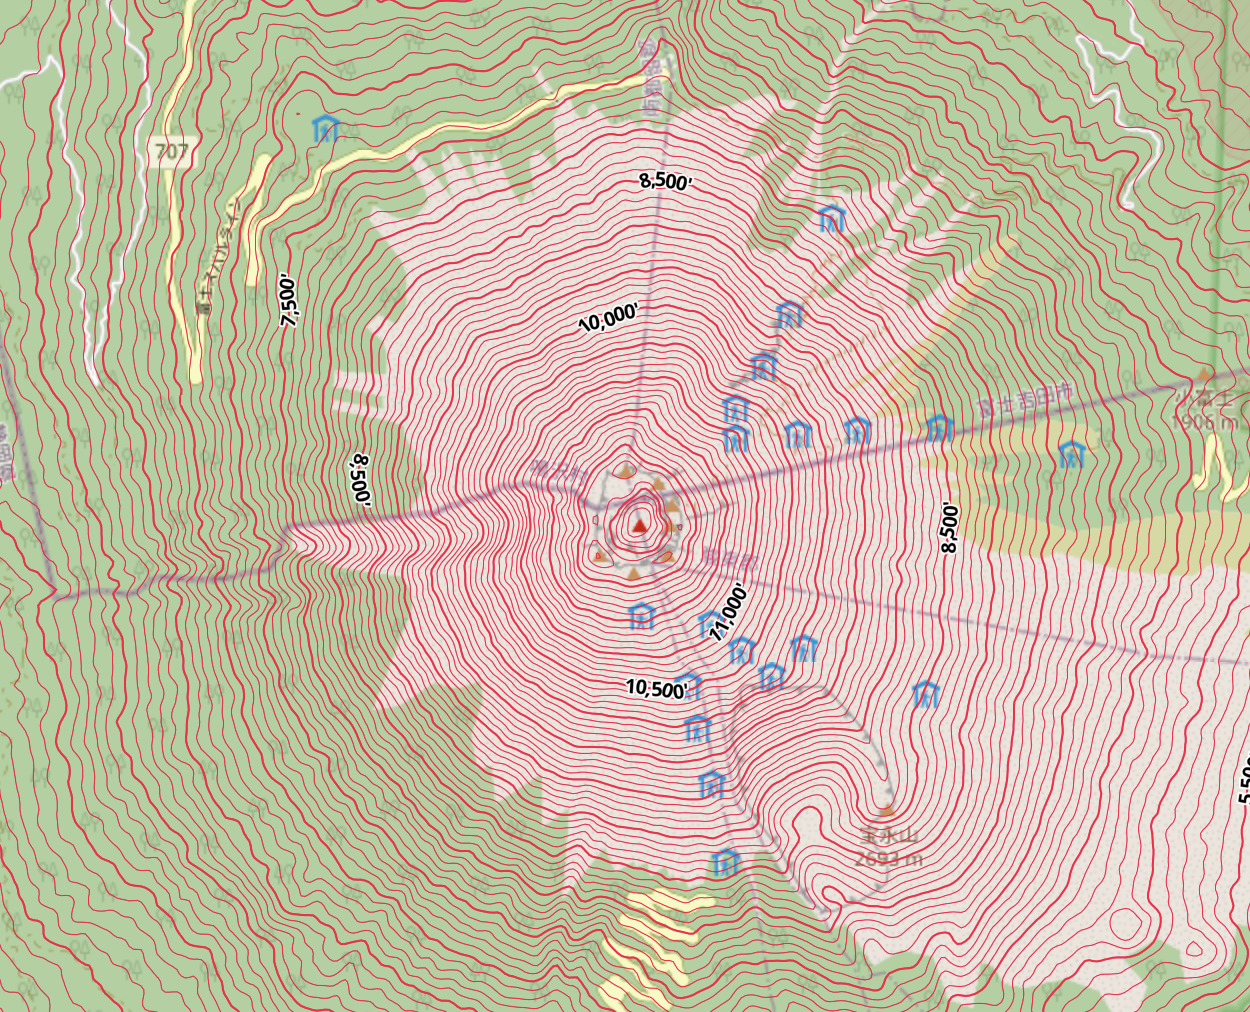
標高タイルで等高線

前述のように標高タイルを用いて、等高線を描画するための実装です。サードパーティプラグインという位置付けです。ユニークな点として、内部的にはベクトルタイルを生成しており、柔軟に地図スタイルを設定出来ることが挙げられます。また、パフォーマンスも良好に思います。

example

Screenshot 2023-12-20 at 8.43.36.png
©️OpenStreetMap Contributors.

技術的背景

image.png
リポジトリより引用

関心領域(=タイル)に加え、隣接するタイルを用いて等高線を生成しているようです。

サポートしている標高タイルのエンコーディングはMapLibreと同様、Terrain-RGBかTerrariumになります。地理院標高タイルは利用出来ません。

8
1
0

Register as a new user and use Qiita more conveniently

  1. You get articles that match your needs
  2. You can efficiently read back useful information
  3. You can use dark theme
What you can do with signing up
8
1

Delete article

Deleted articles cannot be recovered.

Draft of this article would be also deleted.

Are you sure you want to delete this article?