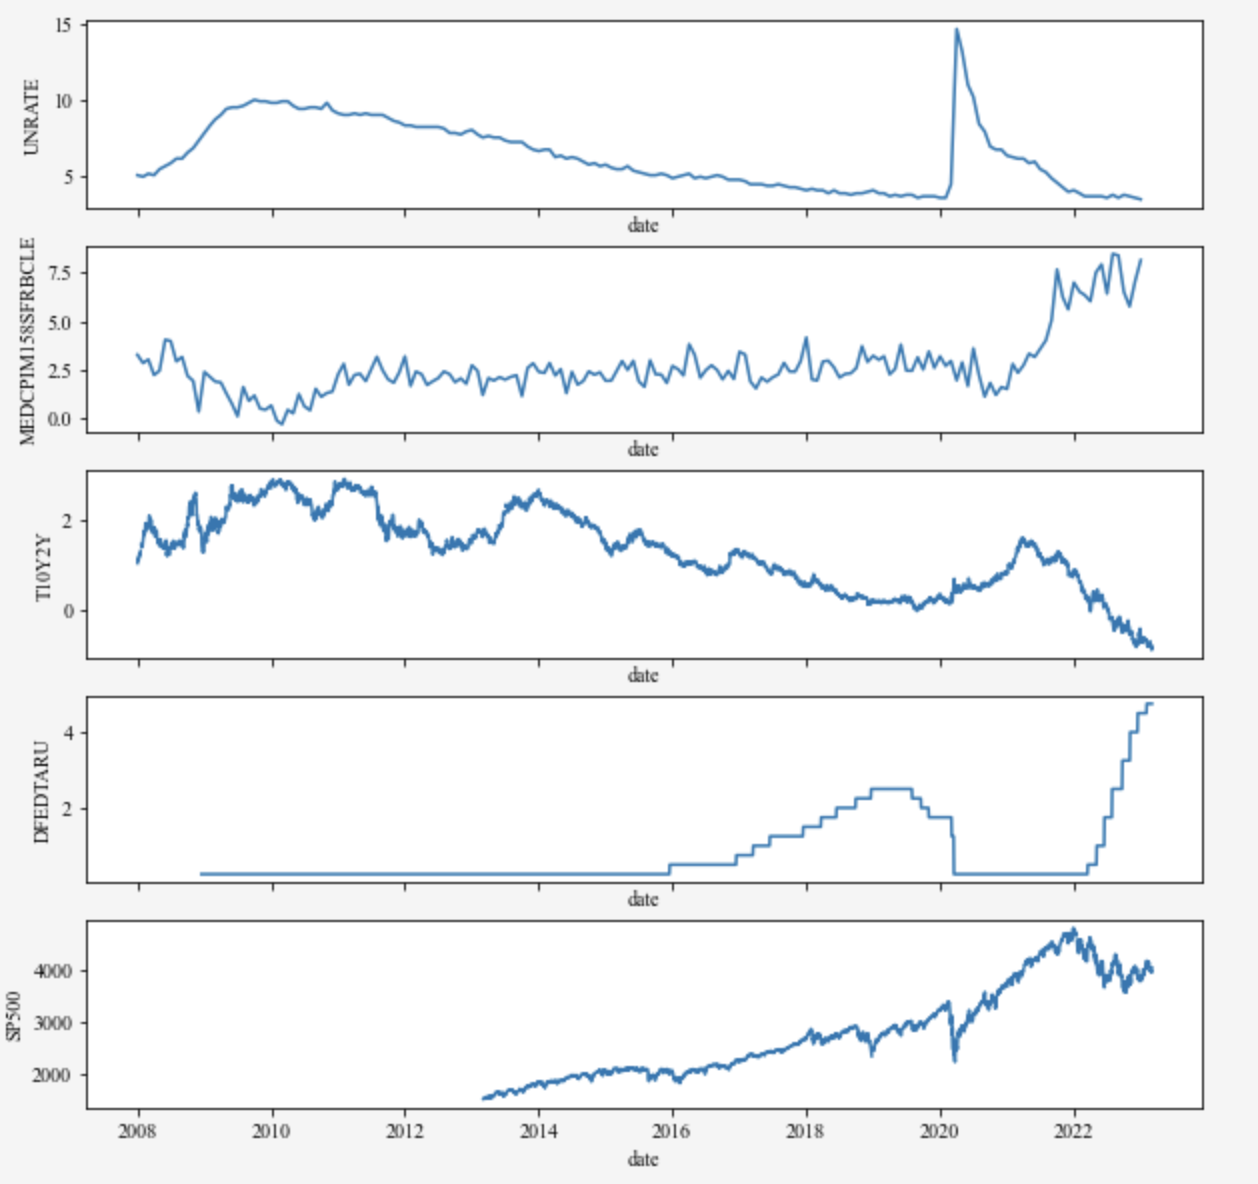
主旨
Fredモジュールを用いて下記米国経済指標をグラフ化するpythonコードをまとめました。
米国経済指標
- 米国失業率
- 長短金利差(10年米国債と2年米国債)
- 長期金利 10年
- 短期金利 2年
- 消費者物価指数CPI
- SP500
- 米国政策金利
事前準備
FredのAPI利用登録ページでアカウントを作成し、APIキーを取得してください。(参考)
取得したAPIキーを、新しい環境変数FRED_API_KEYに登録してください。
- FRED® API: https://fred.stlouisfed.org/docs/api/fred/
import
python.py
import os
import pandas as pd
import seaborn as sns
from full_fred.fred import Fred
import matplotlib.pyplot as plt

#pandas:1.3.5で本プログラムは動作確認しています。
print('pandas:', pd.__version__)
コード
python.py
# FRED_API_KEY = os.getenv('FRED_API_KEY')
fred = Fred()
print(f"FRED APIキーが環境変数に設定されている:{fred.env_api_key_found()}")


def get_fred_data(name, start="2013-01-01", end=""):
    df = fred.get_series_df(name)[["date", "value"]].copy()
    df["date"] = pd.to_datetime(df["date"])
    df["value"] = pd.to_numeric(df["value"], errors="coerce")
    df = df.set_index("date")

    if end == "":
        df = df.loc[f"{start}":]
    else:
        df = df.loc[f"{start}":f"{end}"]
    return df

def MakeGraphFromFred(name, start):
    if(type(name)!=list):
        df_UNRATE = get_fred_data(name, start=start)
        data1 = df_UNRATE
        data1 = data1.reset_index()
        fig, axes = plt.subplots(1, 1, figsize=(6,4), tight_layout=False, facecolor="whitesmoke")
        axes.plot(data1['date'], data1['value'])
        axes.set_xlabel('date')
        axes.set_ylabel(name)
        axes.set_title(name)
    else:
        num = len(name)
        fig, axes = plt.subplots(num, 1, figsize=(10,4*num/2), tight_layout=False,sharex=True, facecolor="whitesmoke")
        for i in range(num):
            df_UNRATE = get_fred_data(name[i], start=start)
            data1 = df_UNRATE
            data1 = data1.reset_index()
            axes[i].plot(data1['date'], data1['value'])
            axes[i].set_xlabel('date')
            axes[i].set_ylabel(name[i])
#             axes[i].set_title(name[i])

    plt.show()
    return

plt.rcParams['font.family'] = 'Times new roman' #
#[ 'serif' | 'sans-serif' | 'cursive' | 'fantasy' | 'monospace' ]
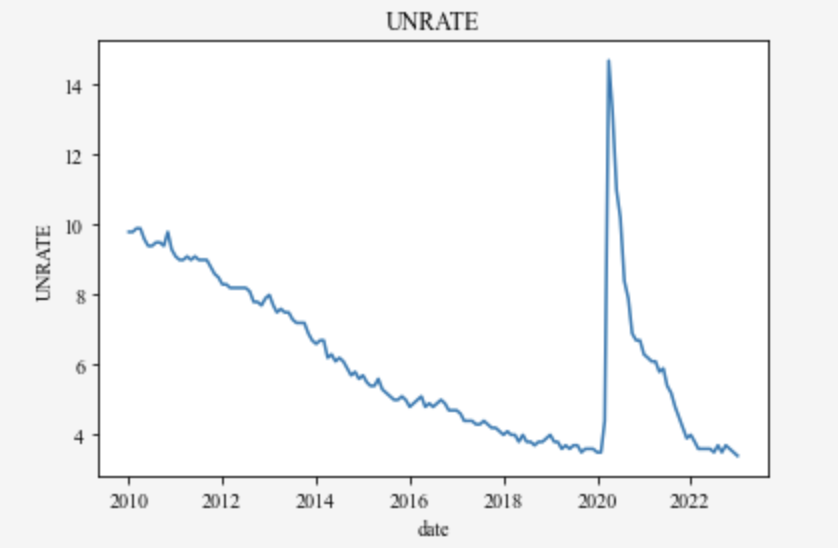
米国失業率
python.py
MakeGraphFromFred("UNRATE", start="2010-01-01")
長短金利差(10年米国債と2年米国債)
10-Year Treasury Constant Maturity Minus 2-Year Treasury Constant Maturity
ソース:https://fred.stlouisfed.org/graph/?g=pKyy
python.py
MakeGraphFromFred("T10Y2Y", start="1950-01-01")

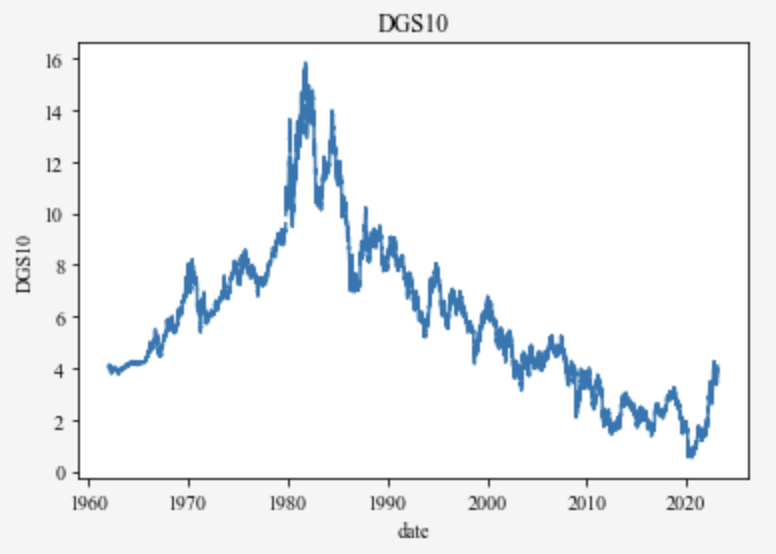
長期金利 10年
Market Yield on U.S. Treasury Securities at 10-Year Constant Maturity, Quoted on an Investment Basis
python.py
MakeGraphFromFred("DGS10", start="1900-01-01")
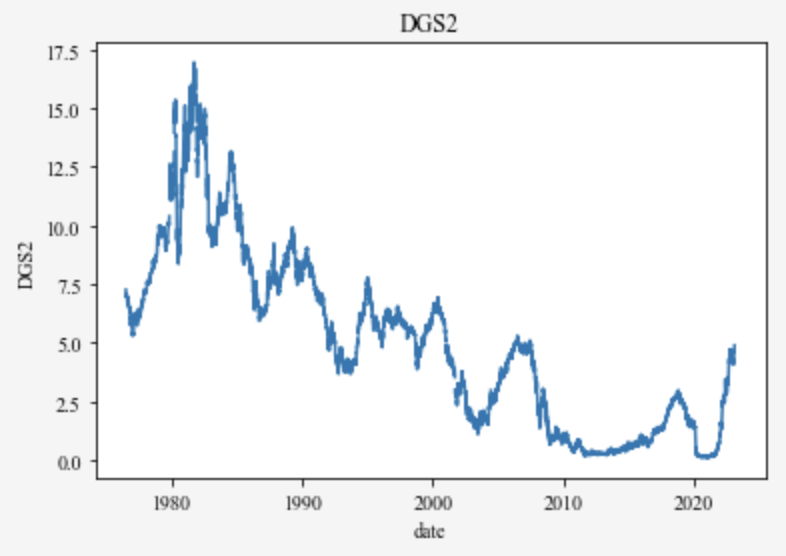
短期金利 2年
python.py
MakeGraphFromFred("DGS2", start="1900-01-01")
消費者物価指数CPI
python.py
MakeGraphFromFred("MEDCPIM158SFRBCLE", start="2000-01-01")

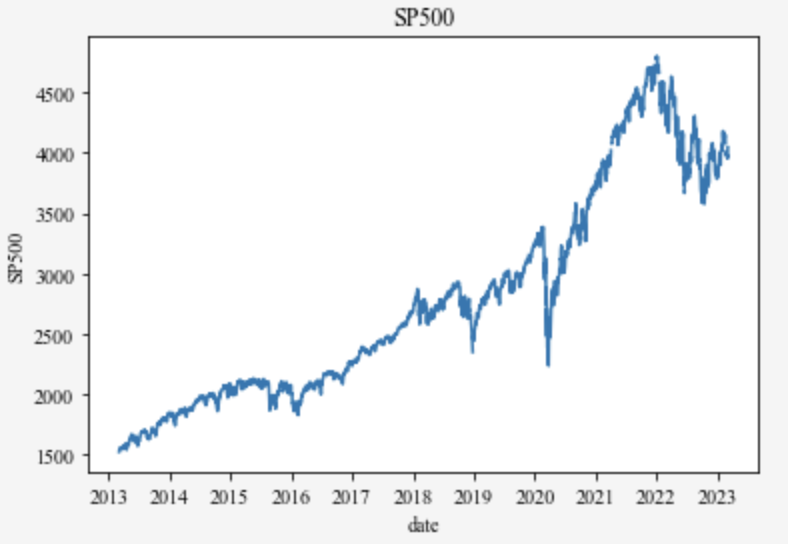
SP500
python.py
MakeGraphFromFred("SP500", start="2008-01-01")
米国政策金利
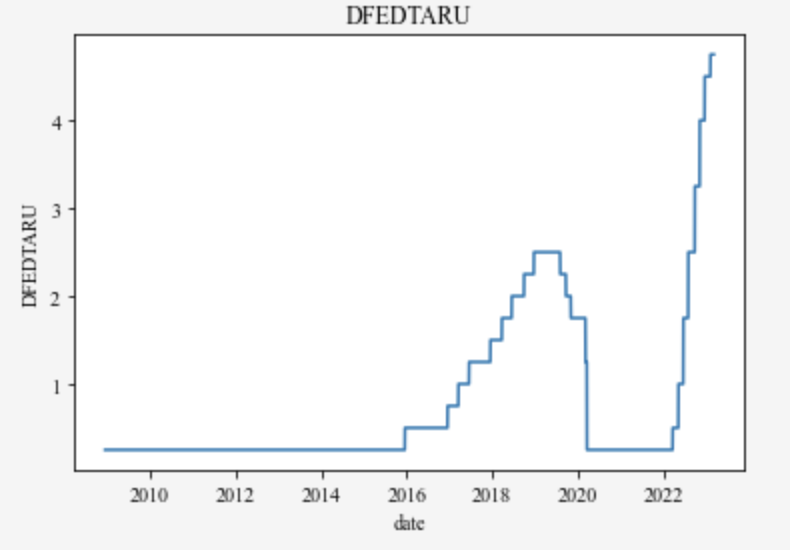
政策金利にも数種類ある
- アメリカ政策金利上限値(2008年以降): Federal Funds Target Range - Upper Limit (DFEDTARU)
- アメリカ政策金利下限値(2008年以降) : Federal Funds Target Range - Lower Limit (DFEDTARL)
- Effective Federal Funds Rate (EFFR)
python.py
MakeGraphFromFred("DFEDTARU", start="2008-01-01")
#MakeGraphFromFred("DFEDTARL", start="2008-01-01")
#MakeGraphFromFred("EFFR", start="2008-01-01")
まとめて
python.py
cols = ["UNRATE", "MEDCPIM158SFRBCLE", "T10Y2Y", "DFEDTARU", "SP500"]
MakeGraphFromFred(cols, start="2008-01-01")
