はじめに
-
MudBlazorって非常に強力なUIフレームワーク。
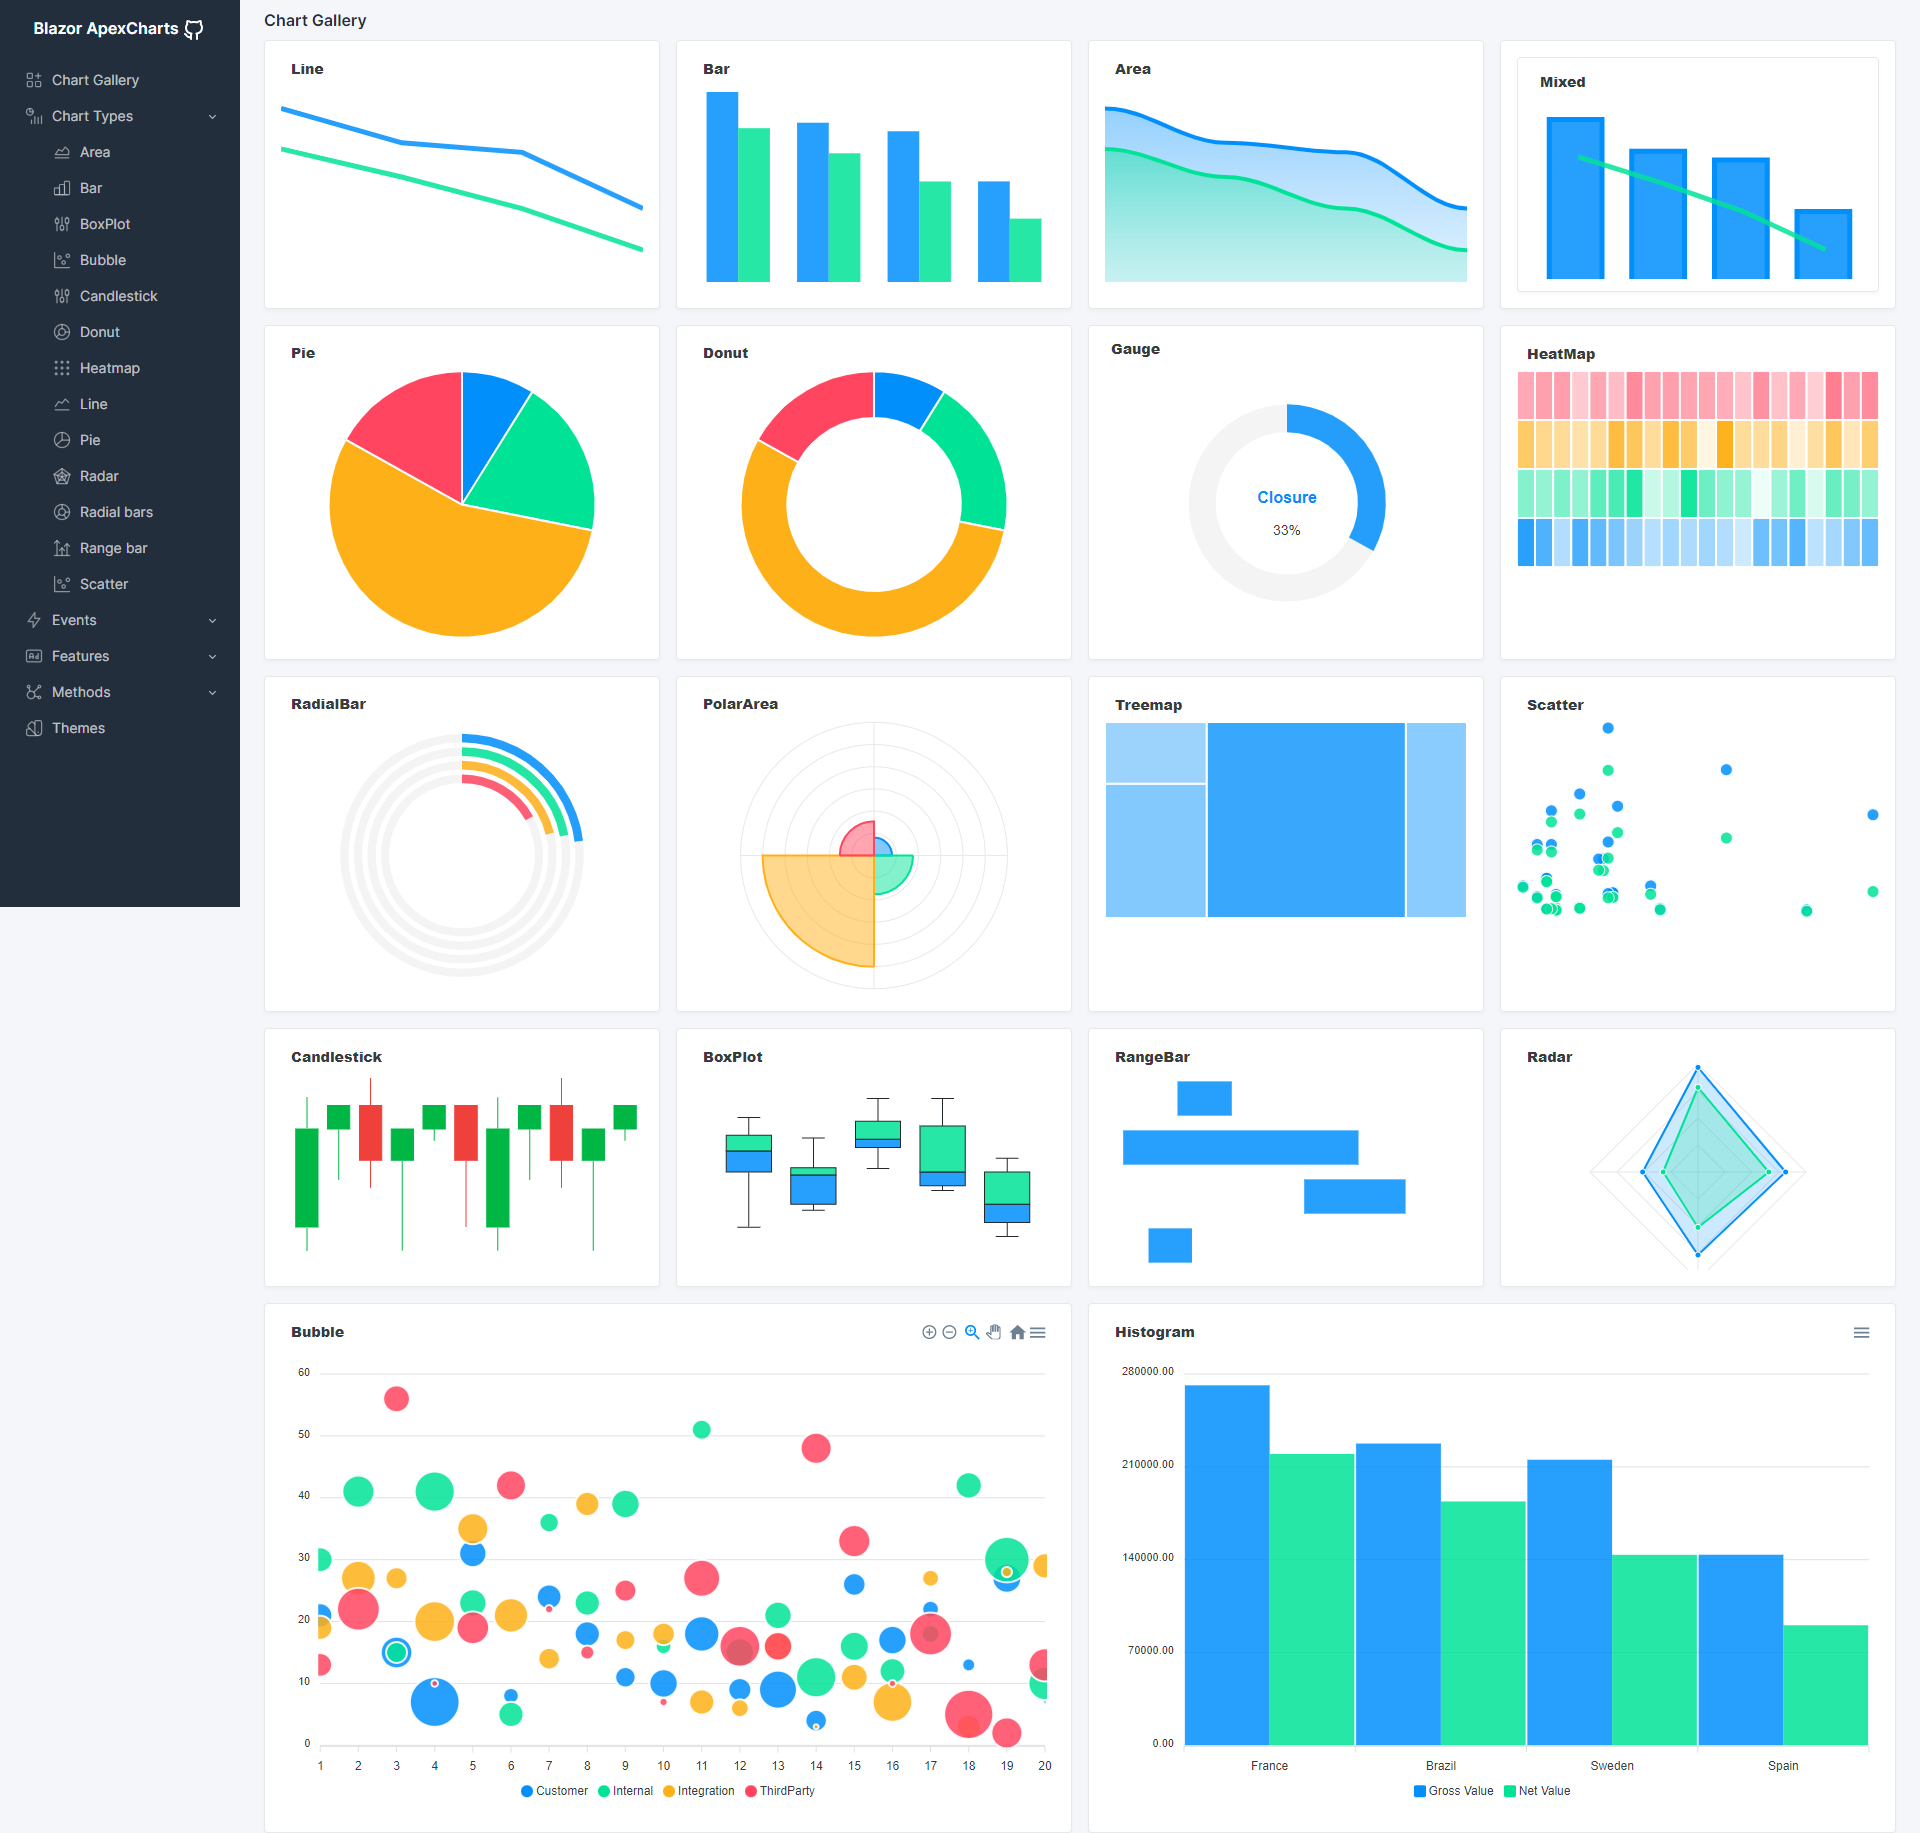
チャートも用意されているんですが、使い勝手があまり良くない。どこかって言うとクラスモデルに格納したまま使えなかった。そのまま使えそうなApexChartsをラップしたBlazor版がまだプレリリースですが、試してみました。 - チャートの有名どころとして、ChartJs.BlazorはChart.jsをラップしたBlazor版がありますけど、今回はApexChartsを使用します。
Blazor ApexCharts
開発環境
- Visual Studio 2022 (C#)
- MudBlazor 6.0.9
- ApexChart 0.9.13-beta
- MudBlazor/Template
プロジェクト作成
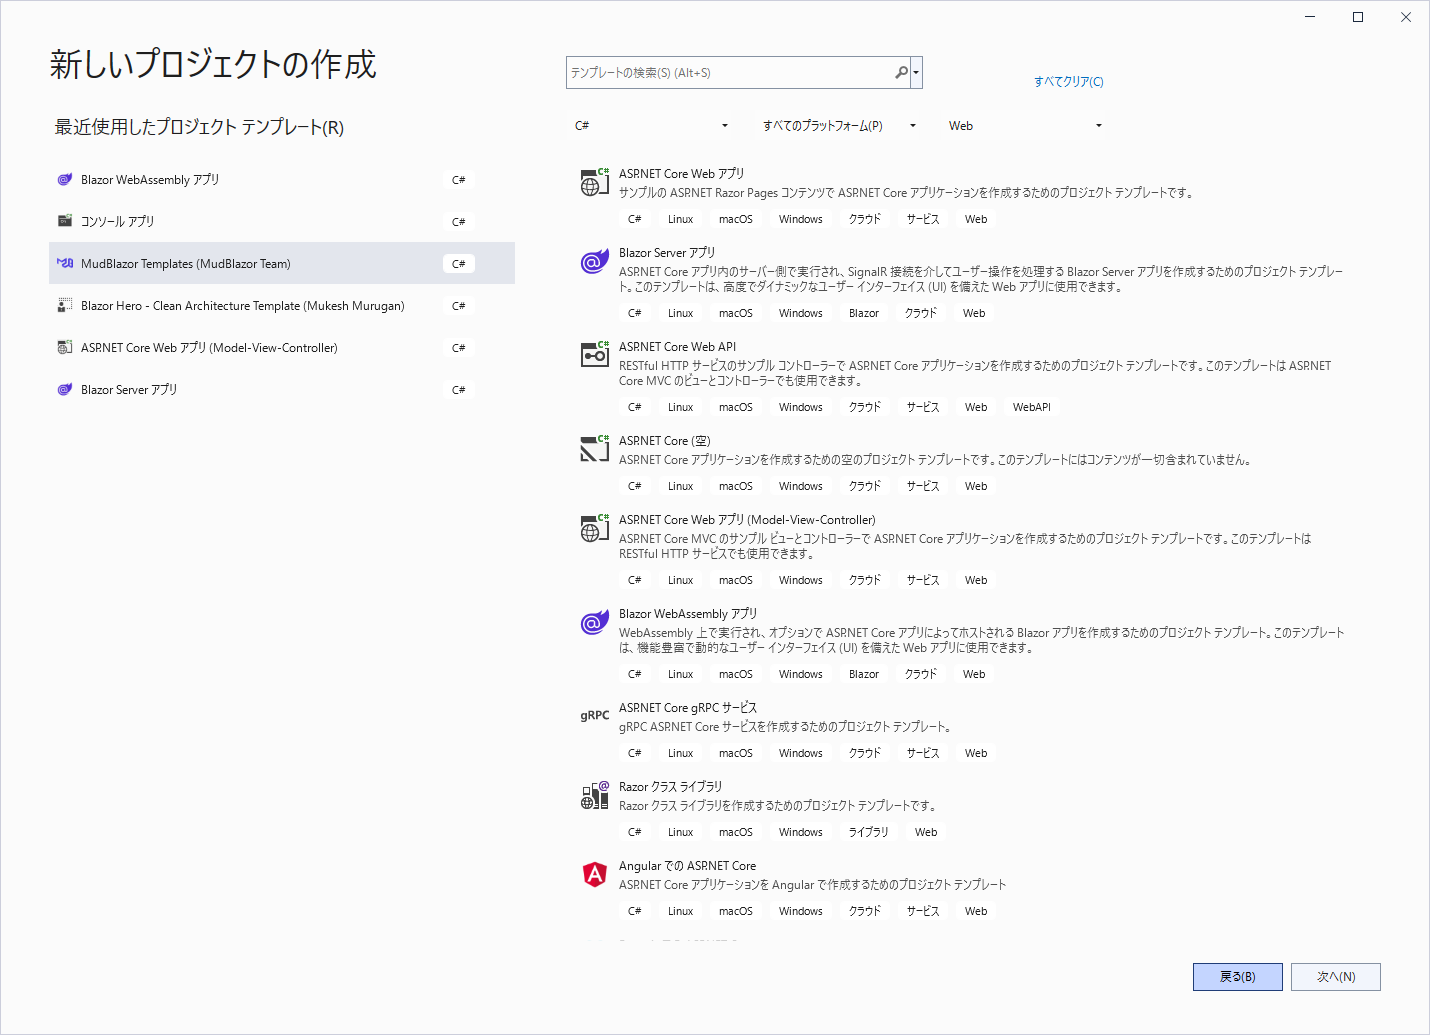
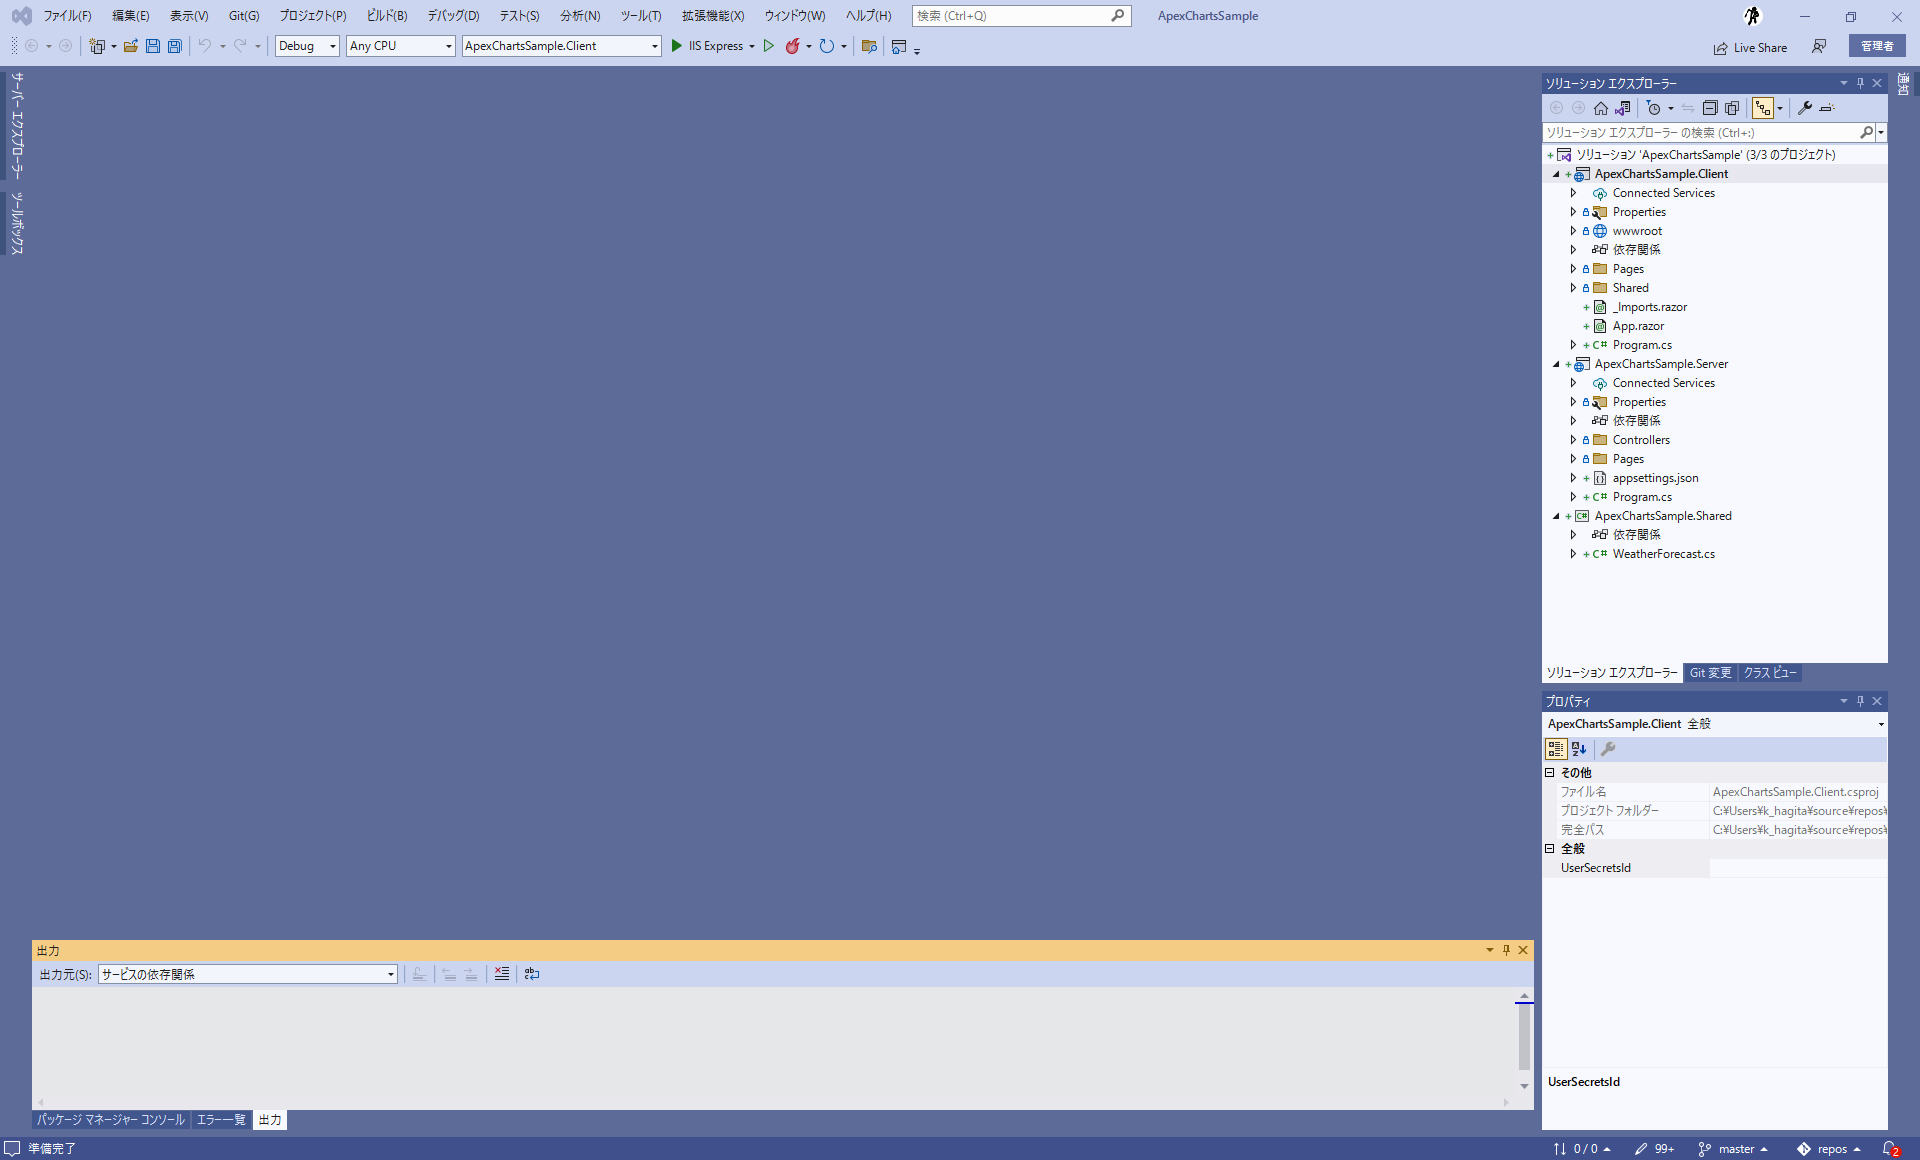
- MudBlazor Templates(MudBlazor Team)のプロジェクトテンプレートを選択します。
- 事前にMudBlazorのテンプレート拡張しておけばプロジェクト作成が楽です。
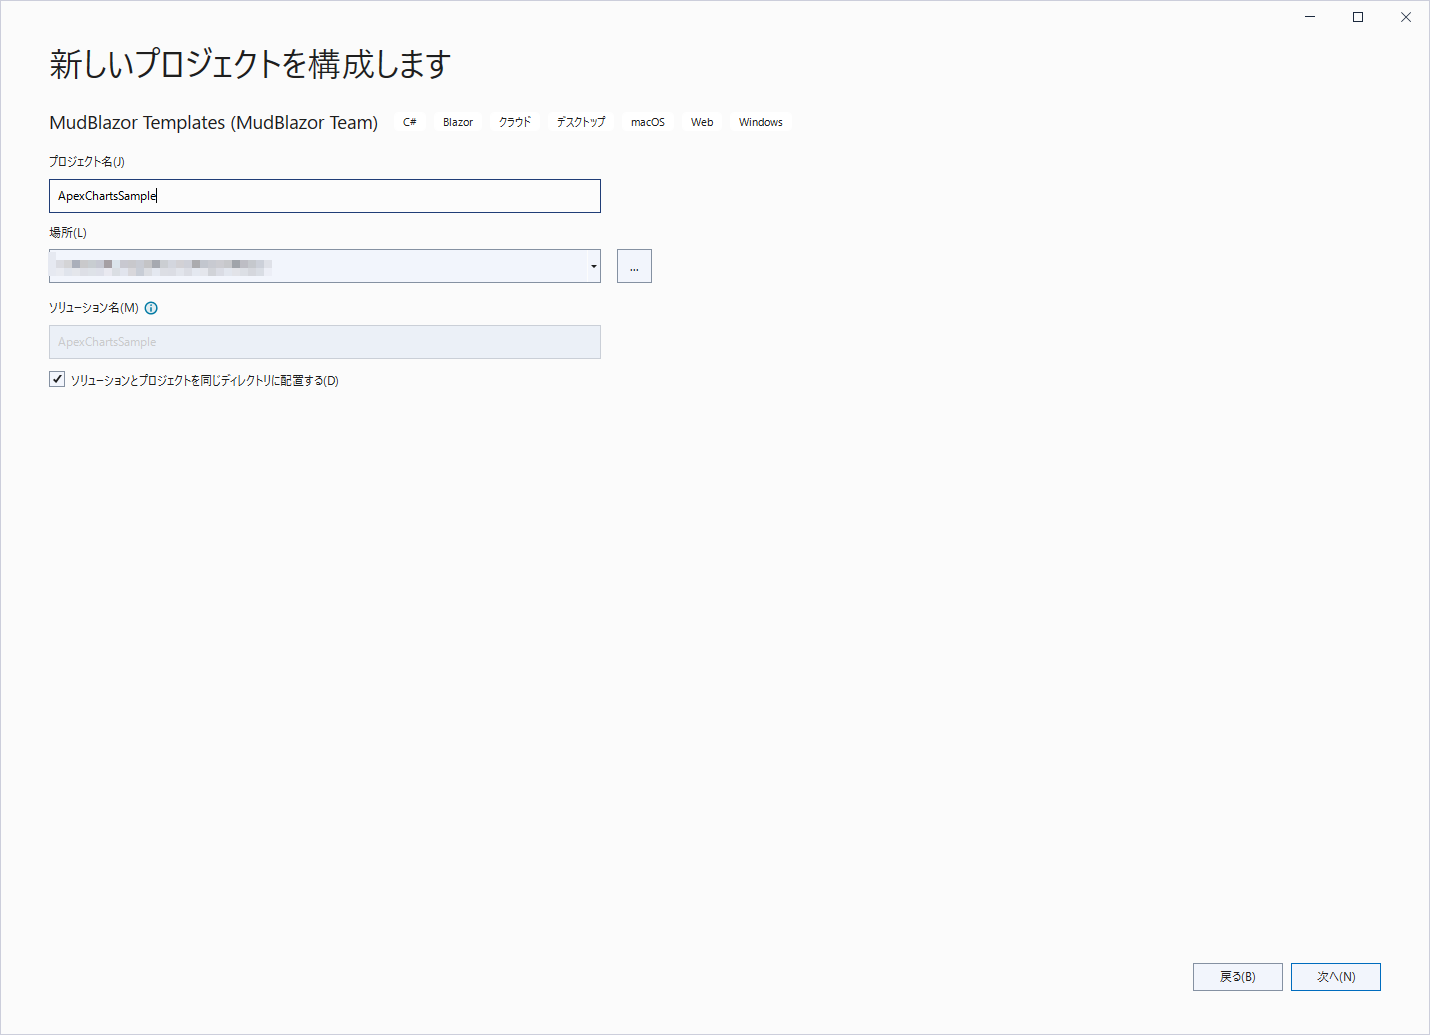
- 適当な名前を付けます。
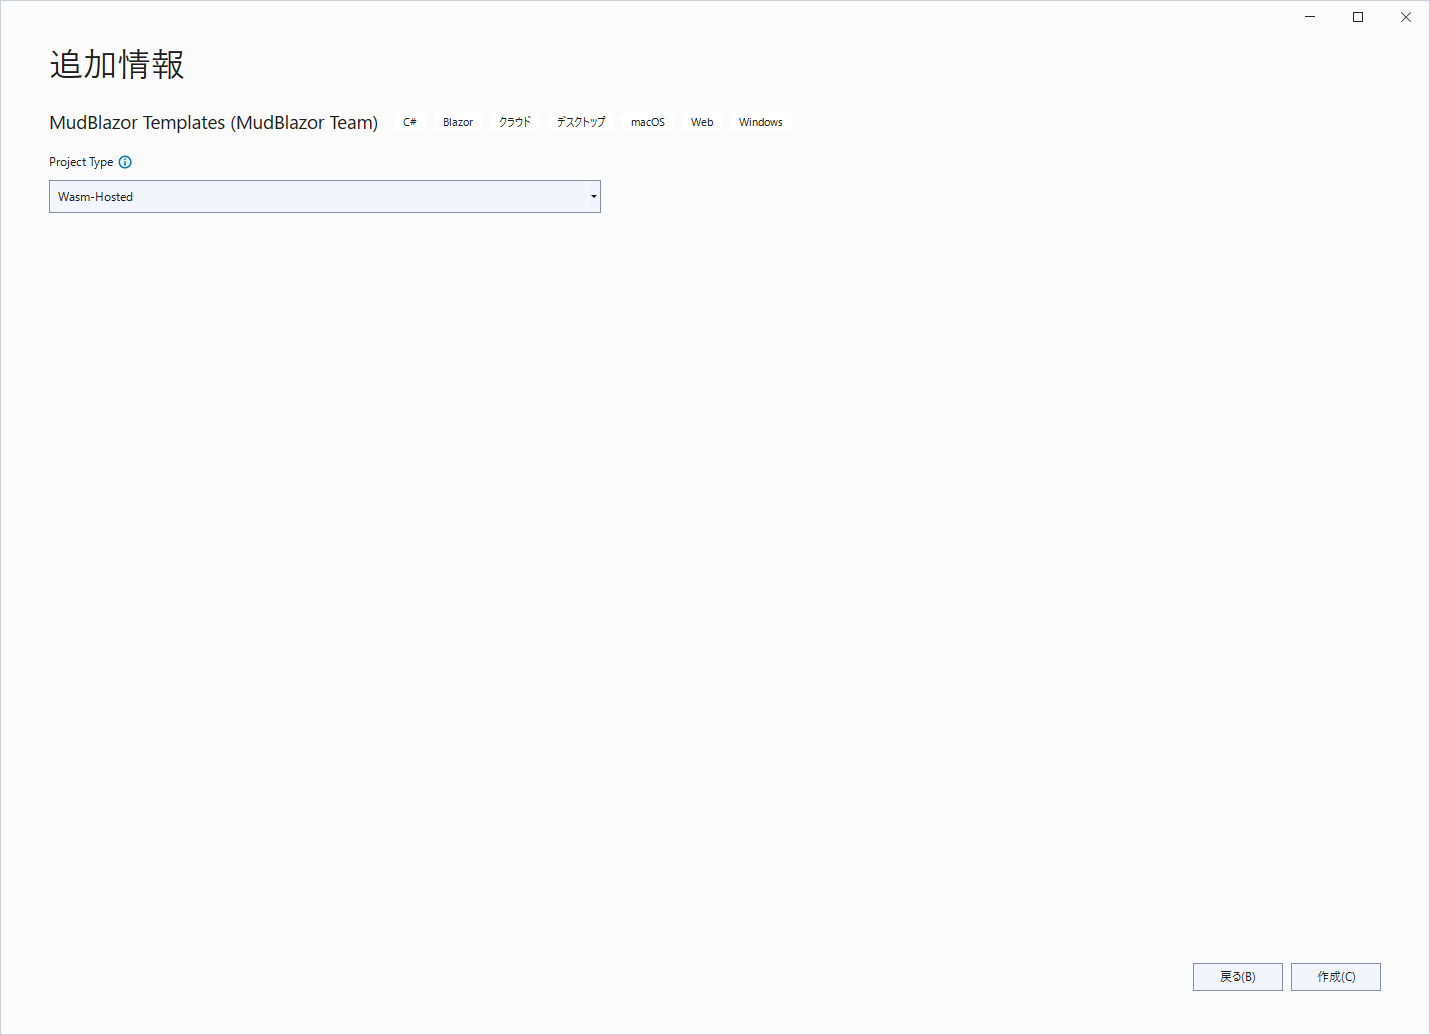
- Project Typeは、Wasm-Hostedを選択します。
- 他のでもよいです。
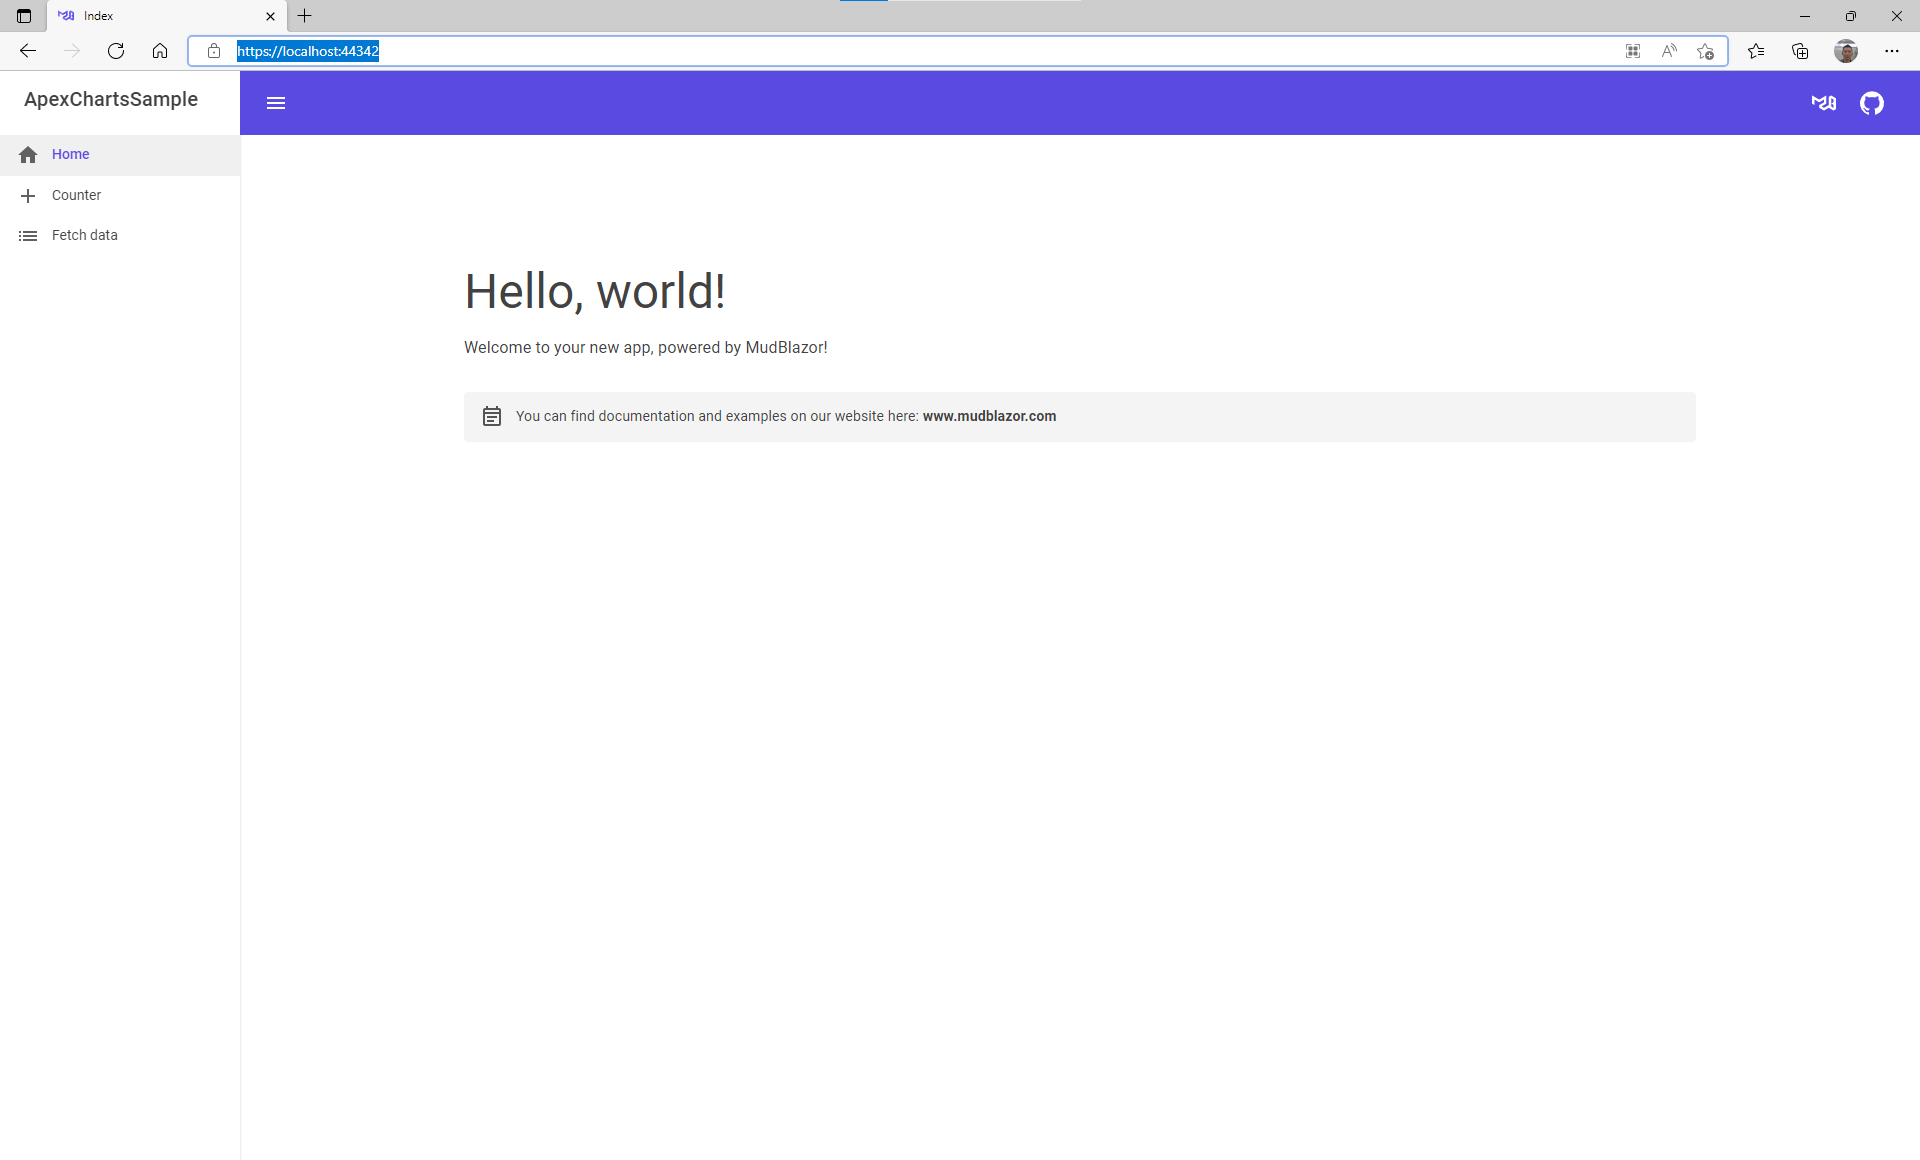
- 無事テンプレートからMudBlazorを適用したプロジェクトが作成できたかと思います。
- 基本的な設定は、テンプレートが行ってくれているので、_Imports.razorやProgram.cs等の設定は、不要です。
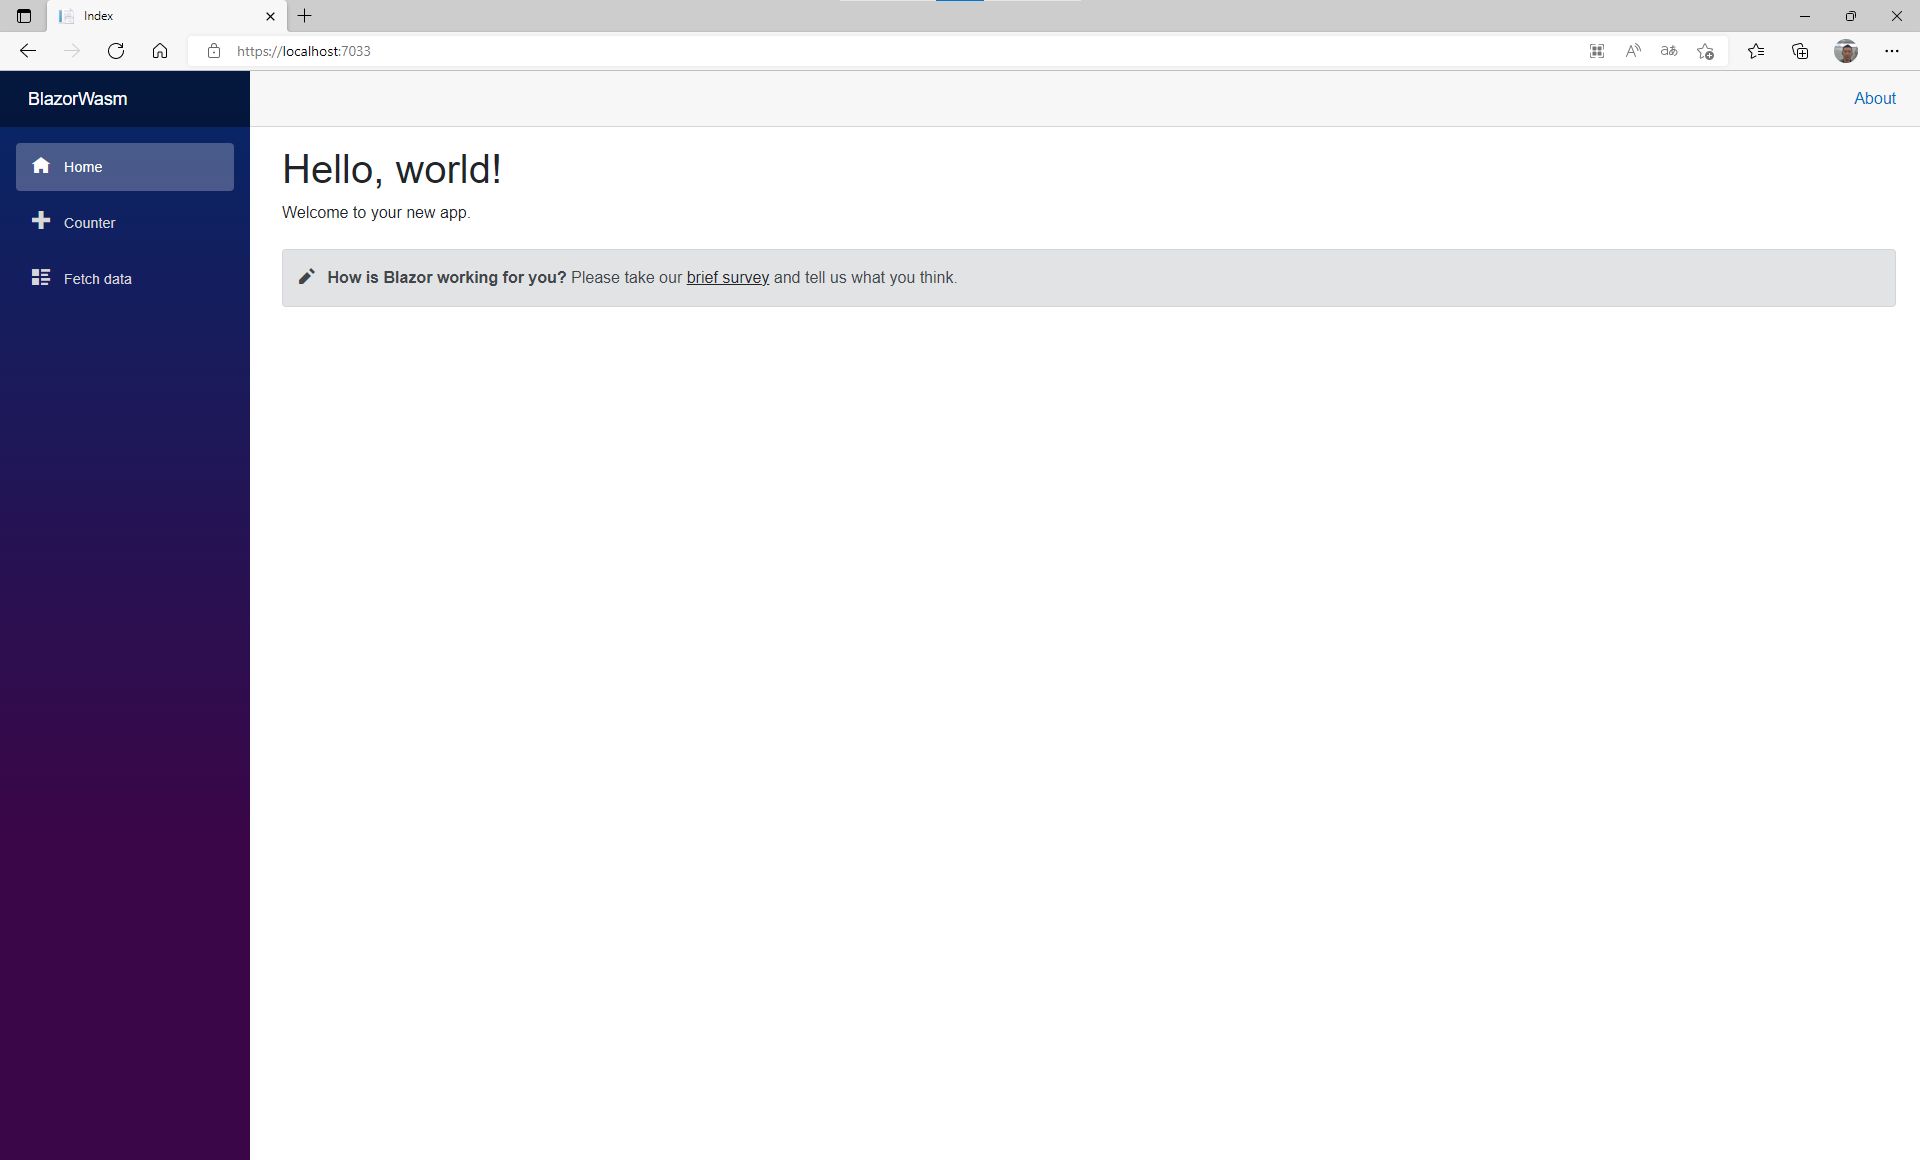
- とりあえず、.Server を選択してデバッグ実行
ApexChartsの適用
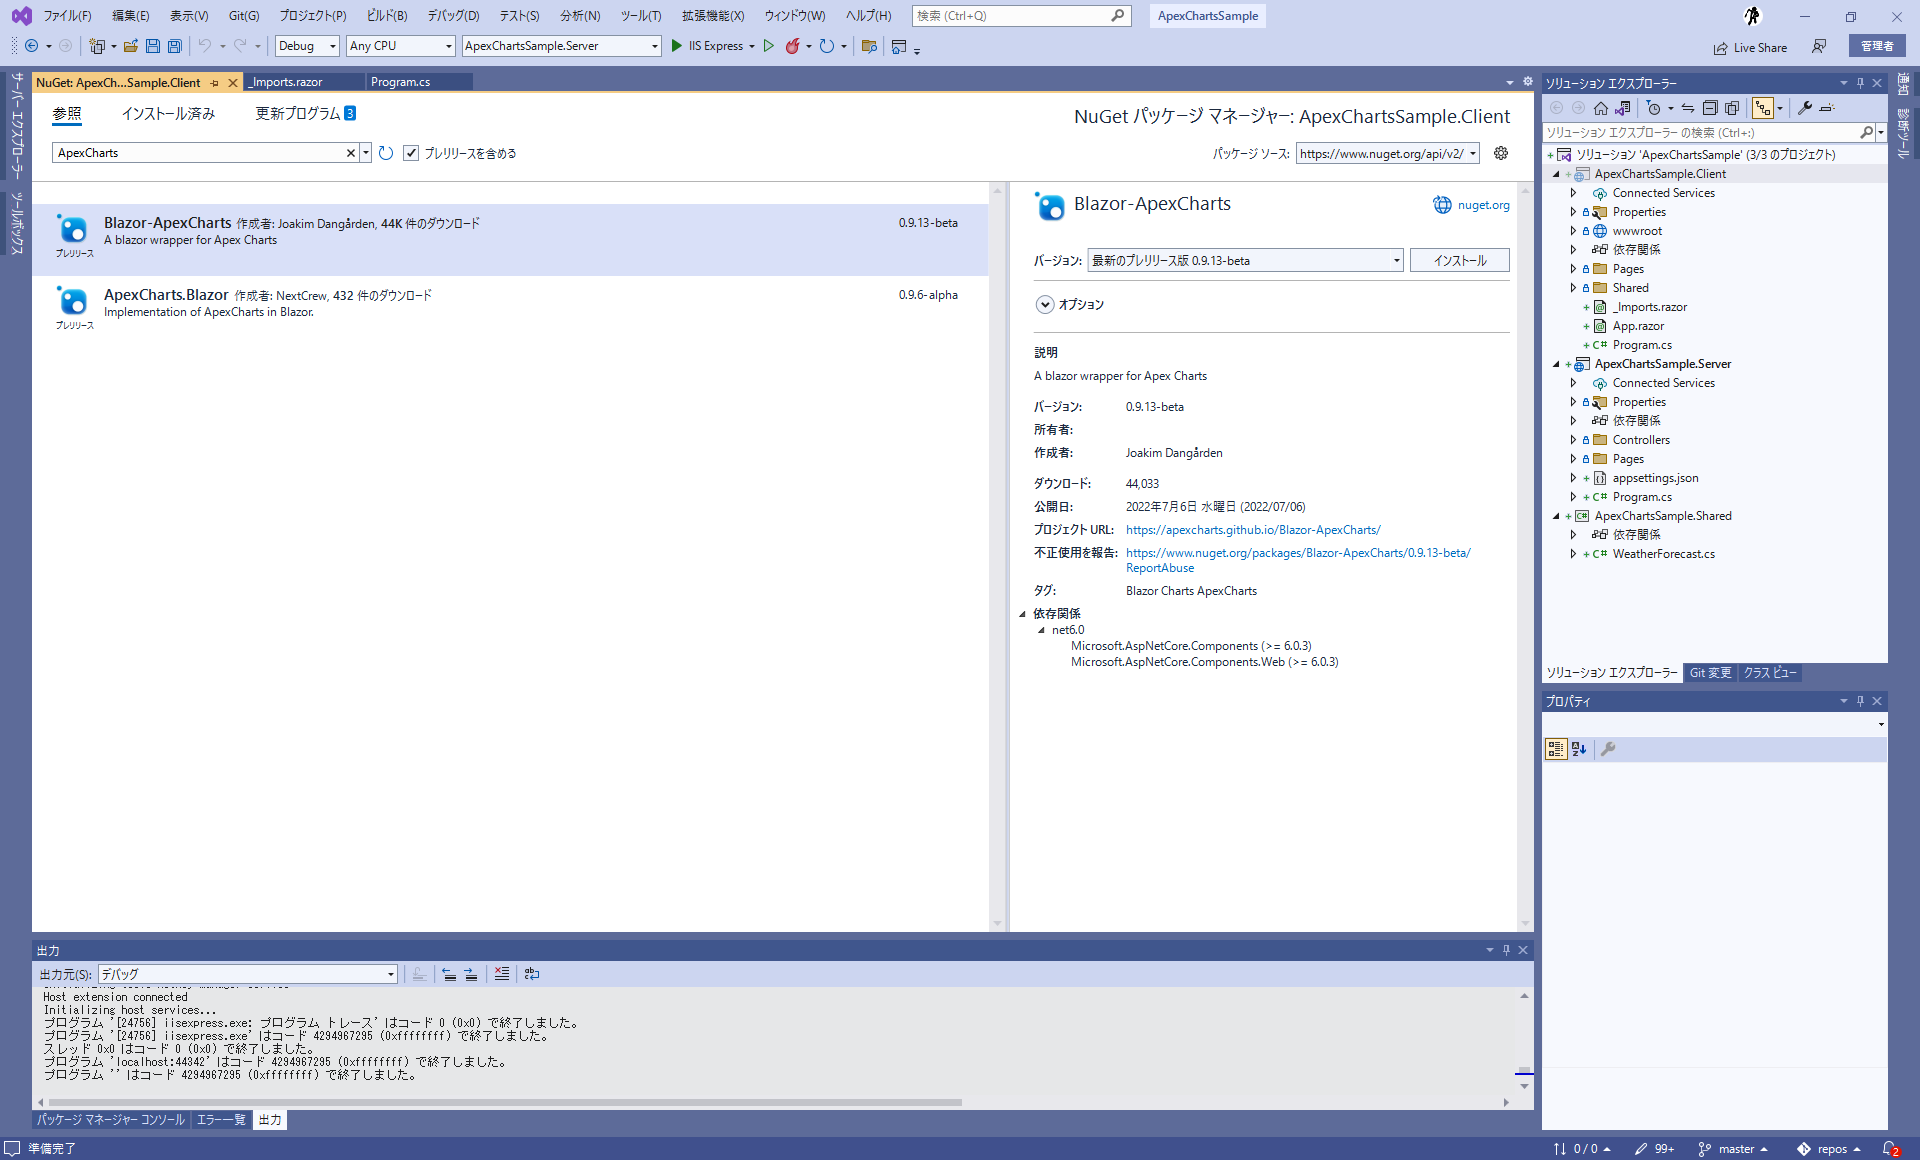
- *.Clientを右クリックして、Nugetパッケージの管理 を選択
- ApexChartsと入力、その際、プレリリースを含めるのチェックボックスはオンにする。
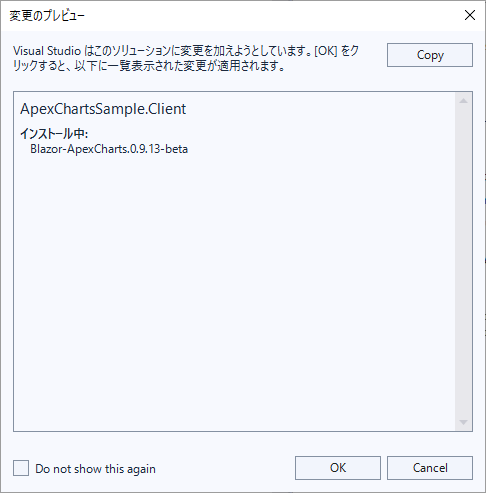
- 変更のプレビューは、とりあえずOK
- WWWroot直下のindex.htmlを編集
<script src="_content/Blazor-ApexCharts/js/apex-charts.min.js"></script><script src="_content/Blazor-ApexCharts/js/blazor-apex-charts.js"></script>
index.html
<!DOCTYPE html>
<html>

<head>
    <meta charset="utf-8" />
    <meta name="viewport" content="width=device-width, initial-scale=1.0, maximum-scale=1.0, user-scalable=no" />
    <title>ApexChartsSample</title>
    <base href="/" />
    <link href="https://fonts.googleapis.com/css?family=Roboto:300,400,500,700&display=swap" rel="stylesheet" />
    <link href="_content/MudBlazor/MudBlazor.min.css" rel="stylesheet" />
</head>

<body>
    <div id="app">Loading...</div>

    <div id="blazor-error-ui">
        An unhandled error has occurred.
        <a href="" class="reload">Reload</a>
        <a class="dismiss">🗙</a>
    </div>
    <script src="_framework/blazor.webassembly.js"></script>
    <script src="_content/MudBlazor/MudBlazor.min.js"></script>
+    <script src="_content/Blazor-ApexCharts/js/apex-charts.min.js"></script>
+    <script src="_content/Blazor-ApexCharts/js/blazor-apex-charts.js"></script>
</body>

</html>
-
_Imports.razorを編集
-
@using ApexChartsを追加
-
_Imports.razor
@using System.Net.Http
@using System.Net.Http.Json
@using Microsoft.AspNetCore.Components.Forms
@using Microsoft.AspNetCore.Components.Routing
@using Microsoft.AspNetCore.Components.Web
@using Microsoft.AspNetCore.Components.Web.Virtualization
@using Microsoft.AspNetCore.Components.WebAssembly.Http
@using Microsoft.JSInterop
@using MudBlazor
@using ApexChartsSample.Client
@using ApexChartsSample.Client.Shared
+ @using ApexCharts
グラフの実装
デモページで、FetchDataというページがあるのでそちらのデータを使ってグラフを実装します。
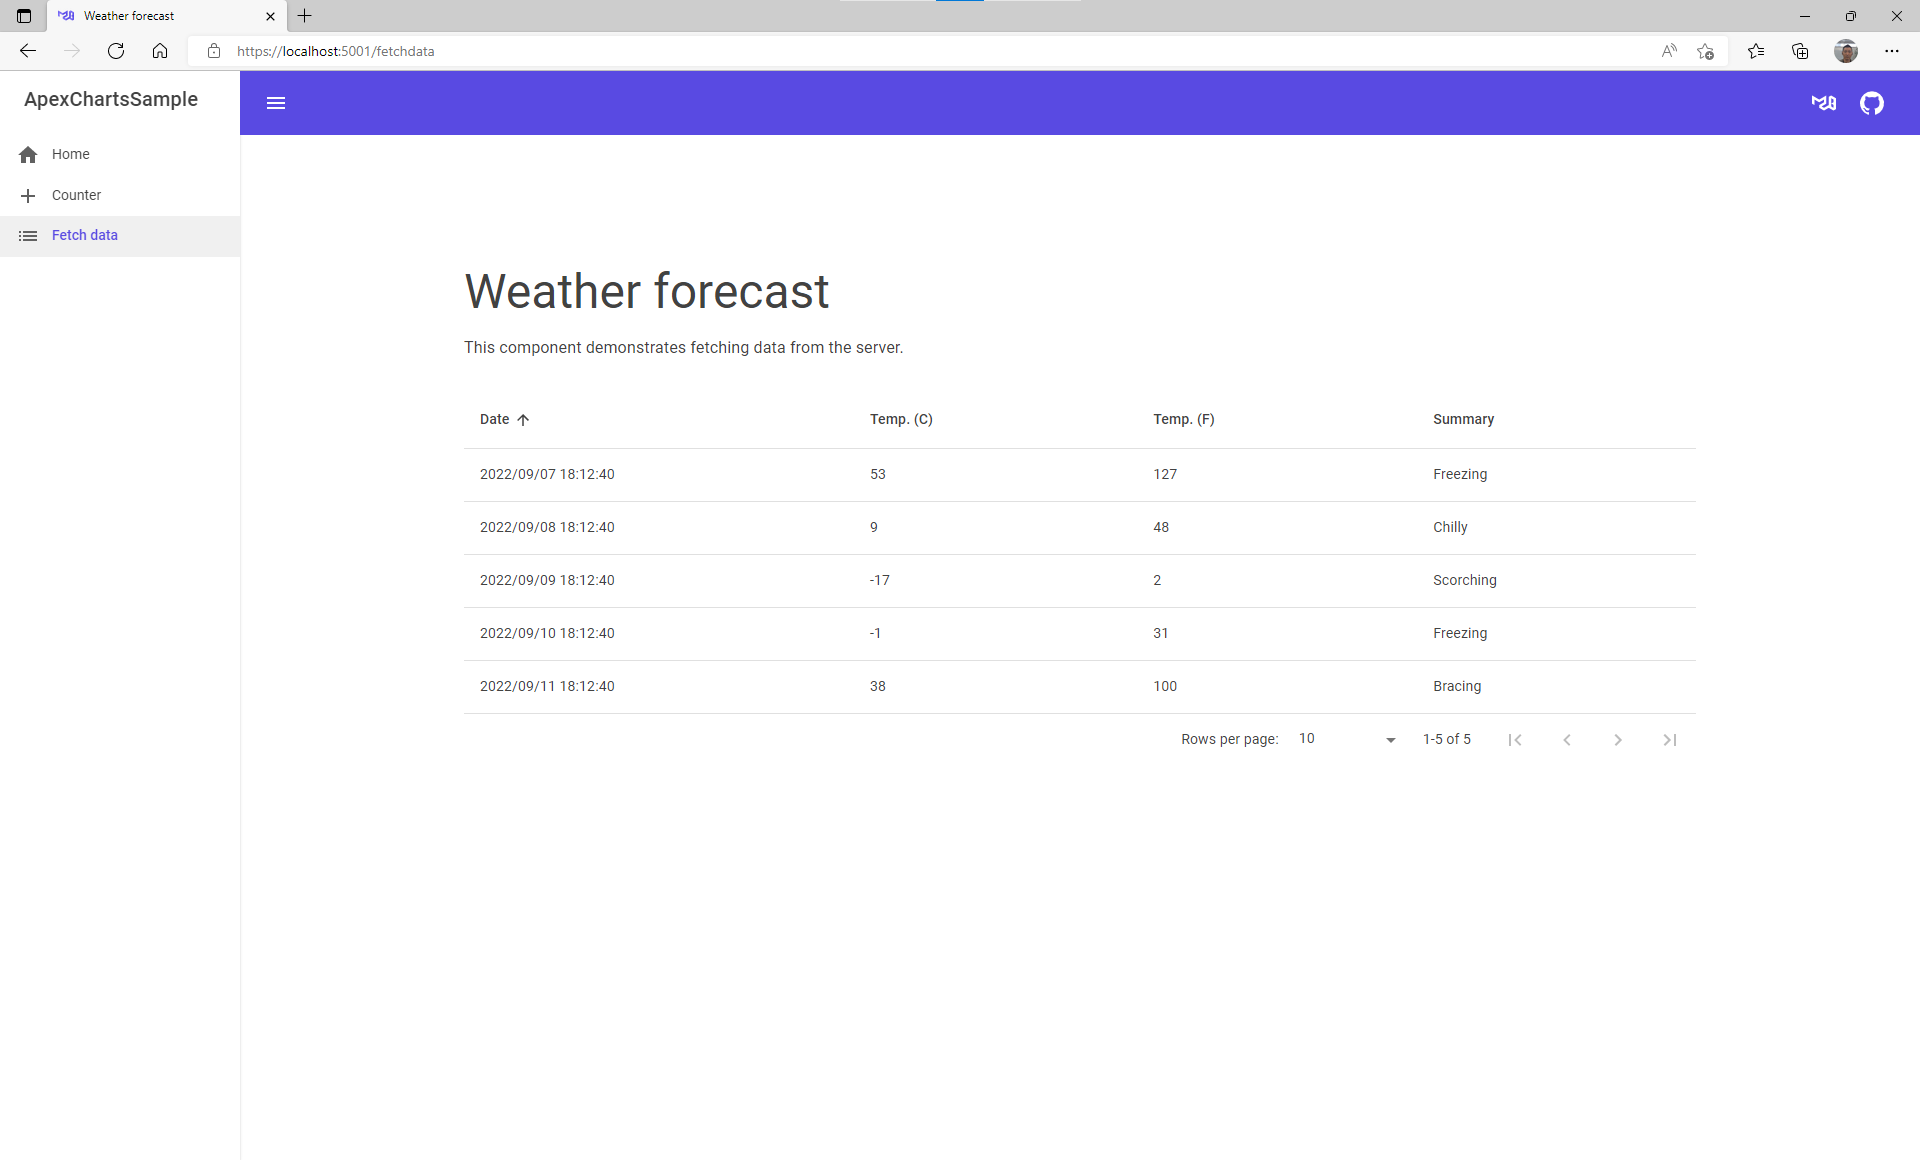
- 初期のFetchDataページは、こんな感じでデータを持っているので、こちらのクラスモデルに入っているデータを使用してみます。
ApexCharts読み込み後の注意点
- 実は、ColorPaletteがMudBlazorとApexChartsでかぶっているので、初期値のColor.Defaultを、MudBlazor.Color.Defaultにしないとエラーになっています。
FetchData.razor
@page "/fetchdata"
@inject HttpClient Http
@using ApexChartsSample.Shared

<PageTitle>Weather forecast</PageTitle>

<MudText Typo="Typo.h3" GutterBottom="true">Weather forecast</MudText>
<MudText Class="mb-8">This component demonstrates fetching data from the server.</MudText>
@if (forecasts == null)
{
-    //<MudProgressCircular Color="Color.Default" Indeterminate="true" />
+    <MudProgressCircular Color="MudBlazor.Color.Default" Indeterminate="true" />
}
グラフの実装
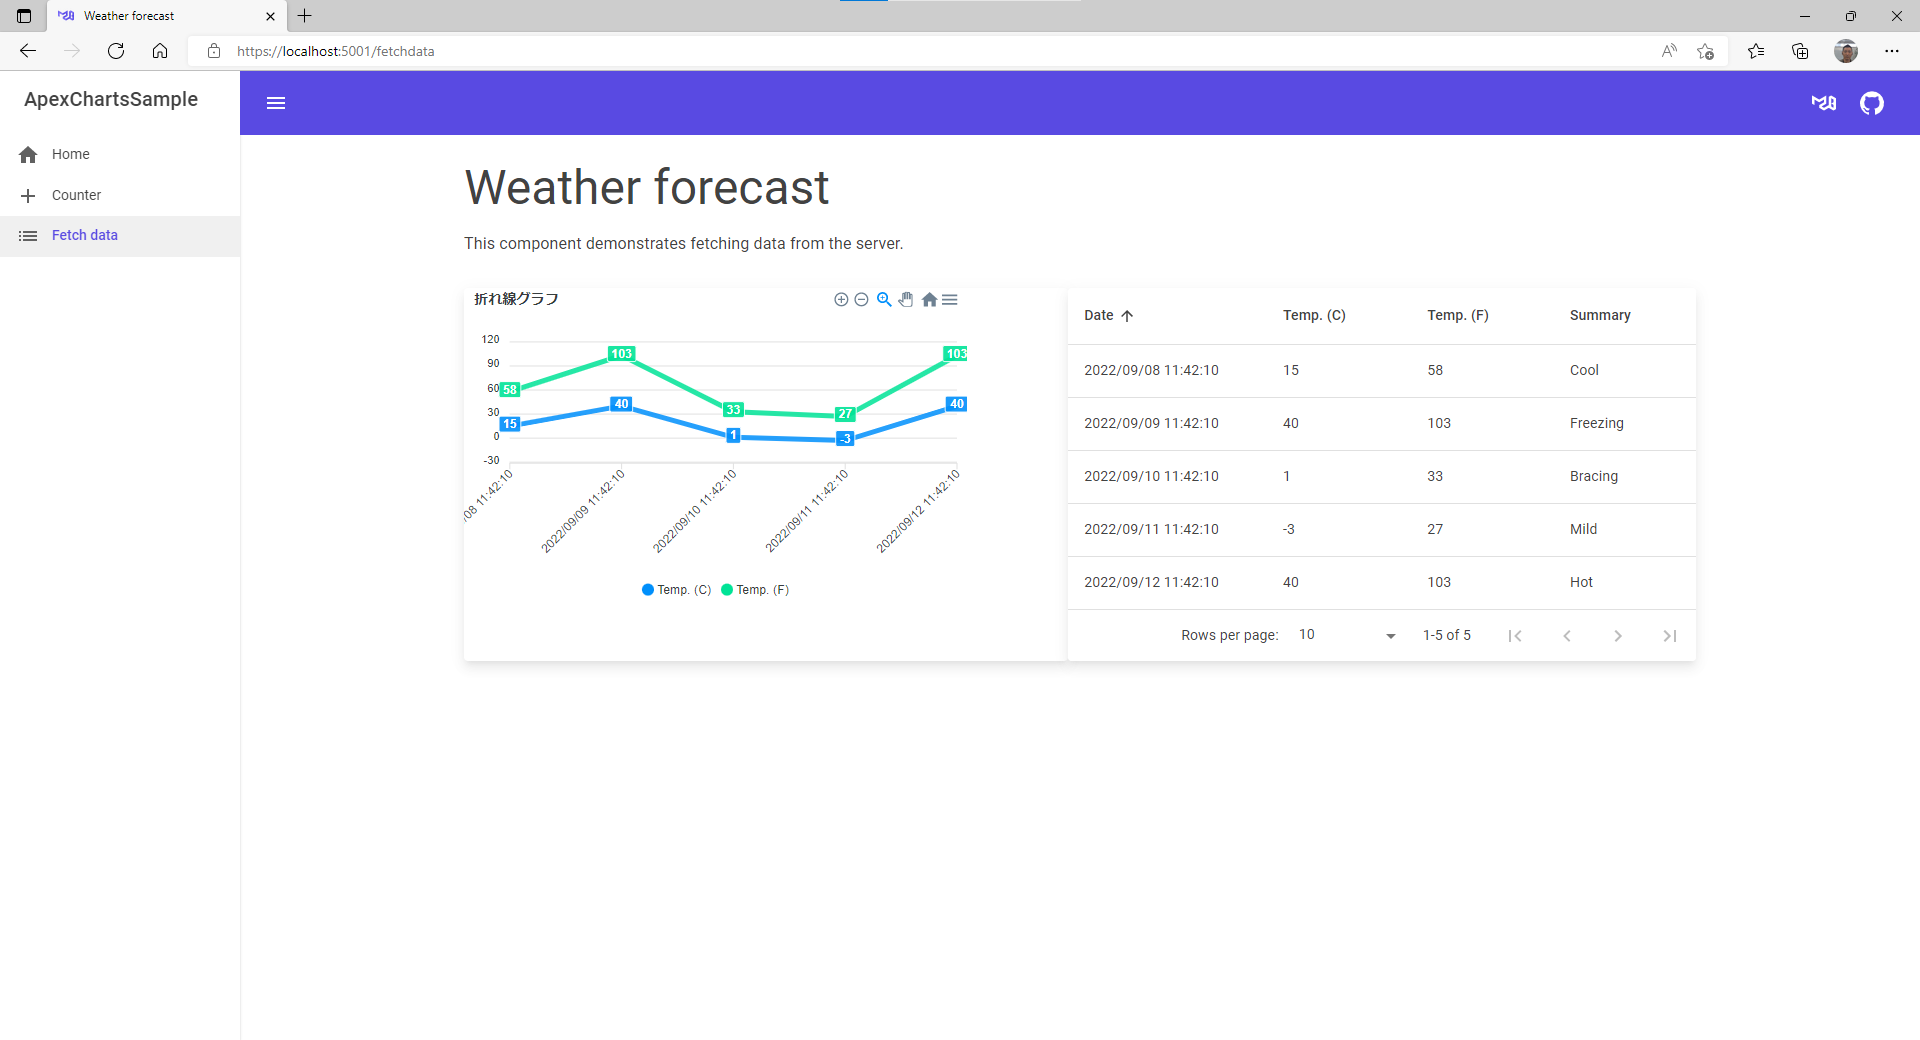
- とりあえず、折れ線グラフ
- データは、既にデモページに用意されているので、そのまま流用しています。
FetchData.razor
@page "/fetchdata"
@inject HttpClient Http
@using ApexChartsSample.Shared

<PageTitle>Weather forecast</PageTitle>

<MudText Typo="Typo.h3" GutterBottom="true">Weather forecast</MudText>
<MudText Class="mb-8">This component demonstrates fetching data from the server.</MudText>
@if (forecasts == null)
{
    //<MudProgressCircular Color="Color.Default" Indeterminate="true" />
    <MudProgressCircular Color="MudBlazor.Color.Default" Indeterminate="true" />
}
else
{
+    <div class="d-flex flex-grow-1 flex-row">
+        <MudPaper Elevation="25" Class="flex-grow-1">
+            <ApexChart TItem="WeatherForecast" Title="折れ線グラフ">
+                <ApexPointSeries TItem="WeatherForecast"
+                             Items="forecasts"
+                             Name="Temp. (C)"
+                             SeriesType="SeriesType.Line"
+                             XValue="@(e => e.Date.ToString("yyyy/MM/dd HH:mm:ss"))"
+                             YAggregate="@(e => e.Sum(e => e.TemperatureC))"
+                             OrderBy="e=>e.X"
+                             ShowDataLabels />
+                <ApexPointSeries TItem="WeatherForecast"
+                             Items="forecasts"
+                             Name="Temp. (F)"
+                             SeriesType="SeriesType.Line"
+                             XValue="@(e => e.Date.ToString("yyyy/MM/dd HH:mm:ss"))"
+                             YAggregate="@(e => e.Sum(e => e.TemperatureF))"
+                             OrderBy="e=>e.X"
+                             ShowDataLabels />
+            </ApexChart>
+        </MudPaper>
+
+        <MudPaper Elevation="25" Class="flex-grow-1">
            <MudTable Items="forecasts" Hover="true" SortLabel="Sort By" Elevation="0">
                <HeaderContent>
                    <MudTh><MudTableSortLabel InitialDirection="SortDirection.Ascending" SortBy="new Func<WeatherForecast, object>(x=>x.Date)">Date</MudTableSortLabel></MudTh>
                    <MudTh><MudTableSortLabel SortBy="new Func<WeatherForecast, object>(x=>x.TemperatureC)">Temp. (C)</MudTableSortLabel></MudTh>
                    <MudTh><MudTableSortLabel SortBy="new Func<WeatherForecast, object>(x=>x.TemperatureF)">Temp. (F)</MudTableSortLabel></MudTh>
                    <MudTh><MudTableSortLabel SortBy="new Func<WeatherForecast, object>(x=>x.Summary!)">Summary</MudTableSortLabel></MudTh>
                </HeaderContent>
                <RowTemplate>
                    <MudTd DataLabel="Date">@context.Date</MudTd>
                    <MudTd DataLabel="Temp. (C)">@context.TemperatureC</MudTd>
                    <MudTd DataLabel="Temp. (F)">@context.TemperatureF</MudTd>
                    <MudTd DataLabel="Summary">@context.Summary</MudTd>
                </RowTemplate>
                <PagerContent>
                    <MudTablePager PageSizeOptions="new int[]{50, 100}" />
                </PagerContent>
            </MudTable>
+        </MudPaper>
+    </div>
}


@code {
    private WeatherForecast[]? forecasts;

    protected override async Task OnInitializedAsync()
    {
        forecasts = await Http.GetFromJsonAsync<WeatherForecast[]>("WeatherForecast");
    }
}
完成
- とりあえず、完成です。
MudBlazorのMudChartの場合
- 冒頭に書きましたがわざわざラベルと値をそれぞれ配列に変換して格納しないといけないので、ちょっと不便です。
- それでも使用する場合は、以下のようなコードになるのと思います。
FetchData.razor
~~<<省略>>~~
-    <div class="d-flex flex-grow-1 flex-row"> 削除
+    <div class="d-flex flex-grow-1 flex-column">
+       <MudGrid>
+           <MudItem sm="6">
                <MudPaper Elevation="25" Class="flex-grow-1">
                    <ApexChart TItem="WeatherForecast" Title="折れ線グラフ">
                        <ApexPointSeries TItem="WeatherForecast"
                                     Items="forecasts"
                                     Name="Temp. (C)"
                                     SeriesType="SeriesType.Line"
                                     XValue="@(e => e.Date.ToString("yyyy/MM/dd HH:mm:ss"))"
                                     YAggregate="@(e => e.Sum(e => e.TemperatureC))"
                                     OrderBy="e=>e.X"
                                     ShowDataLabels />
                        <ApexPointSeries TItem="WeatherForecast"
                                     Items="forecasts"
                                     Name="Temp. (F)"
                                     SeriesType="SeriesType.Line"
                                     XValue="@(e => e.Date.ToString("yyyy/MM/dd HH:mm:ss"))"
                                     YAggregate="@(e => e.Sum(e => e.TemperatureF))"
                                     OrderBy="e=>e.X"
                                     ShowDataLabels />
                    </ApexChart>
                </MudPaper>
+            </MudItem>
+            <MudItem sm="6">
+                <MudPaper Elevation="25" Class="flex-grow-1">
+                    <MudChart ChartType="MudBlazor.ChartType.Line" ChartSeries="@Series" @bind-SelectedIndex="Index" XAxisLabels="@XAxisLabels" Width="100%" ></MudChart>
+                </MudPaper>
+            </MudItem>
        </MudGrid>

~~<<省略>>~~
}

@code {
    private WeatherForecast[]? forecasts;
+    private int Index = -1;
+    private List<ChartSeries> Series = new List<ChartSeries>();
+    private string[] XAxisLabels;
+
    protected override async Task OnInitializedAsync()
    {
        forecasts = await Http.GetFromJsonAsync<WeatherForecast[]>("WeatherForecast");
+
+       var logs = forecasts.OrderBy(x => x.Date).ToList();
+
+       double[] _TemperatureC = new double[logs.Count()];
+       double[] _TemperatureF = new double[logs.Count()];
+       string[] _Lable = new string[logs.Count()];
+
+        foreach (var item in logs)
+        {
+            Index += 1;
+            _TemperatureC[Index] = item.TemperatureC;
+            _TemperatureF[Index] = item.TemperatureF;
+            _Lable[Index] = item.Date.ToString("yyyy/MM/dd HH:mm:ss");
+        }
+
+        Series = new List<ChartSeries>() {
+            new ChartSeries() { Name = "Temp. (C)", Data = _TemperatureC },
+            new ChartSeries() { Name = "Temp. (F)", Data = _TemperatureF }
+        };
+
+        XAxisLabels = _Lable;
+
+        StateHasChanged();
    }
}
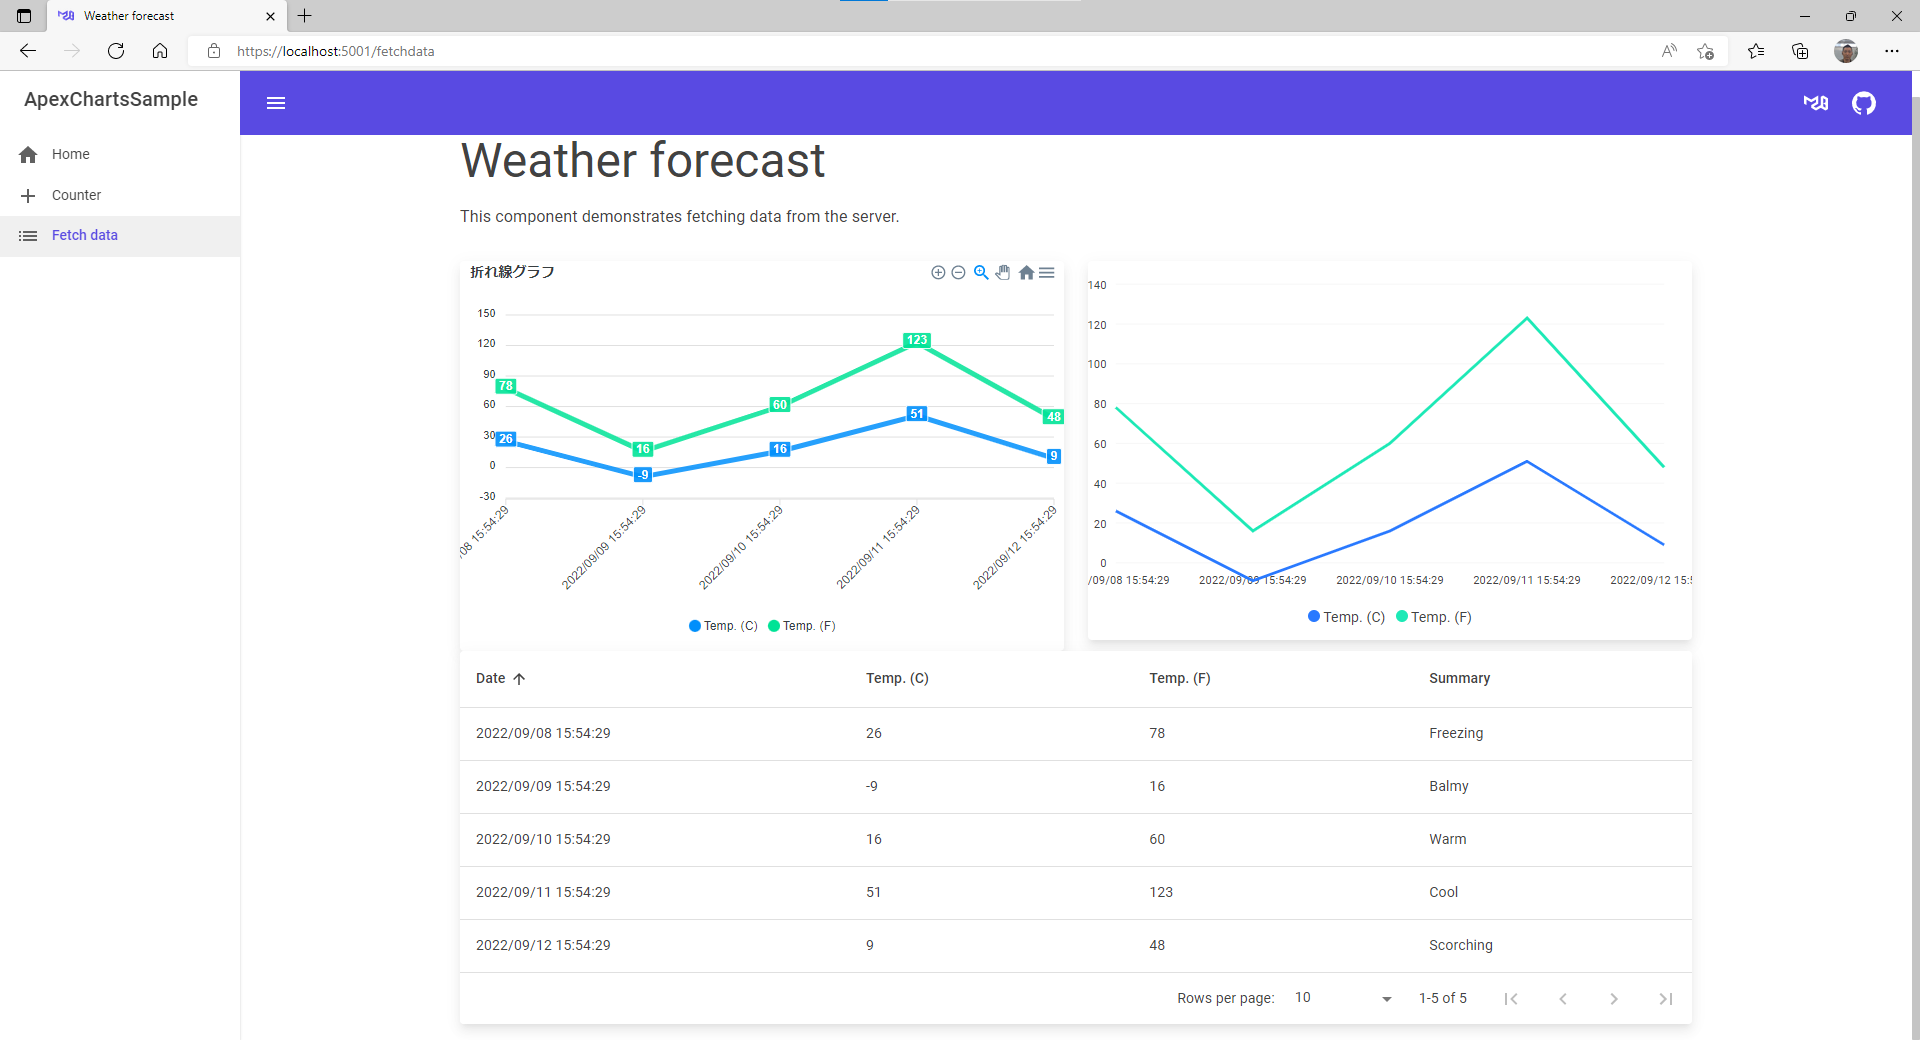
- 左がApexCharts、右がMudChart
- マイナスがうまく表示できなかった。
まとめ
- MudBlazorにチャートを入れるのであれば、MudChartじゃなくてApexChartsの方がそのままクラスモデルを使用できるので、個人的感想としては、ApexChartsが良いと思いました。
- ただ、どちらもC#でかけるのは良いですね。
