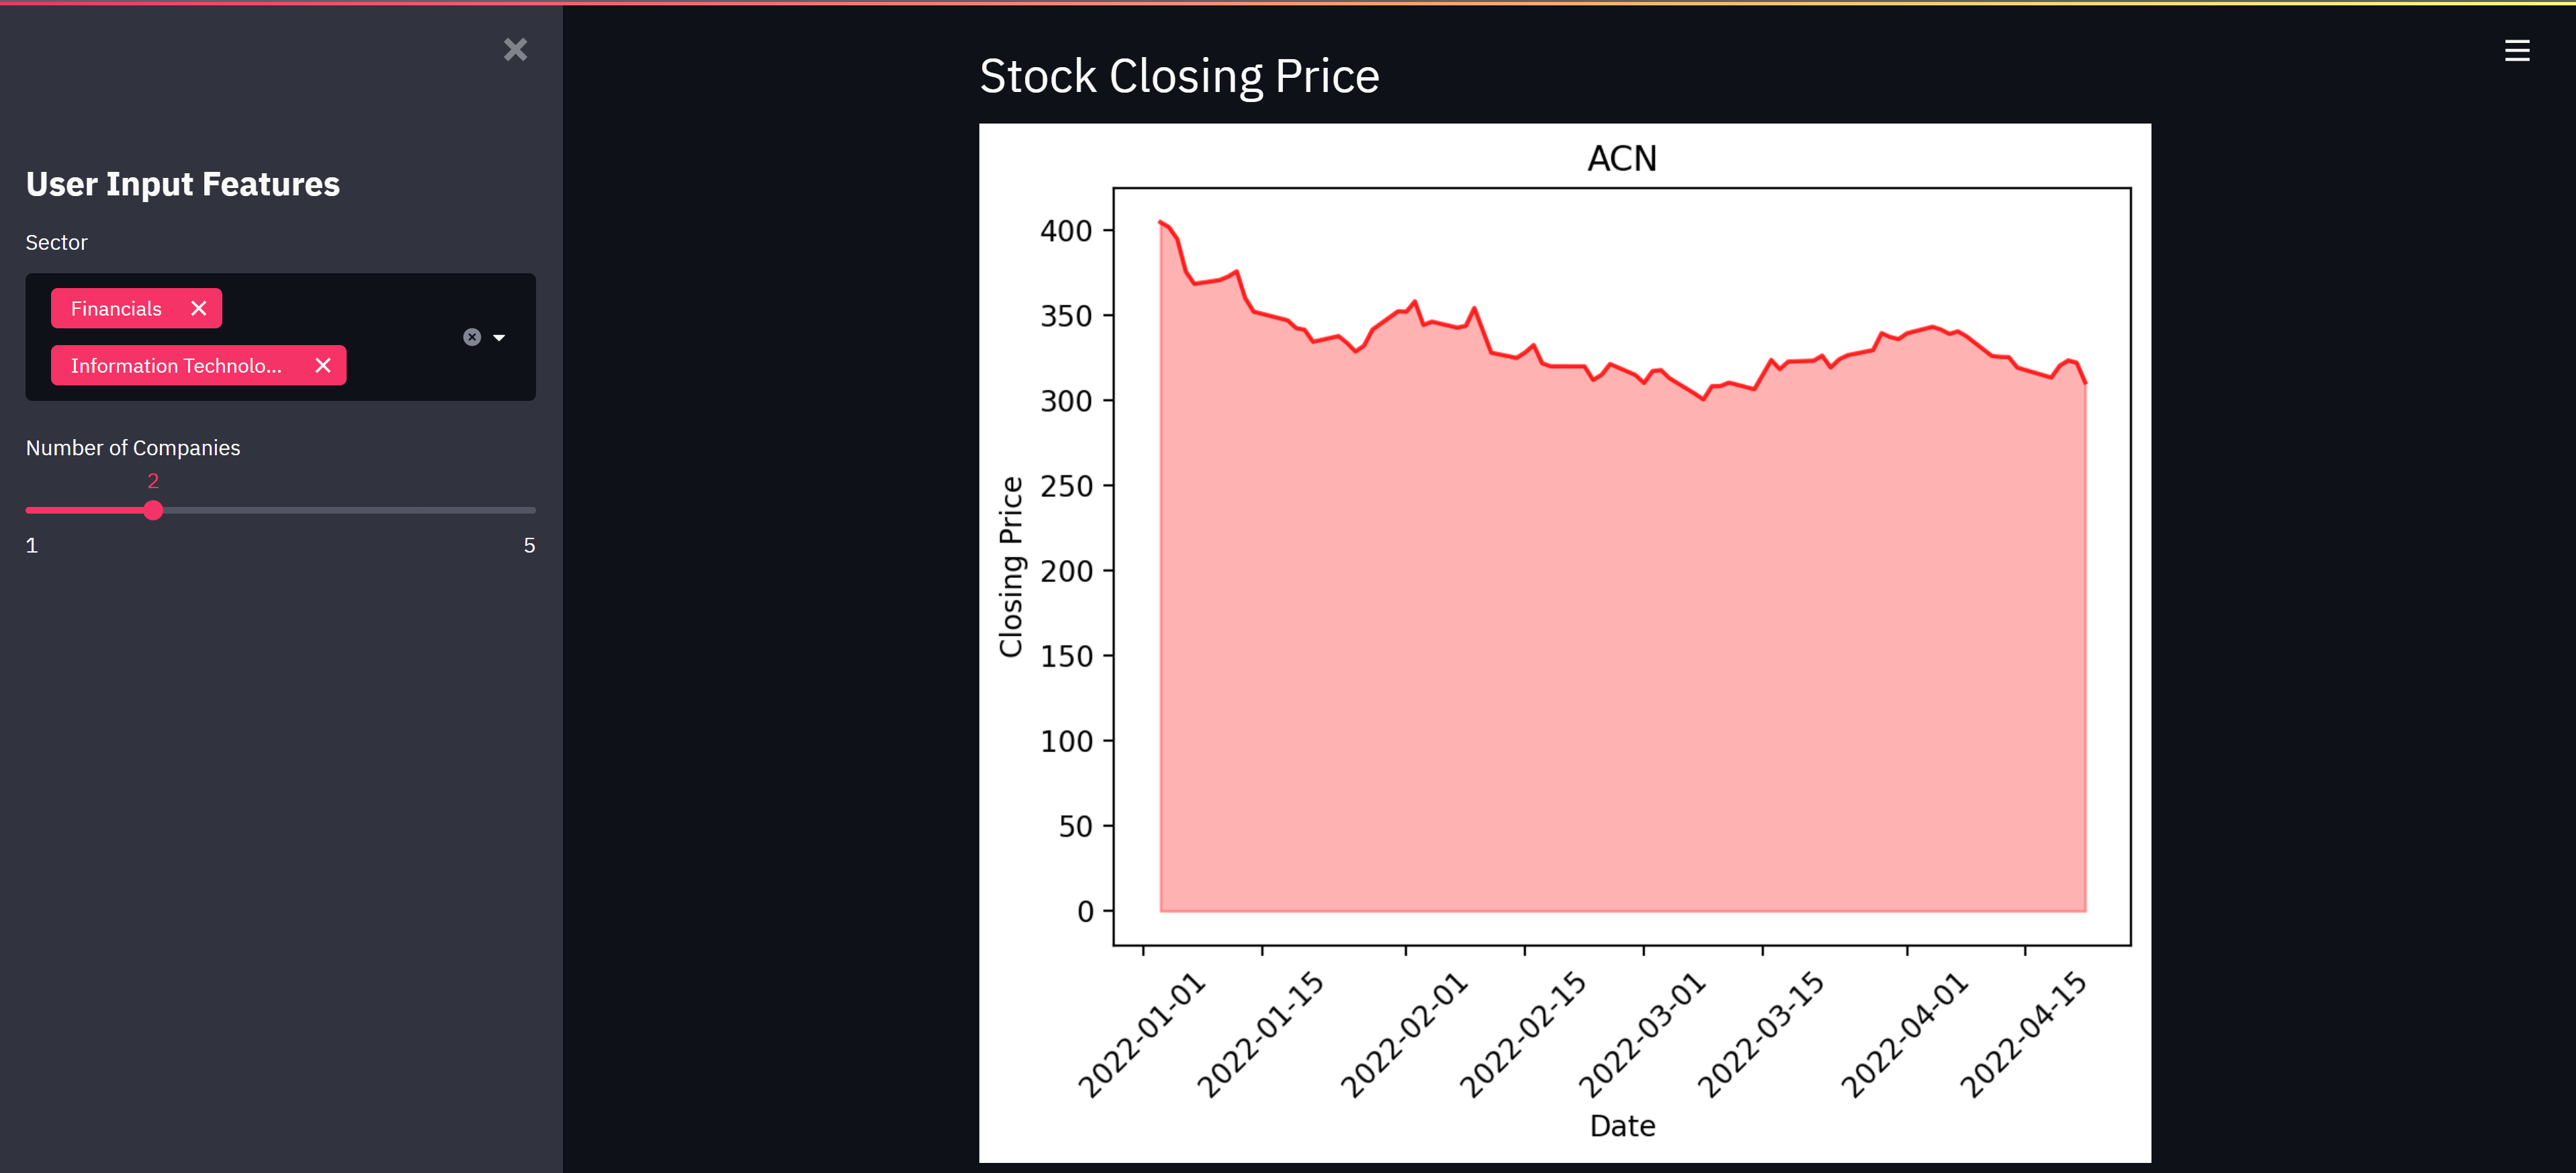
ダッシュボードは、企業業績の包括的なスナップショットです。ダッシュボードの性質は動的であるため、パフォーマンスの任意の領域をクリックし、「ドリルダウン」して詳細を確認することができます。ダッシュボードの機能は、データウェアハウスで収集されたすべてのデータ、つまり主要業績評価指標(KPI)を集約して価値を抽出し、信頼性の高い結果を提供することです。こうすることで、技術者でないユーザーでもデータを理解しやすくなるのです。ここでは、StreamlitとGridDBを使って、ダッシュボードのWebアプリを構築することにします。Streamlitを使えば、データスクリプトを数分で共有可能なWebアプリにすることができます。
最初のステップとして、S&P500データの簡単なスクレイパーを作成します。ティッカーシンボルを取得した後、結果のリストはPythonのyfinanceライブラリから株価データを取得するために使用します。最後に、両方の機能を組み合わせたウェブアプリを作成します。
チュートリアルの概要は以下の通りです
- 前提条件と環境設定
- データセット概要
- 必要なライブラリのインポート
- データセットの読み込み
- ダッシュボードの構築
- まとめ
前提条件と環境設定
このプロジェクトでは、Streamlit をインストールし、Python クライアントと共に GridDB をインストールする必要があります。チュートリアルを続ける前に、以下のパッケージがインストールされている必要があります。
- Pandas
- matplotlib
- griddb_python
- Streamlit
- seaborn
- numpy
- yfinance
これらのパッケージは Conda の仮想環境に conda install package-name を使ってインストールすることができます。ターミナルやコマンドプロンプトから直接Pythonを使っている場合は、 pip install package-name でインストールできます。
GridDBのインストール
このチュートリアルでは、データセットをロードする際に、GridDB を使用する方法と、Pandas を使用する方法の 2 種類を取り上げます。Pythonを使用してGridDBにアクセスするためには、以下のパッケージも予めインストールしておく必要があります。
- GridDB Cクライアント
- SWIG (Simplified Wrapper and Interface Generator)
- GridDB Pythonクライアント
データセット概要
S&P 500は、S&P Dow Jones Indicesによって管理されている株式市場のインデックスです。アメリカの証券取引所で取引されている大型企業500社が発行する普通株式504銘柄で構成されています。S&P 500と呼ばれていますが、構成銘柄のうち5社はデュアル・クラス・ストックのため、505銘柄で構成されています。
使用したデータは、以下の2つのリンク(https://en.wikipedia.org/wiki/List_of_S%26P_500_companies)と(https://pypi.org/project/yfinance/)から入手できます。
必要なライブラリとデータセットのインポート
import griddb_python as griddb
import streamlit as st
import pandas as pd
import base64
import matplotlib.pyplot as plt
import seaborn as sns
import numpy as np
import yfinance as yf
st.set_option('deprecation.showPyplotGlobalUse', False)
2022-04-25 14:04:27.637 INFO    numexpr.utils: Note: NumExpr detected 12 cores but "NUMEXPR_MAX_THREADS" not set, so enforcing safe limit of 8.
2022-04-25 14:04:27.663 INFO    numexpr.utils: NumExpr defaulting to 8 threads.
データセットの読み込み
ここで、GridDBサーバにデータをロードする必要があります。CSVファイルから直接読み込むことも可能ですが、GridDBのハイブリッドインメモリアーキテクチャを活用することで、アプリケーションの高速化を図ることができます。また、必要なデータをデータフレームにロードすることで、クエリのパフォーマンスを向上させることができます。
GridDBを利用する
GridDB™は、IoTやビッグデータに最適な高スケーラブルNoSQLデータベースです。GridDBの理念の根幹は、IoTに最適化された汎用性の高いデータストアの提供、高いスケーラビリティ、高性能なチューニング、高い信頼性の確保にあります。
大量のデータを保存する場合、CSVファイルでは面倒なことがあります。GridDBは、オープンソースでスケーラブルなデータベースとして、完璧な代替手段となっています。GridDBは、スケーラブルでインメモリなNoSQLデータベースで、大量のデータを簡単に保存することができます。GridDBを初めて使う場合は、「GridDB上でPandasのデータフレームを使用する」のチュートリアルが役に立ちます。
まず、すべてのデータ(CSV形式)をGridDBサーバにロードします。CSVからdataframeオブジェクトに直接読み込むこともできますが、GridDBのハイブリッドインメモリアーキテクチャにより、まずデータベースに読み込むことでアプリケーションの速度が大幅に向上します。
factory = griddb.StoreFactory.get_instance()

# Initialize the GridDB container (enter your database credentials)
try:
    gridstore = factory.get_store(host=host_name, port=your_port,
            cluster_name=cluster_name, username=admin,
            password=admin)

    info = griddb.ContainerInfo("S&P500",
                    [["Symbol", griddb.Type.STRING],["Security", griddb.Type.STRING],[" SEC filings", griddb.Type.STRING],
                     ["GICS Sector", griddb.Type.STRING],["GICS Sub-Industry", griddb.Type.STRING],
                     ["Headquarters Location", griddb.Type.STRING],["Date first added", griddb.Type.TIMESTAMP]
                     ["CIK",griddb.Type.INTEGER]], ["Founded",griddb.Type.INTEGER]],
                    griddb.ContainerType.COLLECTION, True)
    cont = gridstore.put_container(info)


sql_statement = ('SELECT * FROM S&P500')
dataset = pd.read_sql_query(sql_statement, cont)
cont変数には、データが格納されるコンテナ情報が格納されていることに注意してください。S&P500 をコンテナ名で置き換えてください。詳細はチュートリアル「GridDB上でPandasのデータフレームを使用する」に記載されています。
IoTやビッグデータのユースケースに関して言えば、GridDBはリレーショナルやNoSQLの領域の他のデータベースの中で明らかに際立っています。全体として、GridDBは高可用性とデータ保持を必要とするミッションクリティカルなアプリケーションのために、複数の信頼性機能を提供しています。
Pandasを使ったread_html
Pythonでは、ファイルを開くことによって、そのファイルにアクセスできるようにする必要があります。これはopen()関数を用いて行うことができます。open()はファイルオブジェクトを返し、そのオブジェクトは開かれたファイルに関する情報を取得し、操作するためのメソッドと属性を持っています。データをロードした後、csv形式のファイルをダウンロードします。
# @st.cache
def load_data():
    url = 'https://en.wikipedia.org/wiki/List_of_S%26P_500_companies'
    html = pd.read_html(url, header = 0)
    df = html[0]
    return df

df = load_data()
sector = df.groupby('GICS Sector')
# Sidebar - Sector selection
sorted_sector_unique = sorted( df['GICS Sector'].unique() )
selected_sector = st.sidebar.multiselect('Sector', sorted_sector_unique, sorted_sector_unique)

# Filtering data
df_selected_sector = df[ (df['GICS Sector'].isin(selected_sector)) ]
# Download S&P500 data
# https://discuss.streamlit.io/t/how-to-download-file-in-streamlit/1806
def filedownload(df):
    csv = df.to_csv(index=False)
    b64 = base64.b64encode(csv.encode()).decode()  # strings <-> bytes conversions
    href = f'<a href="data:file/csv;base64,{b64}" download="SP500.csv">Download CSV File</a>'
    return href

st.markdown(filedownload(df_selected_sector), unsafe_allow_html=True)
DeltaGenerator(_root_container=0, _provided_cursor=None, _parent=None, _block_type=None, _form_data=None)
# https://pypi.org/project/yfinance/

data = yf.download(
        tickers = list(df_selected_sector[:10].Symbol),
        period = "ytd",
        interval = "1d",
        group_by = 'ticker',
        auto_adjust = True,
        prepost = True,
        threads = True,
        proxy = None
    )
[*********************100%***********************] 10 of 10 completed
df.head()
| Symbol | Security | SEC filings | GICS Sector | GICS Sub-Industry | Headquarters Location | Date first added | CIK | Founded | |
|---|---|---|---|---|---|---|---|---|---|
| 0 | MMM | 3M | reports | Industrials | Industrial Conglomerates | Saint Paul, Minnesota | 1976-08-09 | 66740 | 1902 |
| 1 | AOS | A. O. Smith | reports | Industrials | Building Products | Milwaukee, Wisconsin | 2017-07-26 | 91142 | 1916 |
| 2 | ABT | Abbott | reports | Health Care | Health Care Equipment | North Chicago, Illinois | 1964-03-31 | 1800 | 1888 |
| 3 | ABBV | AbbVie | reports | Health Care | Pharmaceuticals | North Chicago, Illinois | 2012-12-31 | 1551152 | 2013 (1888) |
| 4 | ABMD | Abiomed | reports | Health Care | Health Care Equipment | Danvers, Massachusetts | 2018-05-31 | 815094 | 1981 |
データセットが読み込まれたら、次はそのデータセットを調べてみましょう。head() 関数を使って、このデータセットの最初の5行を表示してみましょう。
data.head()
| MMM | ATVI | ... | ABMD | ADM | |||||||||||||||||
|---|---|---|---|---|---|---|---|---|---|---|---|---|---|---|---|---|---|---|---|---|---|
| Date | Open | High | Low | Close | Volume | Open | High | Low | Close | Volume | ... | Open | High | Low | Close | Volume | Open | High | Low | Close | Volume |
| 2022-01-03 | 176.612779 | 177.375396 | 174.156512 | 176.038330 | 1930700 | 66.047409 | 67.270137 | 65.411191 | 67.021614 | 13208100 | ... | 358.000000 | 366.320007 | 353.320007 | 366.290009 | 240000 | 67.242850 | 67.799896 | 67.014069 | 67.531319 | 2134200 |
| 2022-01-04 | 176.771225 | 179.524608 | 176.325537 | 178.504471 | 2522200 | 67.439135 | 67.608136 | 66.534516 | 66.802917 | 9464000 | ... | 366.290009 | 368.970001 | 355.450012 | 361.589996 | 316200 | 68.197774 | 69.321808 | 68.018724 | 68.784660 | 2898800 |
| 2022-01-05 | 175.434170 | 180.039645 | 175.305410 | 177.771576 | 2952400 | 66.802911 | 67.459015 | 65.868471 | 65.898293 | 14988200 | ... | 359.429993 | 364.109985 | 337.480011 | 338.200012 | 359200 | 68.844341 | 69.301910 | 68.207723 | 68.247513 | 2665400 |
| 2022-01-06 | 179.148254 | 179.544418 | 175.840220 | 176.295822 | 2505400 | 65.769067 | 65.868475 | 63.333540 | 63.442890 | 15071100 | ... | 337.529999 | 343.359985 | 326.000000 | 336.440002 | 245600 | 68.675245 | 69.301913 | 68.446456 | 68.854294 | 1920000 |
| 2022-01-07 | 176.424590 | 178.761996 | 175.523299 | 178.227158 | 2800200 | 63.611887 | 64.516509 | 62.955787 | 63.661591 | 21467900 | ... | 334.790009 | 336.029999 | 319.040009 | 319.279999 | 434200 | 68.973652 | 69.490909 | 68.585713 | 69.441170 | 2029200 |
5 rows × 50 columns
ダッシュボードの構築
Streamlitを使えば、様々な方法でアプリにテキストを追加することができます。以下はその一例です。私たちのダッシュボードでは、Markdownを使って小さな段落や書き込みも追加していきます。
# Dashboard Title and paragraphs
st.title('S&P 500 Dashboard | Streamlit & GridDB')

st.markdown("""
This Streamlit App made using the power of GridDB retrieves the list of the **S&P 500** and its corresponding **stock closing price**.
* **Data source:** [Wikipedia](https://en.wikipedia.org/wiki/List_of_S%26P_500_companies) and [Yahoo finance library] (https://pypi.org/project/yfinance/).
""")
ドロップダウンでは、シリーズから選択するために st.selectbox を使用します。欲しいオプションを書き込んだり、配列やデータフレームのカラムを渡したりすることができます。
st.header('Display Companies in Selected Sector')
st.write('Data Dimension: ' + str(df_selected_sector.shape[0]) + ' rows and ' + str(df_selected_sector.shape[1]) + ' columns.')
st.dataframe(df_selected_sector)
Streamlit がサポートしているデータチャートライブラリには、Matplotlib、Altair、Plotly などの有名なものがあります。私たちのダッシュボードでは、Matplotlibを使用します。
また、Streamlit の外観をすっきりさせるサイドバーがあり、アプリをページの左側に配置したまま、すべてのウィジェットをそこに移動させることができます。state サイドバー用のウィジェットと、st.sidebar を使ってドロップダウン・フィルターを作ってみましょう。
以下は、株価の終値データをよく見るために必要な折れ線グラフのコードです。
# Plot Closing Price of Query Symbol
def price_plot(symbol):
  df = pd.DataFrame(data[symbol].Close)
  df['Date'] = df.index
  plt.fill_between(df.Date, df.Close, color='red', alpha=0.3)
  plt.plot(df.Date, df.Close, color='red', alpha=0.8 )
  plt.xticks(rotation=45)
  plt.title(symbol, fontweight='normal')
  plt.xlabel('Date', fontweight='normal')
  plt.ylabel('Closing Price', fontweight='normal')
  return st.pyplot()

num_company = st.sidebar.slider('Number of Companies', 1, 5)

if st.button('Show Plots'):
    st.header('Stock Closing Price')
    for i in list(df_selected_sector.Symbol)[:num_company]:
        price_plot(i)
さて、これでコードの作成は終了です。ターミナルを開いて main.py があるパスに移動し、コマンドラインで次のように入力して Streamlit ウェブサーバを起動します。
streamlit run main.py
デフォルトでは、ポート番号8501で実行されます。ブラウザを開き、このURL http://localhost:8501 をクリックすると、ブラウザ上でダッシュボードが表示されます。
結論
このチュートリアルでは、GridDBとStreamlitの力を使って、素晴らしいダッシュボードを作りました。データをインポートする方法として、(1) GridDB と (2) Pandas read_html の2つを検討しました。GridDBはオープンソースで拡張性が高いので、大きなデータセットの場合、ノートブックにデータをインポートするための優れた代替手段を提供します。

