PR曲線とROC曲線、図などを書きながら両者を深く理解しました。浅く理解したけど、もう一歩踏み込むための解説です。不均衡データの場合にどうなるかも書いています。
PR曲線: Precision Recall Curve
Precision と Recall
PR曲線の前にまずは、PrecisionをRecallのおさらいからです。自分の以下の記事と同じことを書きます。
妊娠か否かを例とした場合の混合行列です。
| 実際は妊娠中 (Positive) |
実際は非妊娠 (Negative) |
|
|---|---|---|
| 予測が妊娠中 (Positive) |
 |
 |
| 予測が非妊娠 (Negative) |
 |
 |
ひらたく言うとこういうことです(わかりやすいかと思い表現を変えています)。
- TP: 妊婦に妊娠と予測し正解
- FP: お腹が出ていたので妊娠と予測したら実はただ太っていただけ(第1種の誤り)
- FN: スリムだったので非妊娠と予測したら妊婦だった(第2種の誤り)
- TN: 非妊娠な人に非妊娠と予測し正解
| 指標 | 意味 | 式 | 図解(分母と分子) |
|---|---|---|---|
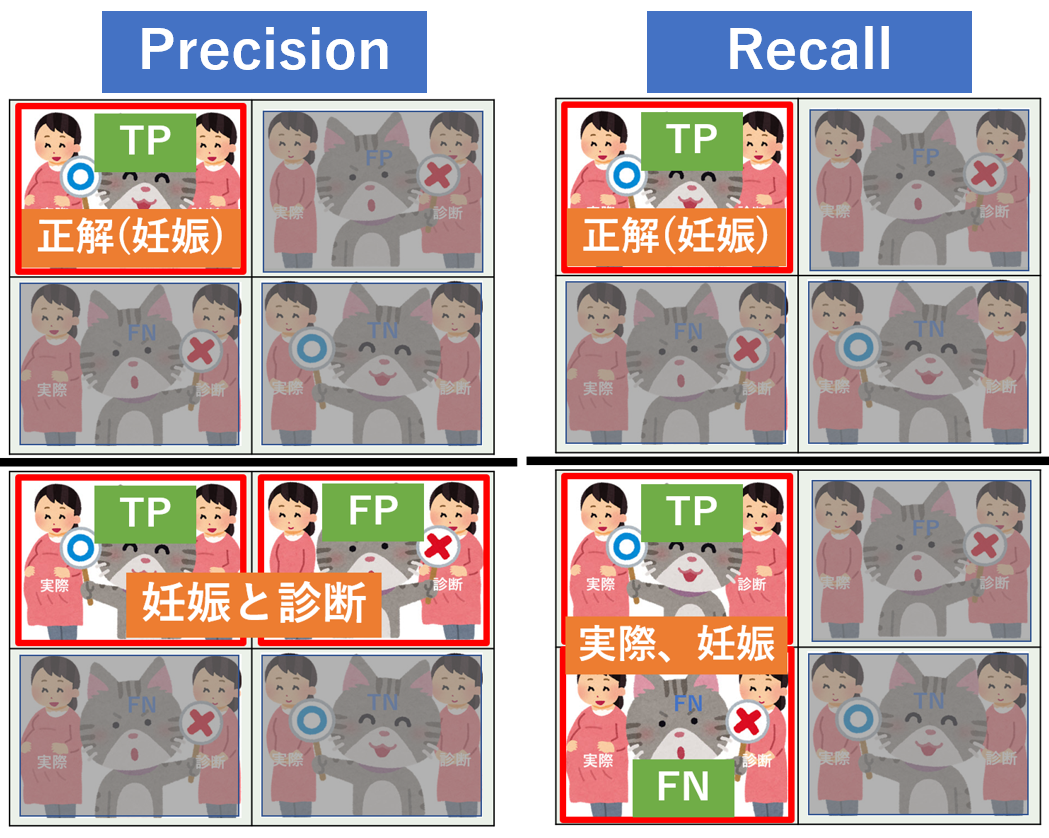
| 適合率(Precision) | 正予測の正答率 | $\frac{TP}{TP + FP}$ |  |
| 再現率(Recall) | 正に対する正答率 | $\frac{TP}{TP + FN}$ |  |
混合行列形式比較を横並びにすると両者比較がわかりやすいと思います。分子がTPで同じで分母の一部が異なります。
ここからは、サンプルデータの予測・正解データでPrecisionとRecallの説明です。
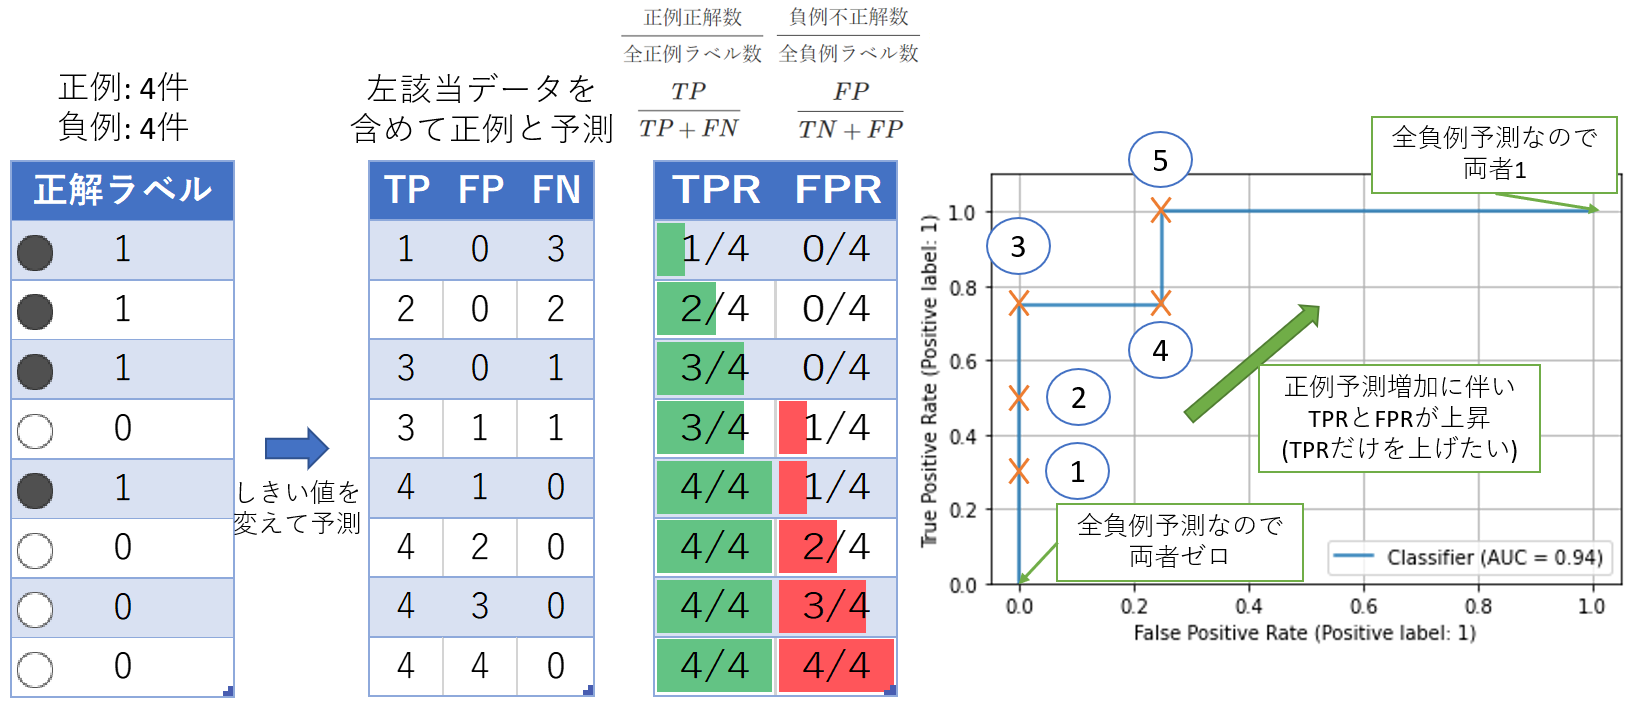
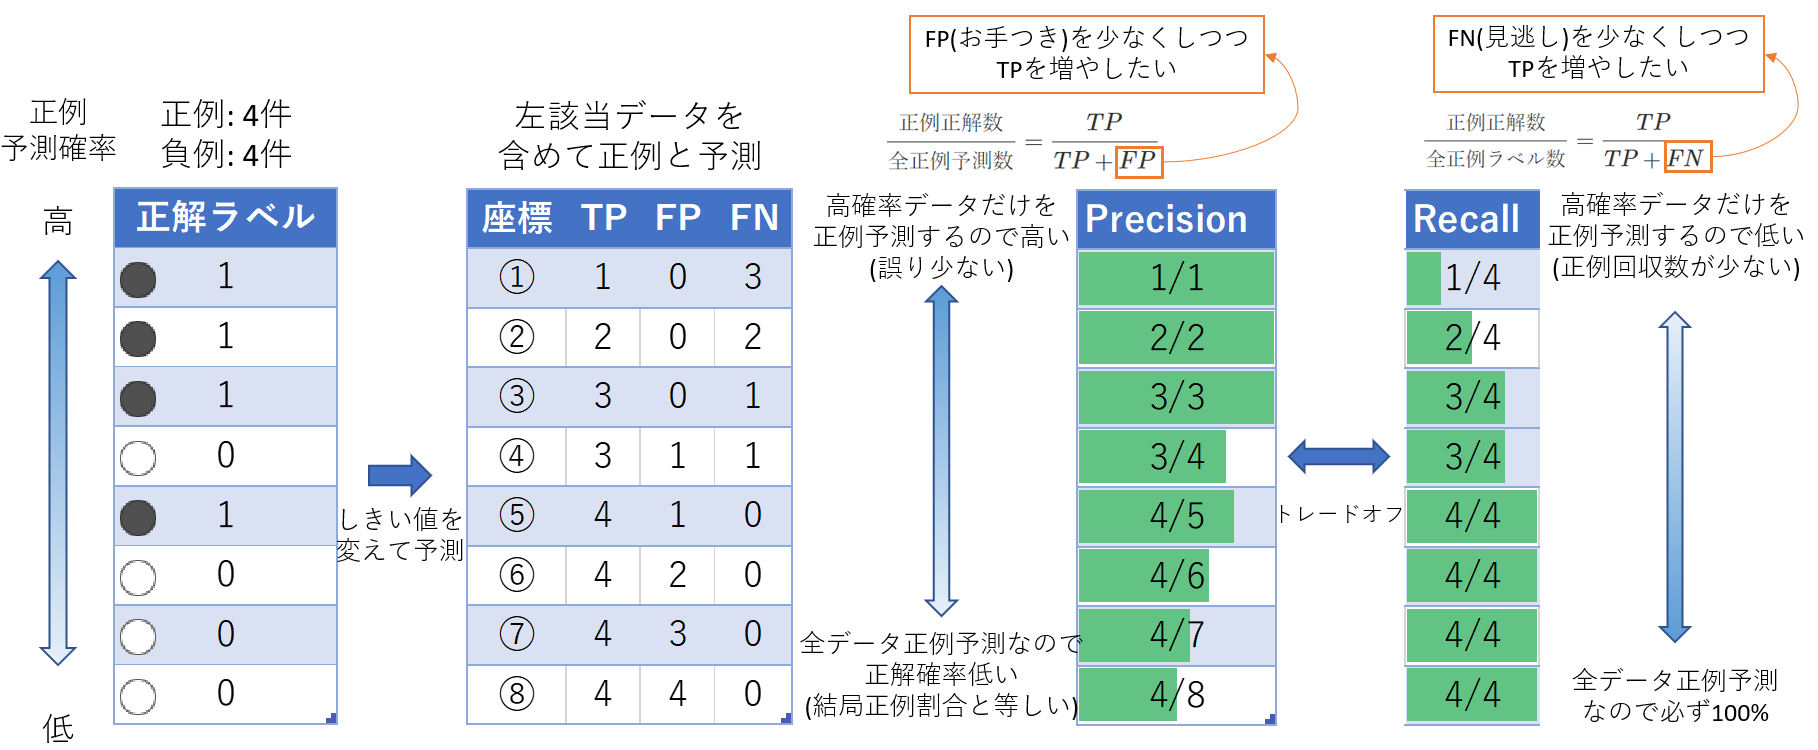
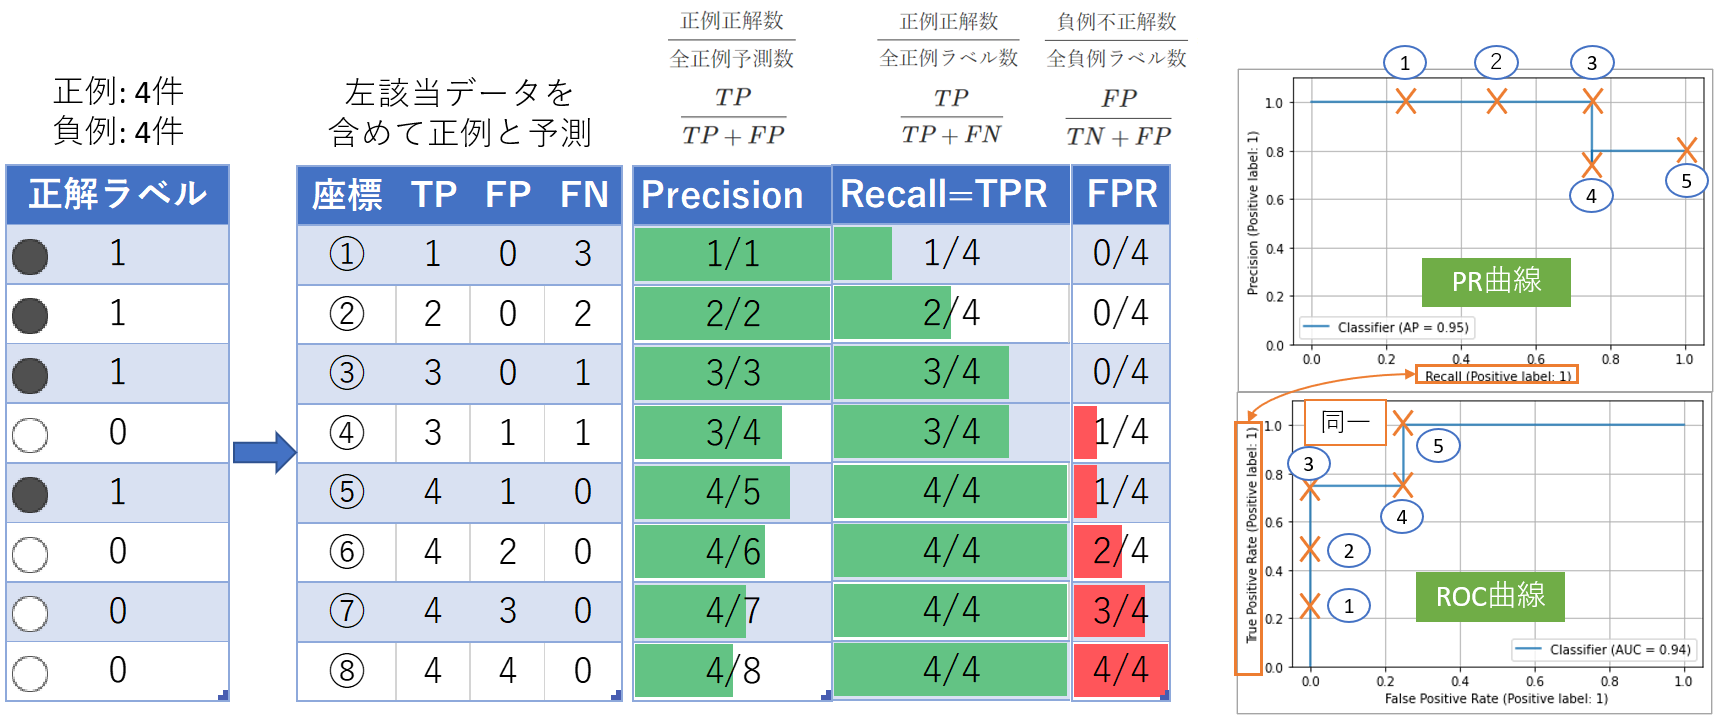
下図の左の列はサンプルの正解ラベルの表です。PR曲線の説明をしようとしているので、予測確率の絶対値は重要ではなく相対的な確率大小だけを示しています。
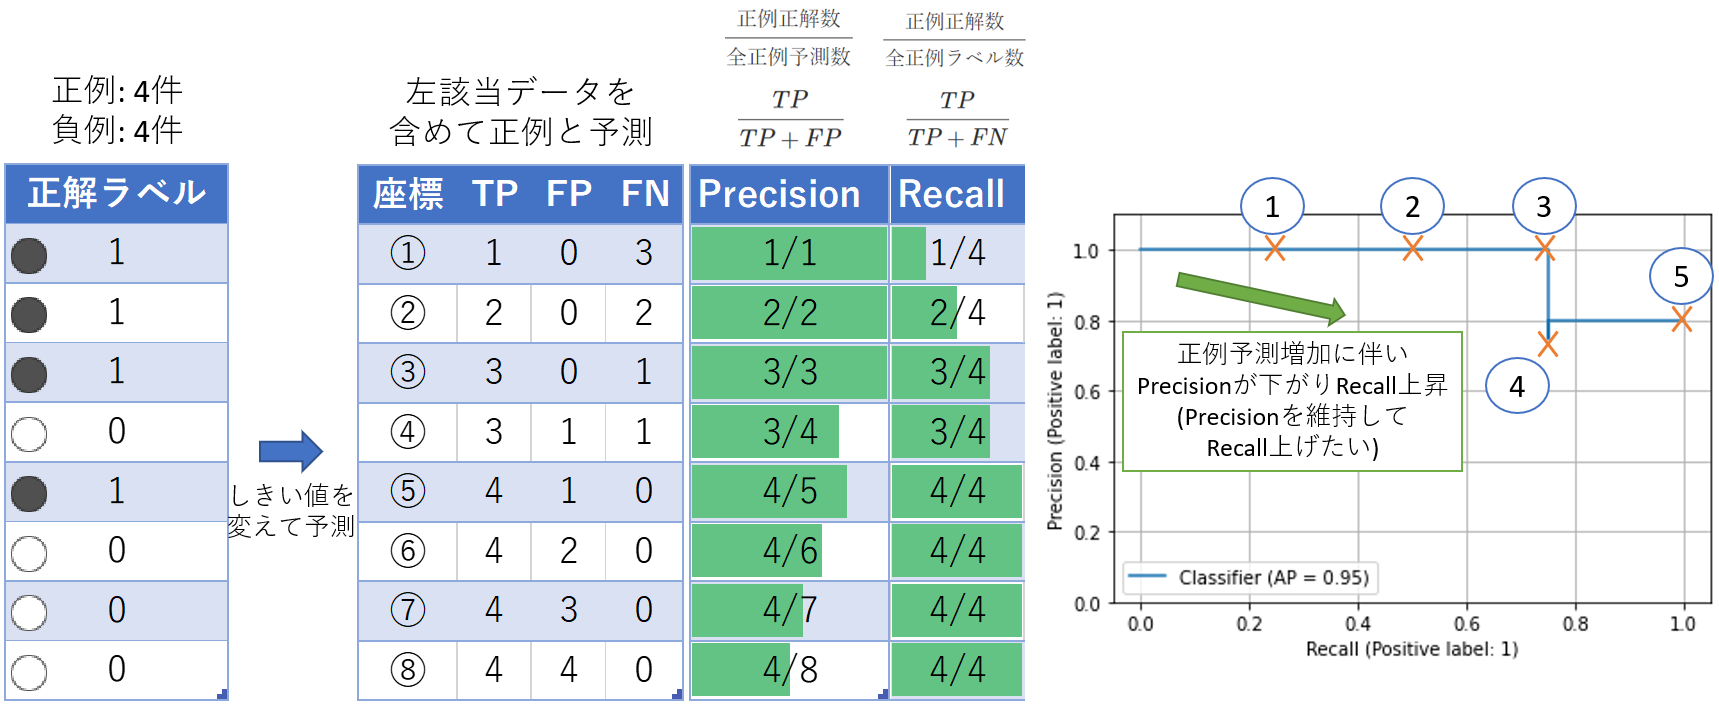
左から2番目の表で、それぞれ左表のデータより上を正例と予測した場合の座標とTP、FP、FNの数を記載(座標はあとで出てくるPR曲線内の位置に対応)。例えば1行目は、「正解ラベル」列が1行目のみ正例と判定(正解なのでTP)。あとは、負例と判定(正誤あるのでFP/FN)。
Precision と Recall の数値の大小を見るとトレードオフの関係になるのがわかります。
PR曲線
先程のサンプルデータをPR曲線にマッピングします。左上から出発して右下に線が伸びていきます。
「AP=0.95」とグラフ上に出ているのはAverage Precisionの略で、AUC: Area Under the Curveと同じ値です。
PR曲線は以下のコードで出力。
import matplotlib.pyplot as plt
import numpy as np
import pandas as pd
from sklearn.metrics import PrecisionRecallDisplay

def sample_pr():
    df = pd.DataFrame({'label': [1, 1, 1, 0, 1, 0, 0, 0],
                       'prob': np.linspace(1, 0, 8)})  # 1から0までの8つの等差数列
    display(df)
    _, ax = plt.subplots()
    PrecisionRecallDisplay.from_predictions(df['label'], df['prob'], ax=ax)
    ax.grid()
    ax.set_ylim(0, 1.1)
    plt.show()

sample_pr()
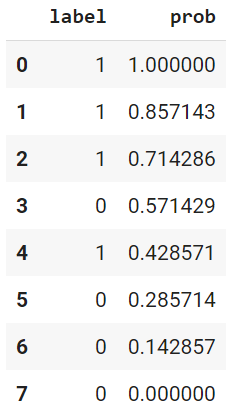
本題と関係ないけど、dataframeの中身はこんな値です(予測確率の絶対値が関係ないのが理解できます)。
ROC曲線: 受動者動作特性曲線
受信者動作特性曲線(ROC曲線: Receiver Operator Characteristics Curve)についてです。以前、「はじパタ 第3章」で勉強しています。
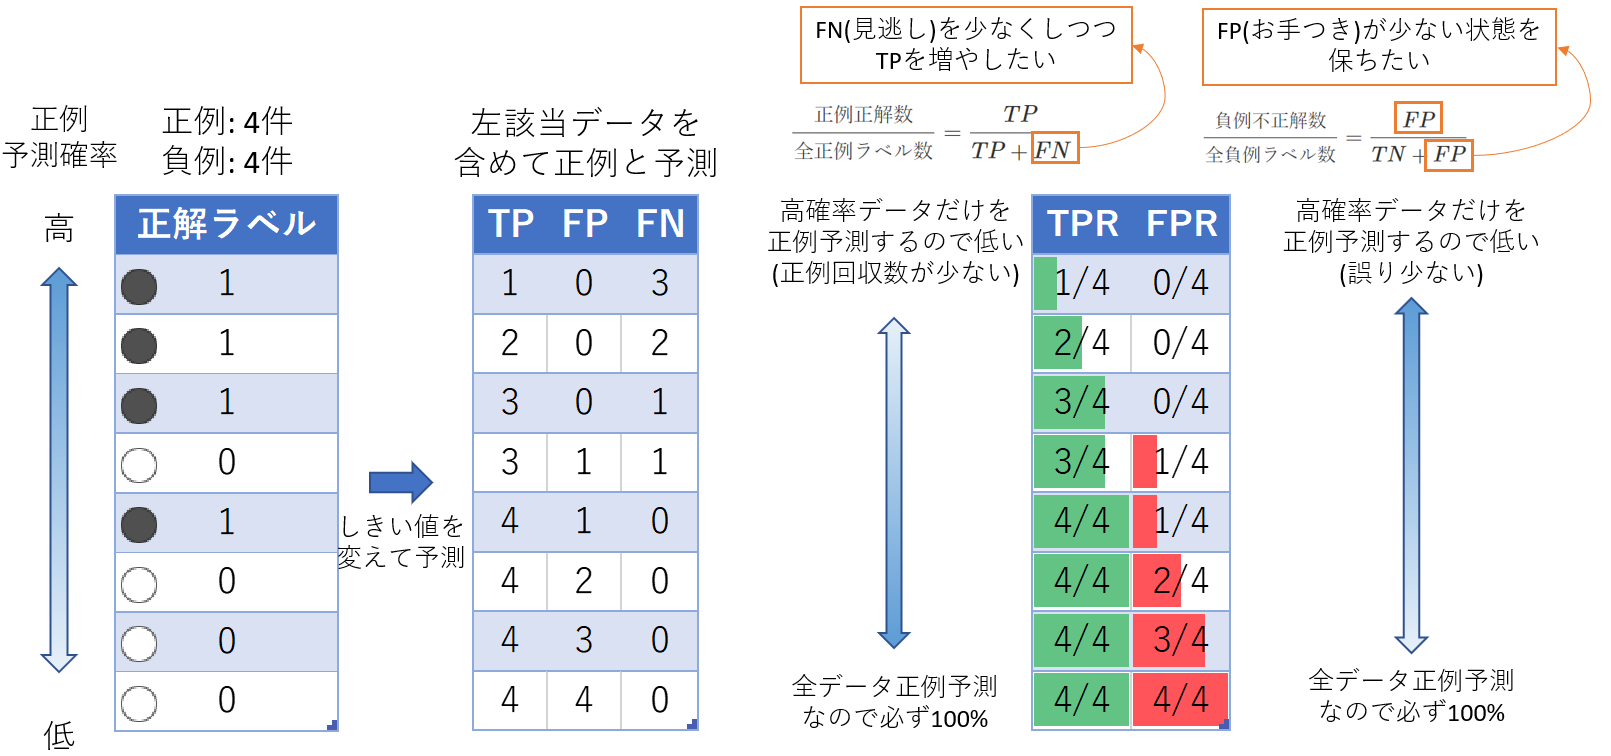
TPRとFPRで曲線を描きます。PR曲線と同様にまずはTPR(True Positive Rate)とFPR(False Positive Rate)の説明です。
混合行列形式でTPRとFPRを比較表示。TPRはRecallと同じ。
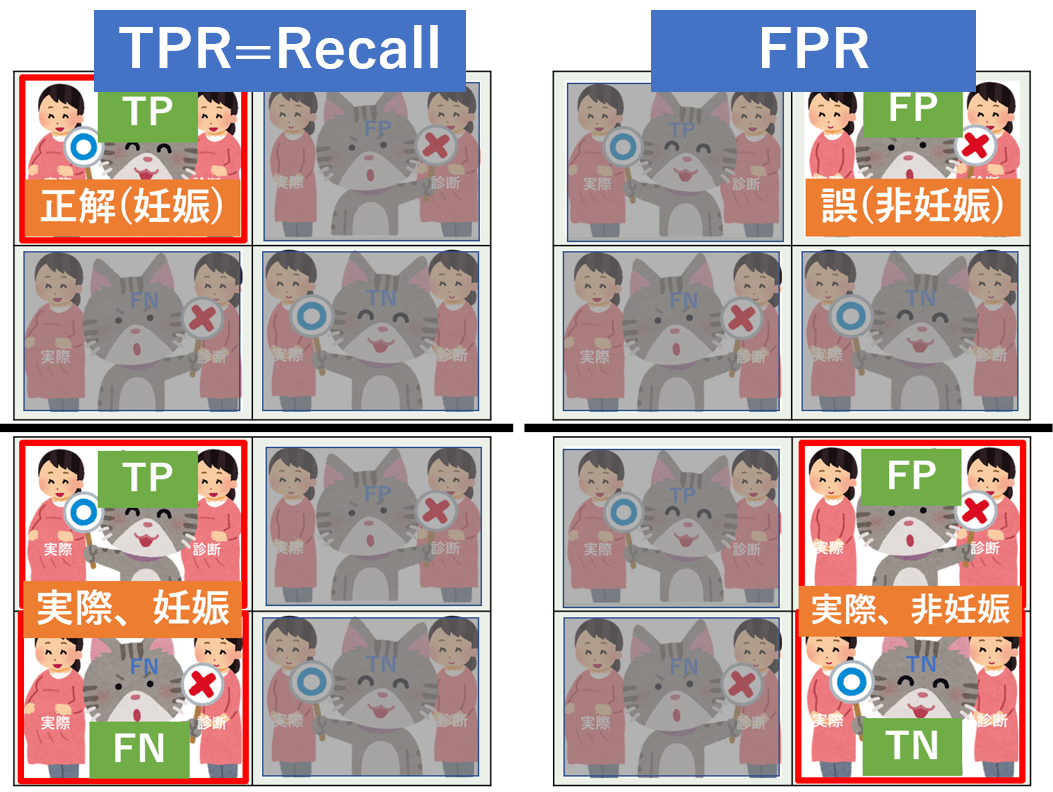
Precision, Recallと異なり、FPRという多ければ精度が悪くなる指標です。そのため表上で(緑でなく)赤棒にしています。
以下のPythonスクリプトでROC曲線を描画しています。
import matplotlib.pyplot as plt
import numpy as np
import pandas as pd
from sklearn.metrics import RocCurveDisplay

def sample_roc():
    df = pd.DataFrame({'label': [1, 1, 1, 0, 1, 0, 0, 0],
                       'prob': np.linspace(1, 0, 8)})
    display(df)
    _, ax = plt.subplots()
    RocCurveDisplay.from_predictions(df['label'], df['prob'], ax=ax)
    ax.grid()
    ax.set_ylim(0, 1.1)
    plt.show()

sample_roc()
曲線比較
PR曲線とROC曲線を比較します。下図の例ではPR曲線を反時計回りに90度回転すればROC似た曲線です。これは、PR曲線の縦軸(Y軸)とROC曲線の横軸(X軸)が同じ指標であることと、Precisionと1-FPRの値が似た値になっているためです(後者は偶然)。1-FPR=$\frac{TN}{TN+FP}$となり、この値は均衡データにおいては$\frac{TP}{TP+FP}$と似た値になりやすいからです。
具体例
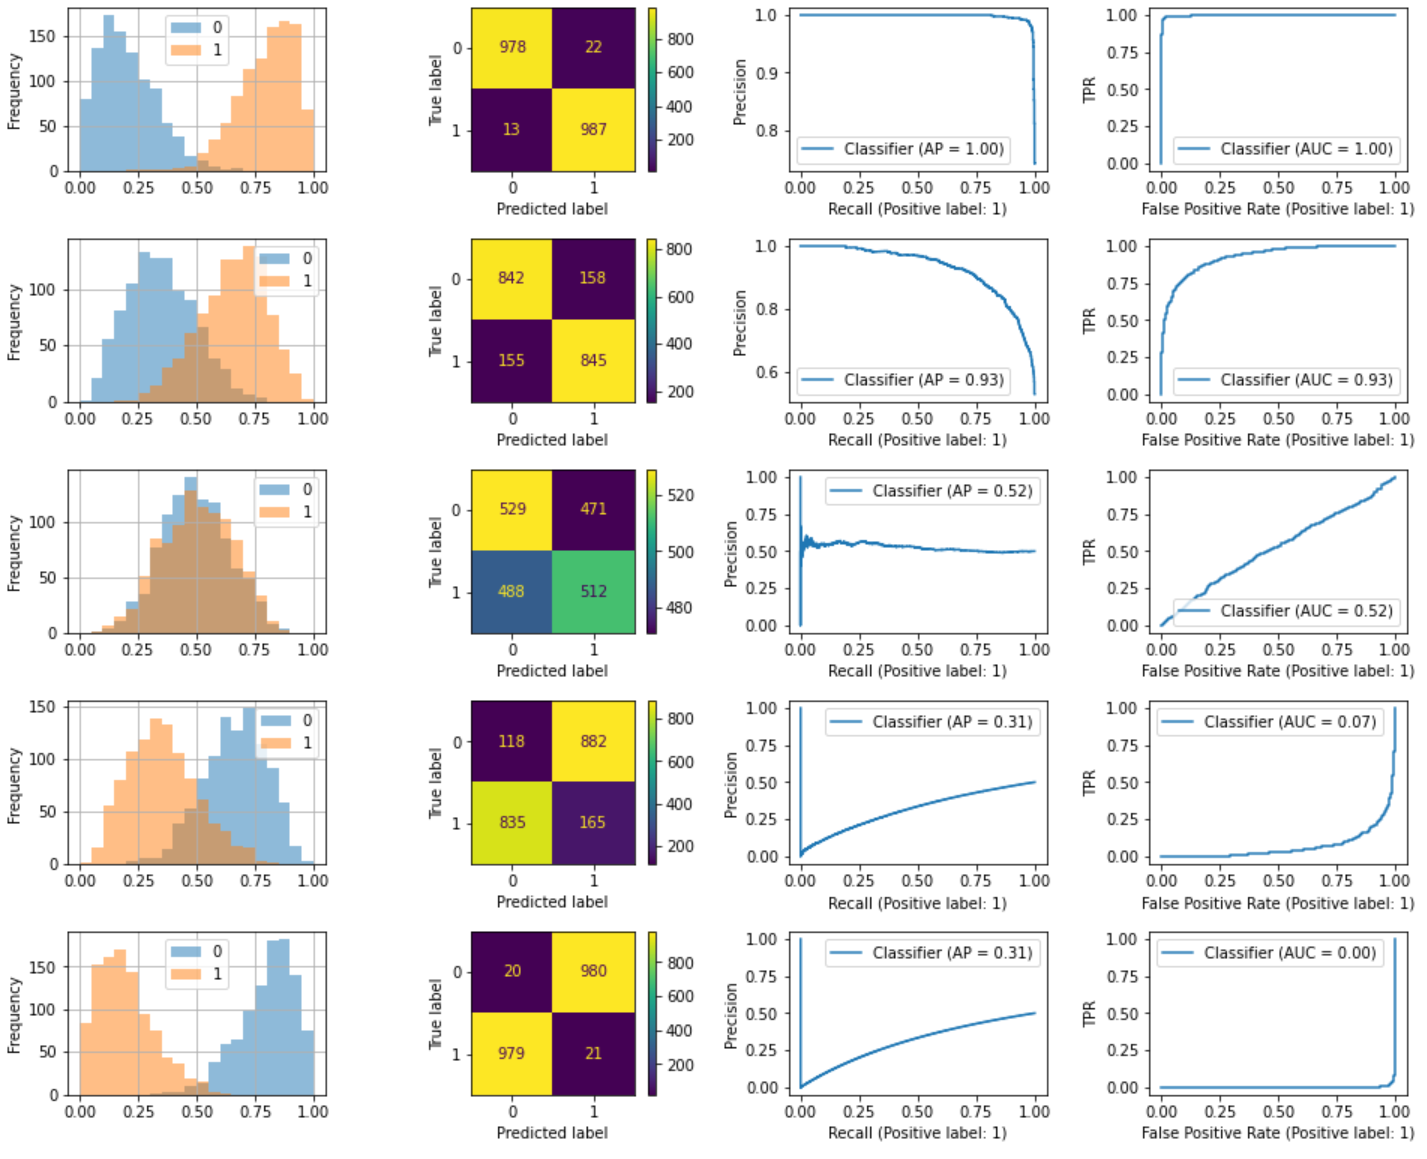
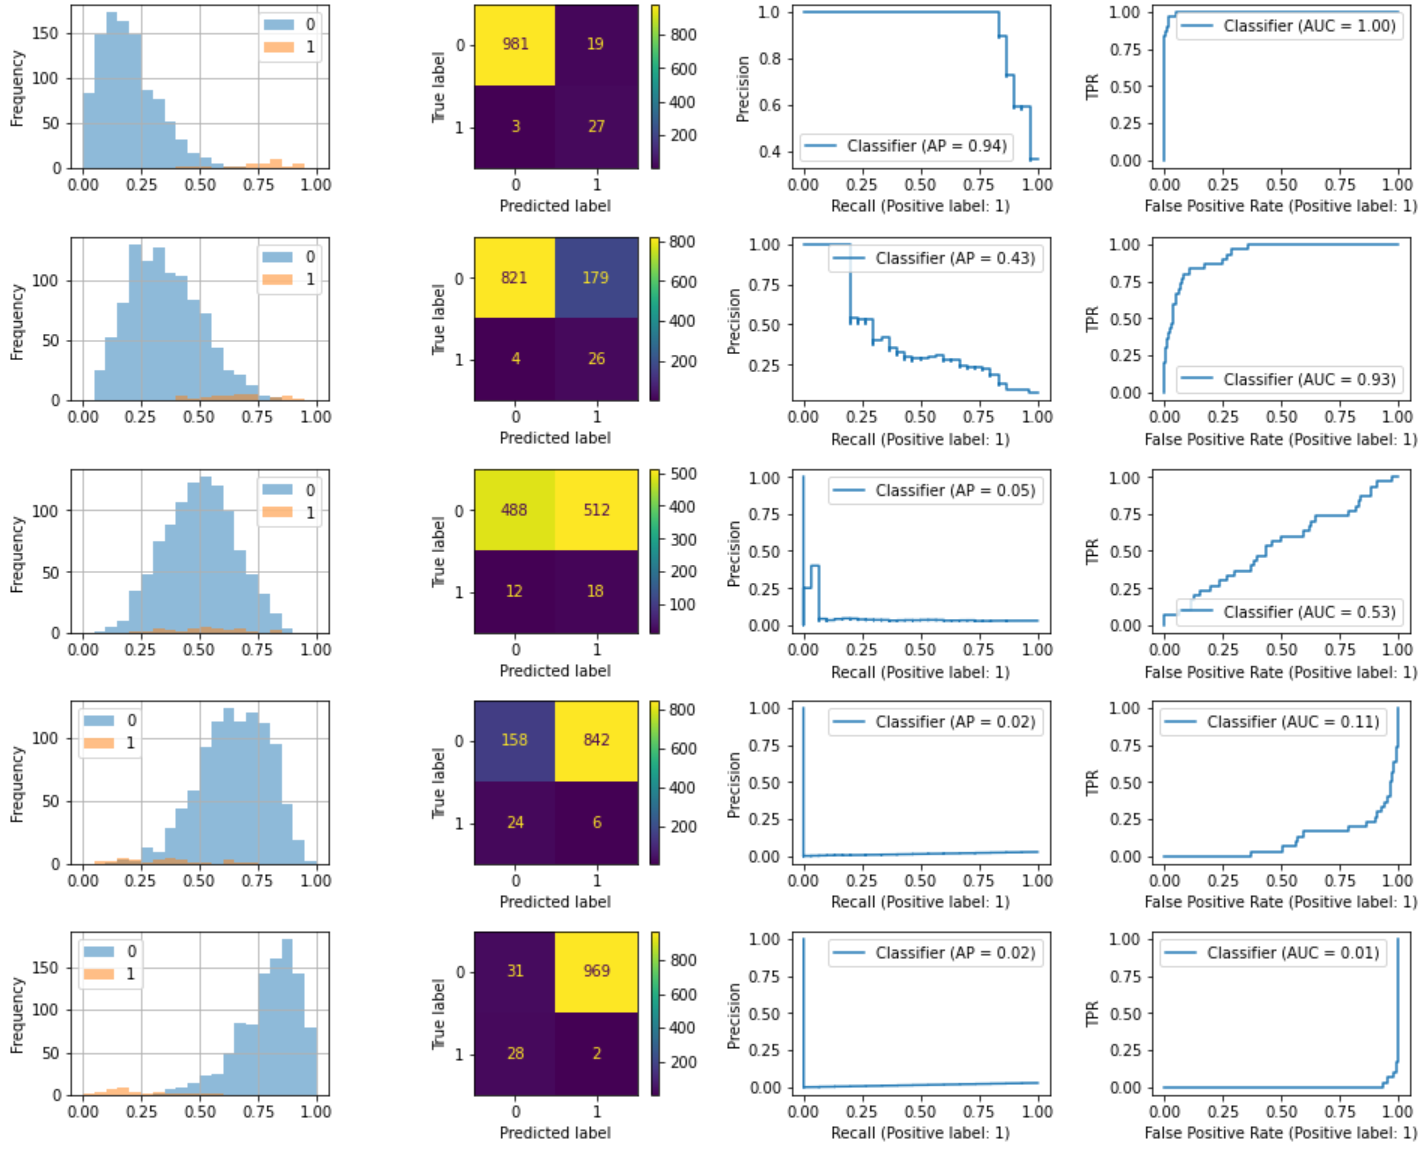
ここからは具体例を使って両曲線など以下の情報を出力してみます。ベータ分布でデータ生成しています。
- 列(左から)
- 正負例確率分布ヒストグラム
- 混合行列
- PR曲線
- ROC曲線
- 行(上から)
- 分類精度: 高
- 分類精度: 中
- ランダム(50%の分類精度)
- 分類精度: 低
- 分類精度: 最低
均衡データ
不均衡データ
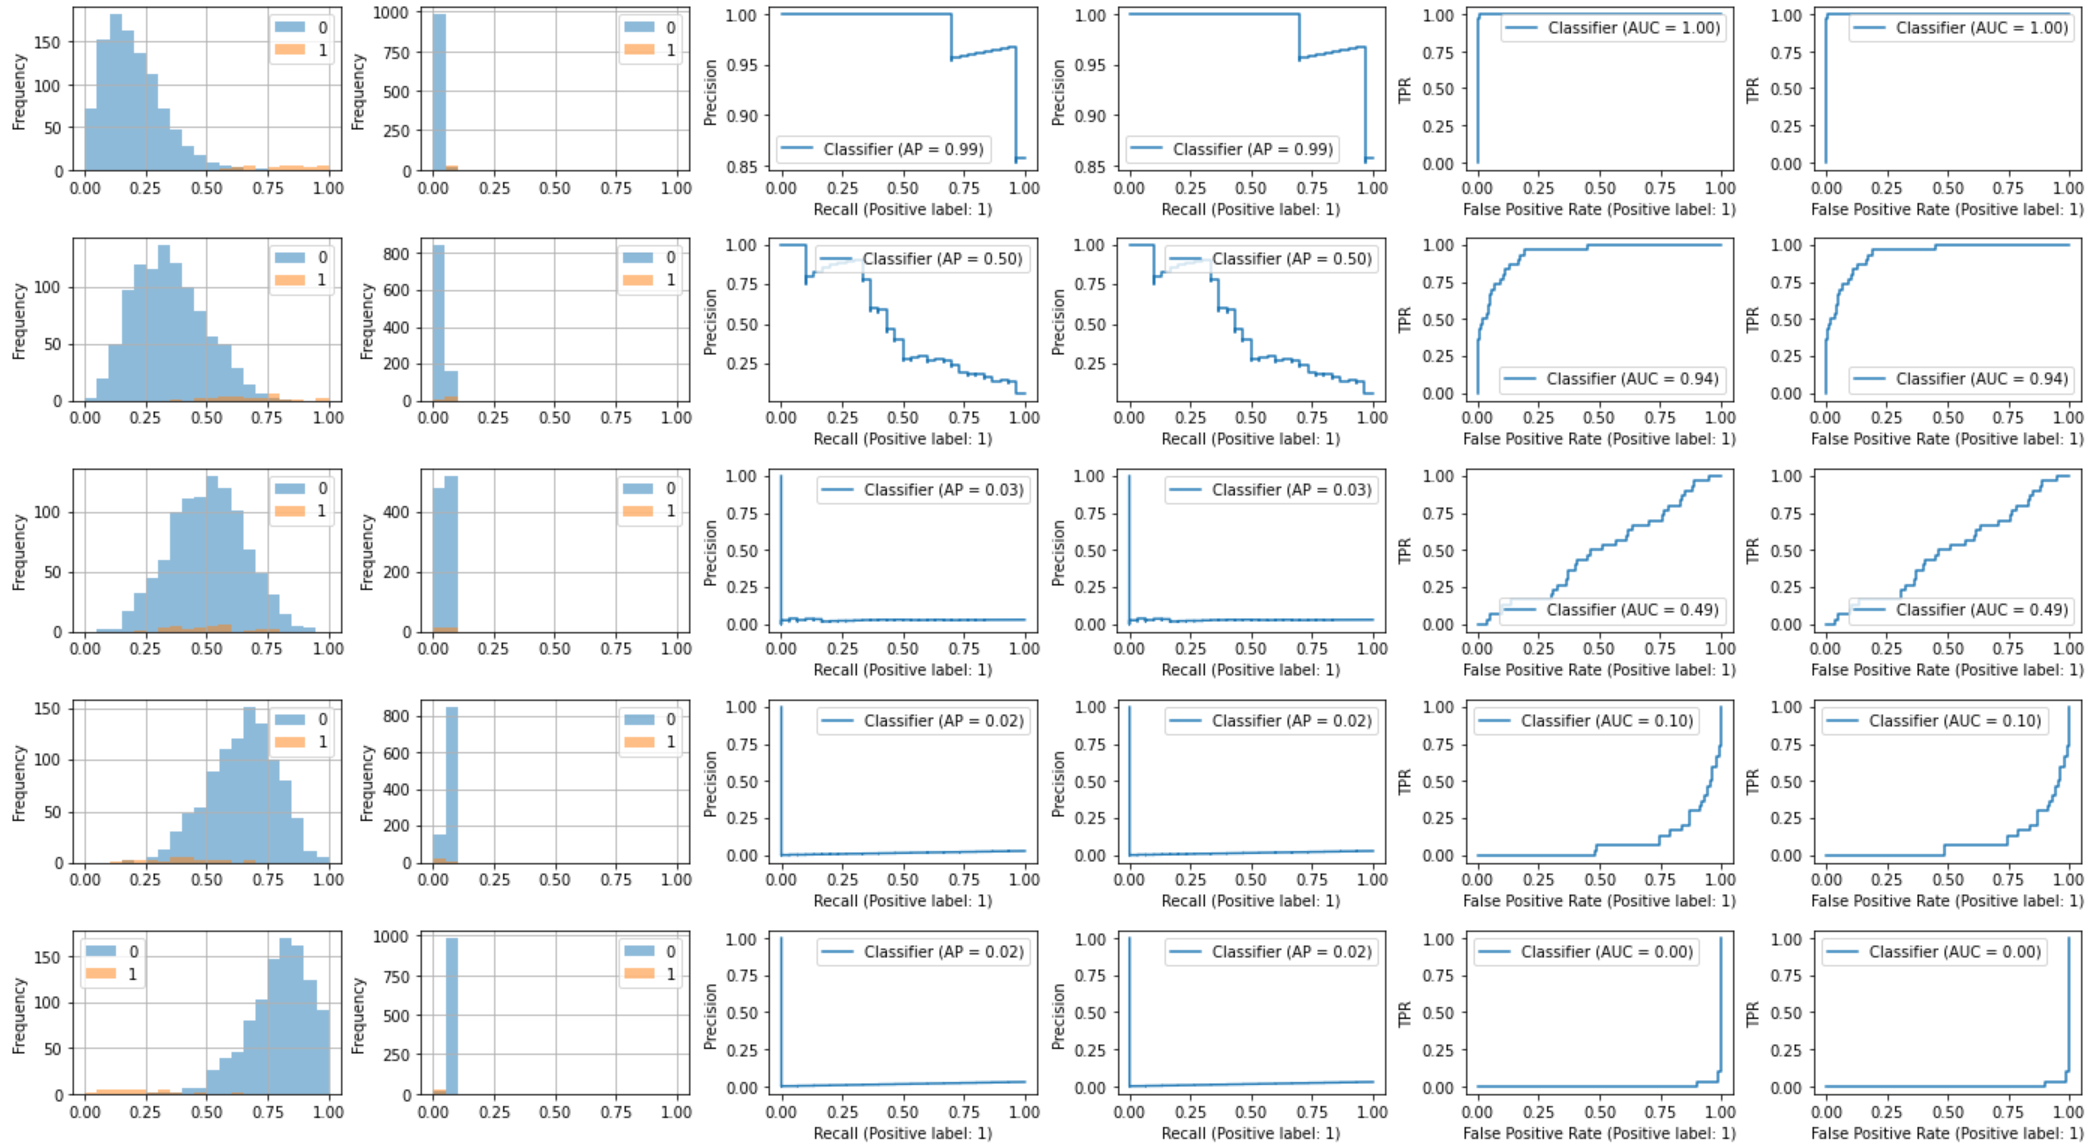
正負の比率を100:3でデータ生成しました。ベータ分布のパラメータは均衡データと同一で、下に行くほど精度を悪くしています。2行目の早い段階でPR曲線の方が歪になり、AUC(AP)が一気に悪化したのがわかります。一方でROCの悪化は3行目くらいからです。PR-AUCは不均衡データに対して敏感だと言われるのがよくわかります。ROCではFPR算出時に$\frac{FP}{TN+FP}$の分母のTNが多く、一方でFPが少なくなりやすいので、大きく下がらないことが多いです(不均衡データで単純にLossを低くするためにはTNを多くすればいいため)。
不均衡データ(Calibrationあり)
参考に不均衡データ結果を定数除算でCalibrationしました。不均衡データとCalibrationについては以前、記事「不均衡データへのダウンサンプリング後のCalibration」に書きました(今回は簡易的に割り算しているだけ)。予測データの確率相対値を見ているので両曲線ともCalibration前後で変わらないことが確認できます。
左の列から以下のグラフです。
- Calibrationなし: 正負例確率分布ヒストグラム
- Calibrationあり: 正負例確率分布ヒストグラム
- Calibrationなし: PR曲線
- Calibrationあり: PR曲線
- Calibrationなし: ROC曲線
- Calibrationあり: ROC曲線
グラフ出力したスクリプト
import matplotlib.pyplot as plt
import numpy as np
import pandas as pd
from sklearn.metrics import RocCurveDisplay, PrecisionRecallDisplay, ConfusionMatrixDisplay
np.random.seed(42)

def output_roc_pr(neg_a, neg, pos):
    df_neg = pd.DataFrame(np.random.beta(neg_a, 10-neg_a, neg), columns=['prob'])
    df_neg['label'] = 0
    df_pos = pd.DataFrame(np.random.beta(10-neg_a, neg_a, pos), columns=['prob'])
    df_pos['label'] = 1
    df = pd.concat([df_neg, df_pos], axis=0)

    fig, axes = plt.subplots(nrows=1, ncols=4, figsize=(16, 2))
    fig.subplots_adjust(wspace=0.4, hspace=0)
    df.groupby('label')['prob'].plot.hist(bins=20, range=(0, 1), alpha=0.5, grid=True, legend=True, ax=axes[0])
    ConfusionMatrixDisplay.from_predictions(df['label'], df['prob'].round(), ax=axes[1])

    PrecisionRecallDisplay.from_predictions(df['label'], df['prob'], ax=axes[2])
    axes[2].set_ylabel('Precision')
    axes[2].legend(loc='best')
    RocCurveDisplay.from_predictions(df['label'], df['prob'], ax=axes[3])
    axes[3].set_ylabel('TPR')
    axes[3].legend(loc='best')
    plt.show()


# 均衡データ
for i in [2, 3.5, 5, 6.5, 8]:
    output_roc_pr(i, 1000, 1000)

# 不均衡データ
for i in [2, 3.5, 5, 6.5, 8]:
    output_roc_pr(i, 1000, 30)


def compare_calibration(neg_a, neg, pos, calibration=1):
    df_neg = pd.DataFrame(np.random.beta(neg_a, 10-neg_a, neg), columns=['prob'])
    df_neg['label'] = 0
    df_pos = pd.DataFrame(np.random.beta(10-neg_a, neg_a, pos), columns=['prob'])
    df_pos['label'] = 1
    df = pd.concat([df_neg, df_pos], axis=0)
    df['prob_calb'] = df['prob'] / calibration

    fig, axes = plt.subplots(nrows=1, ncols=6, figsize=(24, 2))
    fig.subplots_adjust(wspace=0.3, hspace=0)
    df.groupby('label')['prob'].plot.hist(bins=20, range=(0, 1), alpha=0.5, grid=True, legend=True, ax=axes[0])
    df.groupby('label')['prob_calb'].plot.hist(bins=20, range=(0, 1), alpha=0.5, grid=True, legend=True, ax=axes[1])

    PrecisionRecallDisplay.from_predictions(df['label'], df['prob'], ax=axes[2])
    axes[2].set_ylabel('Precision')
    axes[2].legend(loc='best')
    PrecisionRecallDisplay.from_predictions(df['label'], df['prob_calb'], ax=axes[3])
    axes[3].set_ylabel('Precision')
    axes[3].legend(loc='best')

    RocCurveDisplay.from_predictions(df['label'], df['prob'], ax=axes[4])
    axes[4].set_ylabel('TPR')
    axes[4].legend(loc='best')
    RocCurveDisplay.from_predictions(df['label'], df['prob_calb'], ax=axes[5])
    axes[5].set_ylabel('TPR')
    axes[5].legend(loc='best')
    plt.show()


# 不均衡データ下でのCalibration比較
for i in [2, 3.5, 5, 6.5, 8]:
    compare_calibration(i, 1000, 30, 10)
参考
以下のサイトを参考にしました。
少ししか見ていないけど、いいこと書いてありそう。
