Kerasで複数の情報を入力して、途中で結合する方法を紹介します。
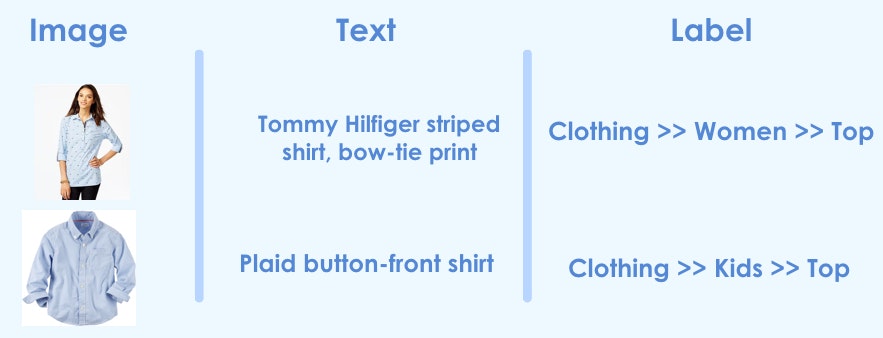
この方法は、例えば以下のように画像とテキストを使って予測モデルを作る場合などに有効です。リンク先参考。
ImageDataGeneratorを使いつつ統合する方法は、記事「KerasのImageDataGeneratorを使いつつ複数Input統合モデル」を参照ください。
処理概要
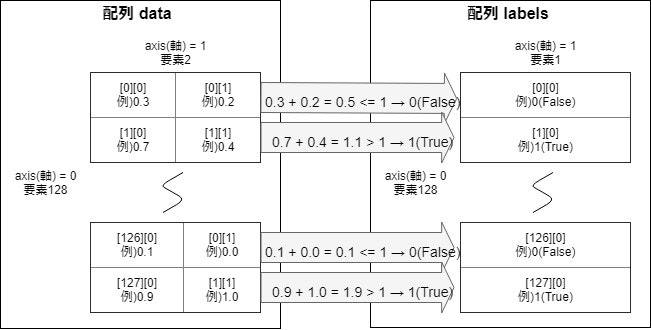
以前、記事「【Keras入門(1)】単純なディープラーニングモデル定義」で紹介した以下の図の配列dataを2つに分解して統合するモデルにしてみます。
処理プログラム
プログラム全体はGitHubを参照ください。
※なぜか直接GitHubで見られずに、nbviewerなら参照できました。nbviewerにhttps://github.com/YoheiFukuhara/keras-for-beginner/blob/master/Keras09_merge.ipynbを入力します。
1. ライブラリインポート
今回はnumpyとtensorflowに統合されているkerasを使います。ピュアなkerasでも問題なく、インポート元を変えるだけです。
from random import random

import matplotlib.pyplot as plt
from tensorflow.keras.layers import Input, concatenate, Dense
from tensorflow.keras.models import Model
from tensorflow.python.keras.utils.vis_utils import plot_model
import numpy as np
2. 前処理
2.1. データ作成
入力1と入力2の和が1未満の場合は、正解ラベルを0に設定
入力1と入力2の和が1以上の場合は、正解ラベルを1に設定
NUM_TRAIN = 256

x_train1 = np.empty((0, 1)) # 入力(説明変数)1
x_train2 = np.empty((0, 1)) # 入力(説明変数)2
y_train = np.empty((0, 1)) # 正解ラベル(目的変数)

for i in range(NUM_TRAIN):
    x1 = np.array(random()) # 0から1までの乱数
    x2 = np.array(random()) # 0から1までの乱数
    if x1 + x2 < 1:
        y_train = np.append(y_train, np.zeros(1).reshape(1, 1), axis=0)
    else:
        y_train = np.append(y_train, np.ones(1).reshape(1, 1), axis=0)
    x_train1 = np.append(x_train1, x1.reshape(1, 1), axis=0)
    x_train2 = np.append(x_train2, x2.reshape(1, 1), axis=0)
3. モデル定義
concatenateを使って2つの流れを統合します。concatenate以外も統合系の関数がありますが、多くの場合はconcatenateではないでしょうか。
# 入力を定義
input1 = Input(shape=(1,))
input2 = Input(shape=(1,))

# 入力1から結合前まで
x = Dense(1, activation="linear")(input1)
x = Model(inputs=input1, outputs=x)

# 入力2から結合前まで
y = Dense(1, activation="linear")(input2)
y = Model(inputs=input2, outputs=y)

# 結合
combined = concatenate([x.output, y.output])

# 密結合
z = Dense(32, activation="tanh")(combined)
z = Dense(1, activation="sigmoid")(z)

# モデル定義とコンパイル
model = Model(inputs=[x.input, y.input], outputs=z)
model.compile(loss='binary_crossentropy', optimizer='adam', metrics=['acc'])
model.summary()
出力されるサマリは以下の通り。
Layer (type)                    Output Shape         Param #     Connected to
==================================================================================================
input_1 (InputLayer)            [(None, 1)]          0
__________________________________________________________________________________________________
input_2 (InputLayer)            [(None, 1)]          0
__________________________________________________________________________________________________
dense (Dense)                   (None, 1)            2           input_1[0][0]
__________________________________________________________________________________________________
dense_1 (Dense)                 (None, 1)            2           input_2[0][0]
__________________________________________________________________________________________________
concatenate (Concatenate)       (None, 2)            0           dense[0][0]
                                                                 dense_1[0][0]
__________________________________________________________________________________________________
dense_2 (Dense)                 (None, 32)           96          concatenate[0][0]
__________________________________________________________________________________________________
dense_3 (Dense)                 (None, 1)            33          dense_2[0][0]
==================================================================================================
Total params: 133
Trainable params: 133
Non-trainable params: 0
__________________________________________________________________________________________________
plot_modelを使って見やすくするとこんな感じです。
plot_model(model, show_shapes=True, show_layer_names=False)

4. 訓練実行
fit関数を使って訓練します。200epoch程度で精度が出ます。
history = model.fit([x_train1, x_train2], y_train, epochs=200)
参考
記事「Kerasで複数の入力を統合/マージする方法」を参考にしました。