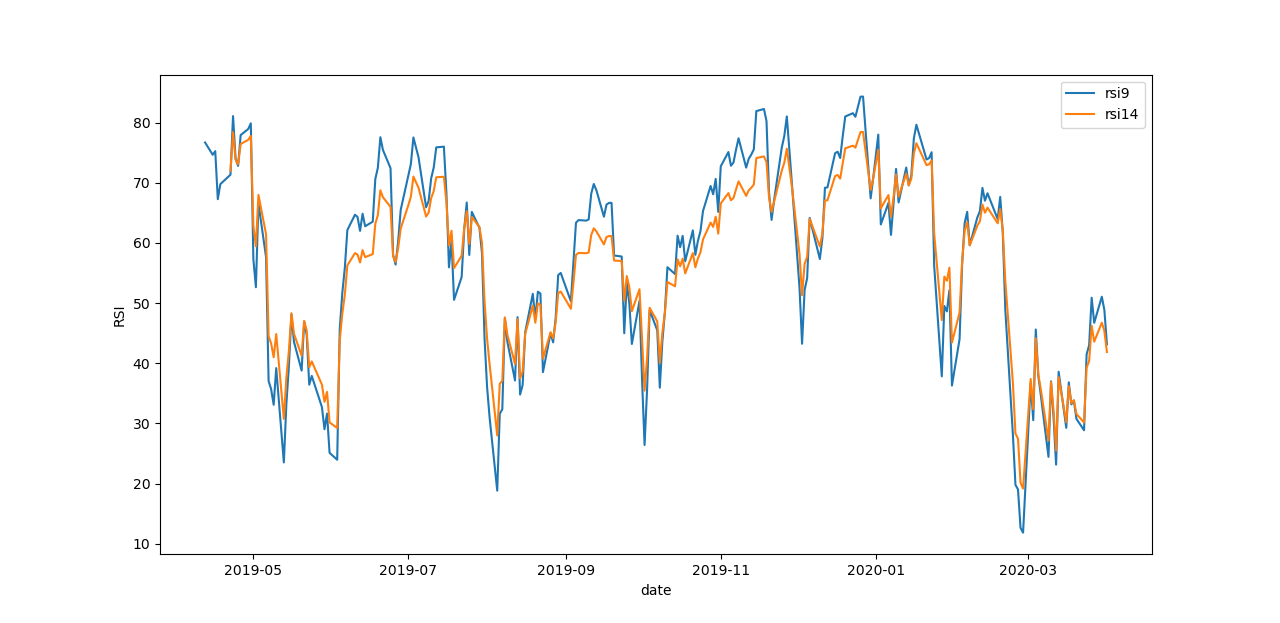
今回は,テクニカル指標である RSI(Relative Strength Index) をPythonライブラリTA-Libで計算し,描画する方法を紹介します.
・【Python】TA-Libでテクニカル指標計算 Part 1. RSIの描画
・【Python】TA-Libでテクニカル指標計算 Part 2. ボリンジャーバンドの描画
・[【Python】TA-Libでテクニカル指標計算 Part 3. SMA(単純移動平均線)の描画]
(https://qiita.com/Fujinoinvestor/items/49dc284279c7e9217c30)
・【Python】TA-Libでテクニカル指標計算 Part 4. MACDの描画
TA-Libのインストール
前回の記事
をご覧ください.
TA-LibによるRSI描画
各ライブラリインポート
import datetime
import numpy as np
import matplotlib.pyplot as plt
import pandas_datareader.data as web
import talib as ta
株価データ取得
今回は,2019/4/1~2020/4/1におけるS&P500の9日RSIと14日RSIをTA-Libで取得してみたいと思います.
株価は,pandas_datareaderで取得します.もちろんウェブやローカルにあるCSVファイルを読み込むなどでも構いません.
start = datetime.date(2019,4,1)
end = datetime.date(2020,4,1)
df = web.DataReader('^GSPC', 'yahoo', start, end) #get data
pandas-datareaderで取得したデータは以下のように,High(高値),Low(低値),Open(始値),Close(終値),Volume(出来高),Adj Close(調整後終値)を持つDataFarameとなっています.
                   High          Low         Open        Close      Volume    Adj Close
Date
2019-04-01  2869.399902  2848.629883  2848.629883  2867.189941  3500760000  2867.189941
2019-04-02  2872.899902  2858.750000  2868.239990  2867.239990  3246900000  2867.239990
2019-04-03  2885.250000  2865.169922  2876.090088  2873.399902  3550240000  2873.399902
2019-04-04  2881.280029  2867.139893  2873.989990  2879.389893  3015180000  2879.389893
2019-04-05  2893.239990  2882.989990  2884.159912  2892.739990  3146820000  2892.739990
...                 ...          ...          ...          ...         ...          ...
2020-03-26  2637.010010  2500.719971  2501.290039  2630.070068  7753160000  2630.070068
2020-03-27  2615.909912  2520.020020  2555.870117  2541.469971  6194330000  2541.469971
2020-03-30  2631.800049  2545.280029  2558.979980  2626.649902  5746220000  2626.649902
2020-03-31  2641.389893  2571.149902  2614.689941  2584.590088  6568290000  2584.590088
2020-04-01  2522.750000  2447.489990  2498.080078  2470.500000  5947900000  2470.500000
RSIに必要なデータ
pandas-datareaderで取得したデータのうち,RSIを計算するために必要なデータは,終値(Close)だけです.dfの’Close’の列だけをcloseとして取り出します(他のカラムでも計算自体はできます).
close = df['Close']
TA-LibでRSIを計算
# RSI(Relative Strength Index)
rsi9 = ta.RSI(close, timeperiod=9)
rsi14 = ta.RSI(close, timeperiod=14)
描画
plt.plot(rsi9,label='rsi9')
plt.plot(rsi14,label='rsi14')
plt.xlabel('date')
plt.ylabel('RSI')
plt.legend()
plt.show()
まとめコード
import datetime
import numpy as np
import matplotlib.pyplot as plt
import pandas_datareader.data as web
import talib as ta

start = datetime.date(2019,4,1)
end = datetime.date(2020,4,1)

df = web.DataReader('^GSPC', 'yahoo', start, end) #get data

close = df['Close']

# RSI(Relative Strength Index)
rsi9 = ta.RSI(close, timeperiod=9)
rsi14 = ta.RSI(close, timeperiod=14)

plt.plot(rsi9,label='rsi9')
plt.plot(rsi14,label='rsi14')
plt.xlabel('date')
plt.ylabel('RSI')
plt.legend()
plt.show()
もう少しだけ丁寧な解説を以下の記事で行っています.
