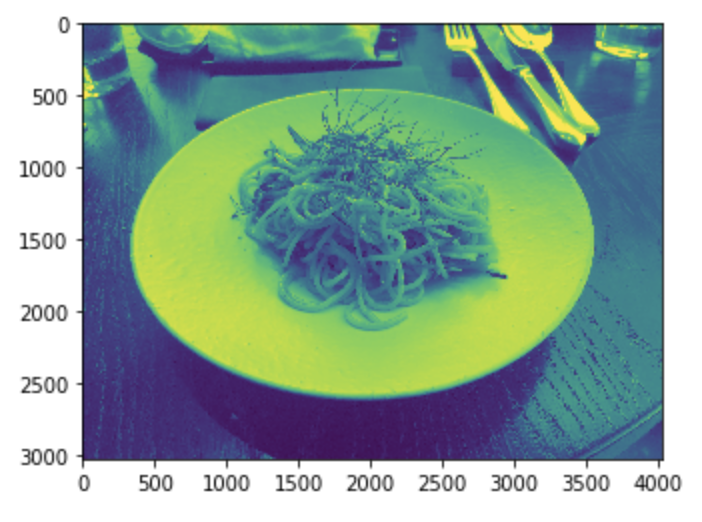
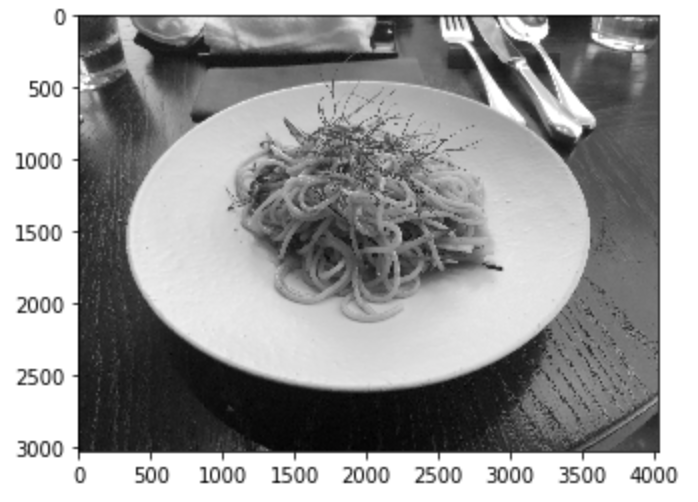
グレースケール画像をmatplotlibを用いて表示する.
グレースケール画像をmatplotlibを用いて表示することにやや苦戦した. その方法を示したい. oepnCVの公式サイト(http://opencv.jp/opencv-2.1/cpp/reading_and_writing_images_and_video.html)
を見ると, imreadの2番目の引数にint型の整数を指定することで, 画像のカラータイプを指定できることがわかる. そして, その中で, 0を指定してグレースケール画像を表示させたい場合を考える. そこで, 私は以下のようなコードを記述した.
import cv2
from matplotlib import pyplot as plt

test_image = cv2.imread("pasta.jpg", 0) #グレースケール画像として読み込む.
plt.imshow(test_image)
plt.show()
この出力結果は以下である. 明らかにグレースケール画像ではない.

解決策
この原因は筆者も不明(おそらく正規化が関係するはず)であるが, グレースケール画像を表示するという目的を達成するための解決策として, 以下の2つがある.
import cv2
from matplotlib import pyplot as plt

test_image = cv2.imread("pasta.jpg", 0) #グレースケール画像として読み込む.
plt.imshow(test_image, cmap = "gray")
plt.show()
import cv2
from matplotlib import pyplot as plt

test_image = cv2.imread("pasta.jpg", 0) #グレースケール画像として読み込む.
plt.imshow(test_image)
plt.gray()
plt.show()
その他
2019年 8月25日 時点
解決策2のコードを以下のように訂正させていただきました.
[訂正前]camp
[訂正後]cmap
参考文献
[1]http://programming.blogo.jp/python/matplotlib/grayscale_image_opencv
[2]http://takacity.blog.fc2.com/blog-entry-142.html
[3]https://stackoverflow.com/questions/3823752/display-image-as-grayscale-using-matplotlib
