はじめに
初心者向けにpythonでのデータ解析について解説しています。
本記事が2つ目になります。
前回の記事 : pythonではじめるデータ分析 (データの可視化1)
https://qiita.com/CEML/items/d673713e25242e6b4cdb
ソースコード
https://gitlab.com/ceml/qiita/-/blob/master/src/python/notebook/first_time_data_analysis.ipynb
前回のおさらい
このシリーズでは
無料で公開されているデータセットを使用して、データの読み込みから簡単なデータ解析までを解説します。
データセットについて
・提供元:カルフォルニア工科大学
・内容:心臓病患者の検査データ
・URL :https://archive.ics.uci.edu/ml/datasets/Heart+Disease
・上記URLにあるprocessed.cleveland.dataのみを使用します。
解析目的
データセットは患者の病態を5つのクラスに分類しています。
各クラスの特徴を掴む事を目的に解析を進めてみようと思います。
※ データのダウンロード、読み込み等は過去記事を参照ください。
本記事の内容
前回見辛かったヒストグラムを改善します。
改善策
前回の問題のプロットは以下の図でした。
import pandas as pd

columns_name = ["age", "sex", "cp", "trestbps", "chol", "fbs", "restecg", "thalach", "exang", "oldpeak","slope","ca","thal","class"]
data = pd.read_csv("/Users/processed.cleveland.data", names=columns_name)

class_group = data.groupby("class")
class_group["age"].hist(alpha=0.7)
plt.legend([0,1,2,3,4])

見づらい理由は以下2点が考えられます。
①.図が重なっている。
②.binの範囲が各クラスで異なる。
今回はこれらの問題をplotlyを使って改善していきます。
matplotlibでも当然解決出来ますが、plotlyも便利なので使えて損はないです。
plotlyの良さはインタラクティブな図が作成できる事です。
※ 今回図を上手く埋め込まなかったので、画像をクリックしてリンク先でインタラクティブな操作を是非体感下さい。
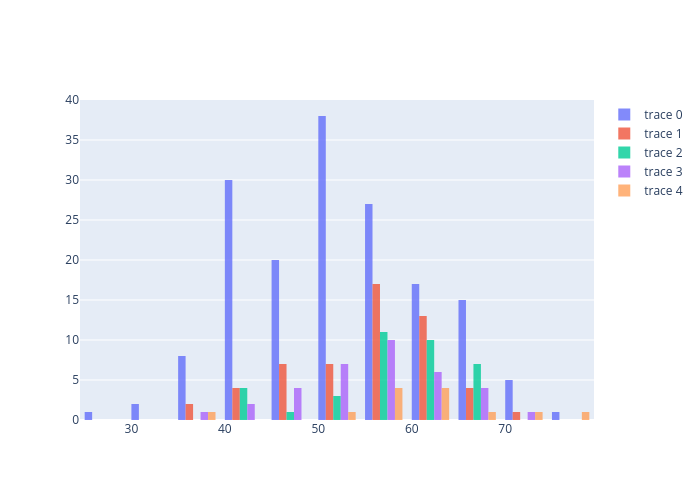
①の改善策
import plotly.graph_objects as go

fig = go.Figure()
for i in range(len(class_group)):
    fig.add_trace(go.Histogram(x=class_group["age"].get_group(i), nbinsx=10))

# fig.update_layout(barmode='overlay')
fig.update_traces(opacity=0.8)
fig.show()
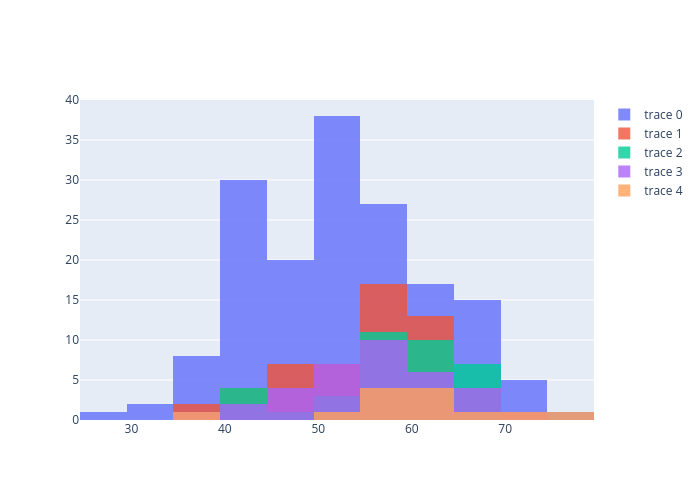
②の改善策
先ほどのコメントアウト部をonにしただけで図がかけてします。
import plotly.graph_objects as go
fig = go.Figure()
for i in range(len(class_group)):
   fig.add_trace(go.Histogram(x=class_group["age"].get_group(i), nbinsx=10))

fig.update_layout(barmode='overlay')
fig.update_traces(opacity=0.8)
fig.show()
終わりに
インタラクティブな操作は体感いただけましたか?
データポインタの値を表示できるだけでなく、図の拡大・縮小など自在に操作出来て便利ですよね。
次回もplotlyの3dプロットなどを使用して解析を進めたいと思います。
pythonではじめるデータ分析 (データの可視化3 )
https://qiita.com/CEML/items/71fbc7b8ab6a7576f514

