はじめに
初心者向けにpythonでのデータ解析について解説しています。
本記事が3つ目になります。
------------------過去の記事----------------------
pythonではじめるデータ分析 (データの可視化1)
https://qiita.com/CEML/items/d673713e25242e6b4cdb
pythonではじめるデータ分析 (データの可視化2)
https://qiita.com/CEML/items/e932684502764be09157
ソースコード
https://gitlab.com/ceml/qiita/-/blob/master/src/python/notebook/first_time_data_analysis.ipynb
おさらい
このシリーズでは
無料で公開されているデータセットを使用して、データの読み込みから簡単なデータ解析までを解説します。
データセットについて
・提供元:カルフォルニア工科大学
・内容:心臓病患者の検査データ
・URL :https://archive.ics.uci.edu/ml/datasets/Heart+Disease
・上記URLにあるprocessed.cleveland.dataのみを使用します。
解析目的
データセットは患者の病態を5つのクラスに分類しています。
各クラスの特徴を掴む事を目的に解析を進めてみようと思います。
※ データのダウンロード等は過去記事を参照ください。
本記事の内容
1.カテゴリー変数のダイアグラムを作成
2.3D plot
データの読み込み
# データの読み込み
columns_name = ["age", "sex", "cp", "trestbps", "chol", "fbs", "restecg", "thalach", "exang", "oldpeak","slope","ca","thal","class"]
data = pd.read_csv("/Users/processed.cleveland.data", names=columns_name)
# 病態のclassでグループ化
class_group = data.groupby("class")
1.カテゴリー変数のダイアグラム
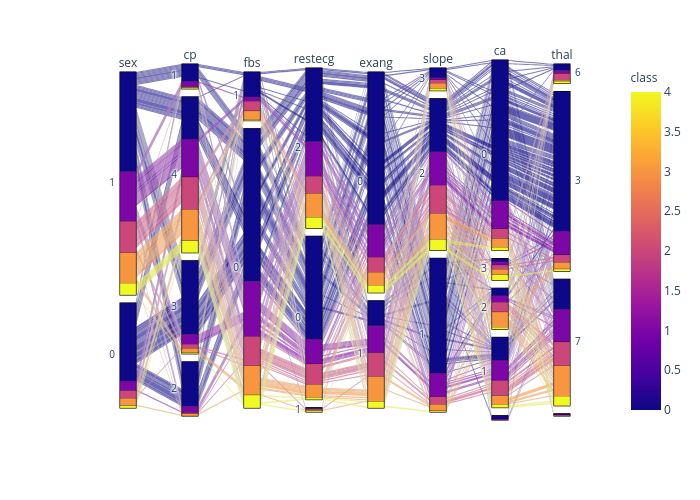
今回のデータセットでカテゴリー変数は'sex', 'cp', 'fbs', 'restecg', 'exang', 'slope', 'ca', 'thal'の8変数になります。
import plotly.express as px
categorical_feature = ['sex', 'cp', 'fbs', 'restecg', 'exang', 'slope', 'ca', 'thal']
fig = px.parallel_categories(data,
                             dimensions= categorical_feature,
                             color="class",)
fig.show()
リンク先で操作してもらえばわかりますが、各カテゴリーの組み合わせがいくつあるかなどよくわかります。
色は病態のクラスで色分けされています。
例えば病態の重いクラス4では全ての組み合わせがユニークとなっていることがわかります。
2. 3D plot
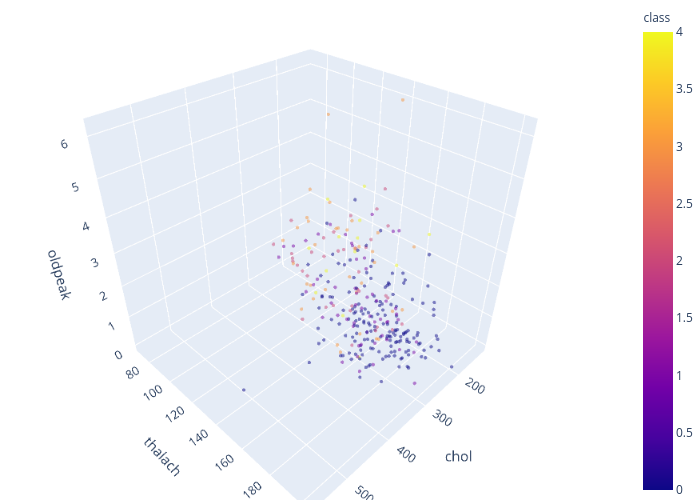
今回のデータセットで連続変数は'age', 'trestbps', 'chol', 'thalach', "oldpeak"の5変数になります。
例として、'chol', 'thalach', "oldpeak"でプロットしてみます。
import plotly.express as px
fig = px.scatter_3d(data, x='chol', y='thalach', z='oldpeak',
              color='class',  opacity=0.5)
fig.update_layout(margin=dict(l=0, r=0, b=0, t=0))
fig.update_traces(marker=dict(size=2))
fig.show()
各クラスあまりきれいに分かれていないことがわかります。
この3変数だけでは上手くクラスを分類することはできないと思われます。
おわりに
今回と前回でplotlyを使用してデータを可視化してきました。
使用したのはほんの一部なので、色々試してみると面白い発見があるかもしれません。

