1
4

Delete article

Deleted articles cannot be recovered.

Draft of this article would be also deleted.

Are you sure you want to delete this article?

More than 3 years have passed since last update.

【自由研究】数理モデルを構築して個別株の予測をしてみた

Last updated at Posted at 2020-02-11

個別株の予測をしてみようと思い、結果を自分用備忘録として以下まとめます。

統計的な手法としては、古き良き重回帰分析でサクッと。
今回使用する説明変数は、前日の終値をベースに、
・移動平均線(5日移動平均線、25移動平均線、50日移動平均線)
・ボリンジャーバンド(±2σ,±1σ)
・一目均衡表(基準線、転換線、先行スパン1、先行スパン2、遅行線)
を使用しました。

対象株は、RIZAPグループ(2928)です。理由は特にありません。。。
学習対象期間は上場した2006年から2018年までで、
テスト対象期間は2019年にしました。

以下、結果です。

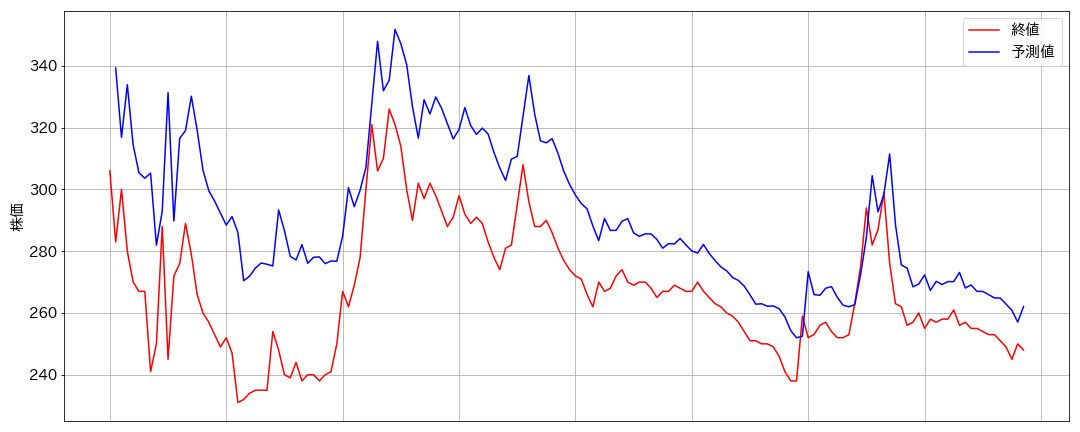
graph1.png

前日の終値を元に、翌日の終値を計算しています。
株価の動きはほぼ完璧に捉えられていると思います。
まぁ重回帰分析の特徴を踏まえると当たり前ですかね。

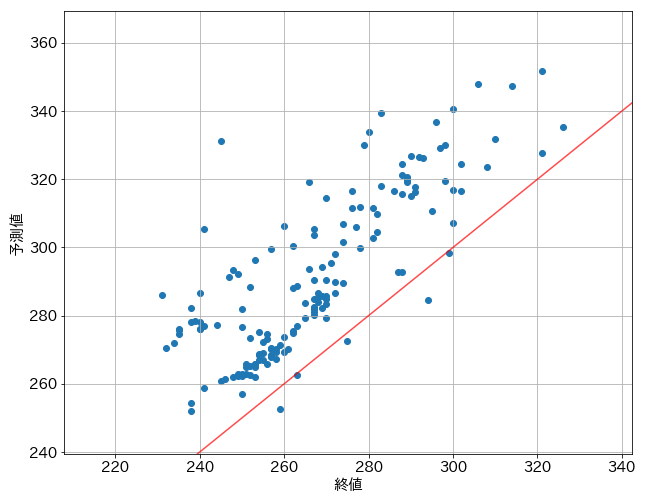
graph2.png

しかし、予測値はほぼ株価を過大評価です。(赤線はy=X)
まだまだ、改善点はありそうです。

終値だけでなく、高値、安値、始値を用いてチャート化しようかな?
ソースコードはこちらから↓ご連絡ください。
https://coconala.com/services/999047
1
4
0

Register as a new user and use Qiita more conveniently

  1. You get articles that match your needs
  2. You can efficiently read back useful information
  3. You can use dark theme
What you can do with signing up
1
4

Delete article

Deleted articles cannot be recovered.

Draft of this article would be also deleted.

Are you sure you want to delete this article?