動作環境
GeForce GTX 1070 (8GB)
ASRock Z170M Pro4S [Intel Z170chipset]
Ubuntu 14.04 LTS desktop amd64
TensorFlow v0.11
cuDNN v5.1 for Linux
CUDA v8.0
Python 2.7.6
IPython 5.1.0 -- An enhanced Interactive Python.
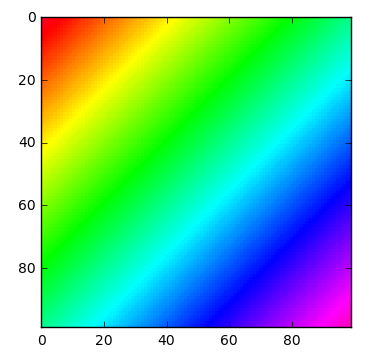
Jupyter + matplotlibで2D配列を画像化したくなった。
参考 http://stackoverflow.com/questions/6323737/make-a-2d-pixel-plot-with-matplotlib
を実行しようとした。
'data.txt'が必要となる。
data.txt(2d.csv)の準備
make_plot_2d.py
import numpy as np

for xidx in range(100):
	for yidx in range(100):
		val = xidx + yidx
		print '%d %d %f' % (xidx, yidx, val)
file_preparation
$python make_plot_2d.py > 2d.csv
Jupyterコード
import numpy as np
import matplotlib.pyplot as plt
import matplotlib.cm as cm

x,y,temp = np.loadtxt('2d.csv').T #Transposed for easier unpacking
nrows, ncols = 100, 100
grid = temp.reshape((nrows, ncols))

plt.imshow(grid, extent=(x.min(), x.max(), y.max(), y.min()),
           interpolation='nearest', cmap=cm.gist_rainbow)
plt.show()