動作確認
RStudio 0.99.903 on Windows 7 pro
R version 3.3.1
参考 Rで学ぶデータ・プログラミング入門 by 石田基広さん
3までのdiceを考えて実装してみた。
> dice<-sample(1:3, 100, rep=T, prob=c(1/6,1/6,1/6))
> table(dice)
dice
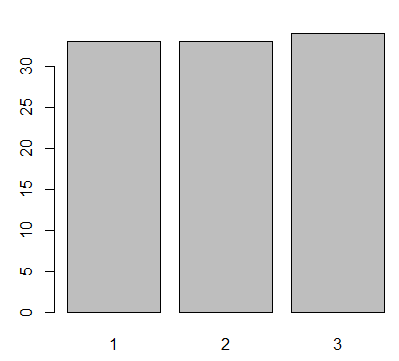
1 2 3
33 33 34
> z<-table(dice)
> barplot(z)
確率は1/6でなく1/3が実は正しい。