時間発展する箱の中の粒子を書きました
時間発展する箱の中の粒子を描いた 0≦x≦π
— カルバニオン (@78910jqk13) July 25, 2018
ψ(x,t) = 0.9φ1(x,t) + 0.1φ2(x,t) pic.twitter.com/vK4TACGhOD
おもに参考にさせていただいた文献は
入門 量子ダイナミクス(上) 時間依存の量子力学を中心に
David J. Tannor (原著), 山下 晃一 (翻訳)
です。
Python3.6.3で書きました。
説明
時間に依存するSchrödinger方程式
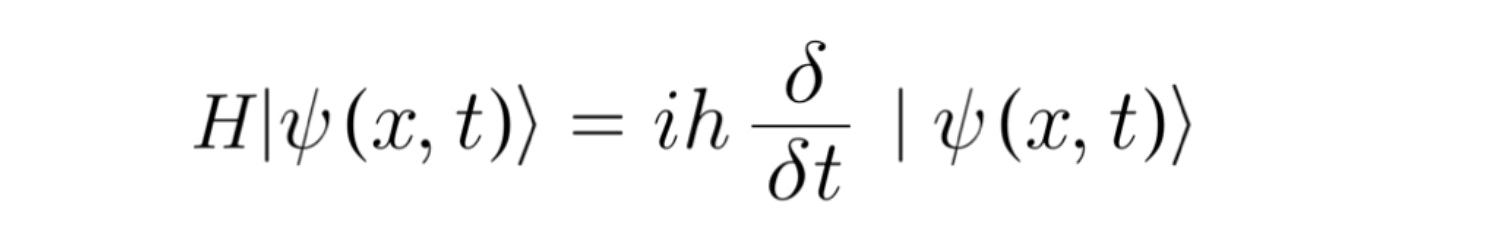
を満たすψはこれらの線形結合
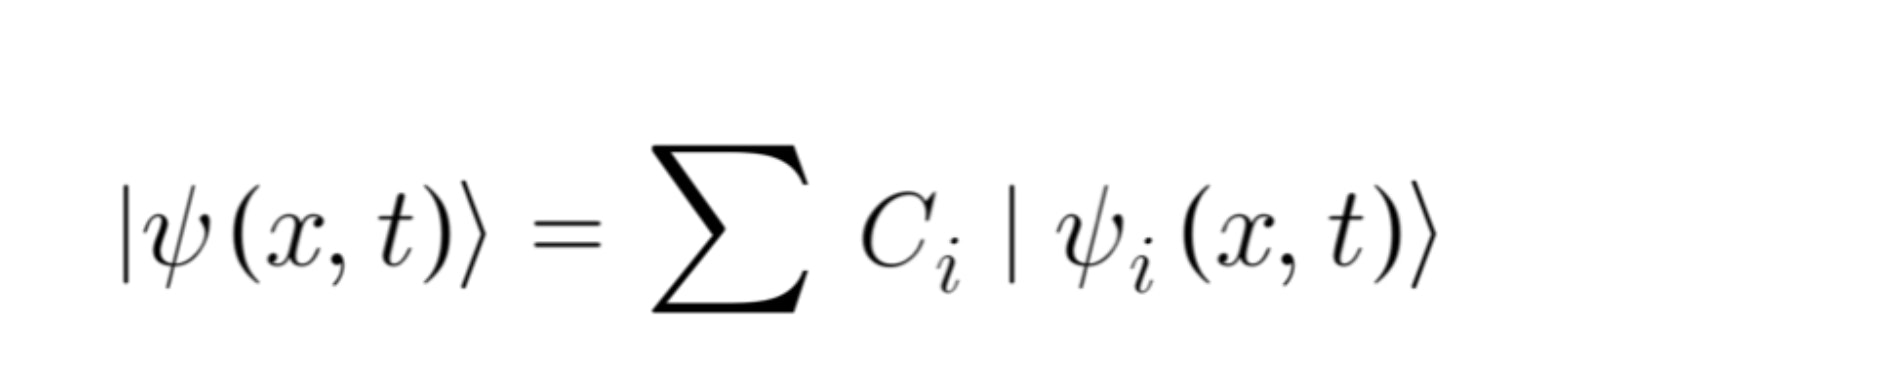
も
を満たします。
というわけで、0≦x≦πの箱の中の粒子のn=1のときの解をφa、n=2のときの解をφbとして、これら2つの線形結合
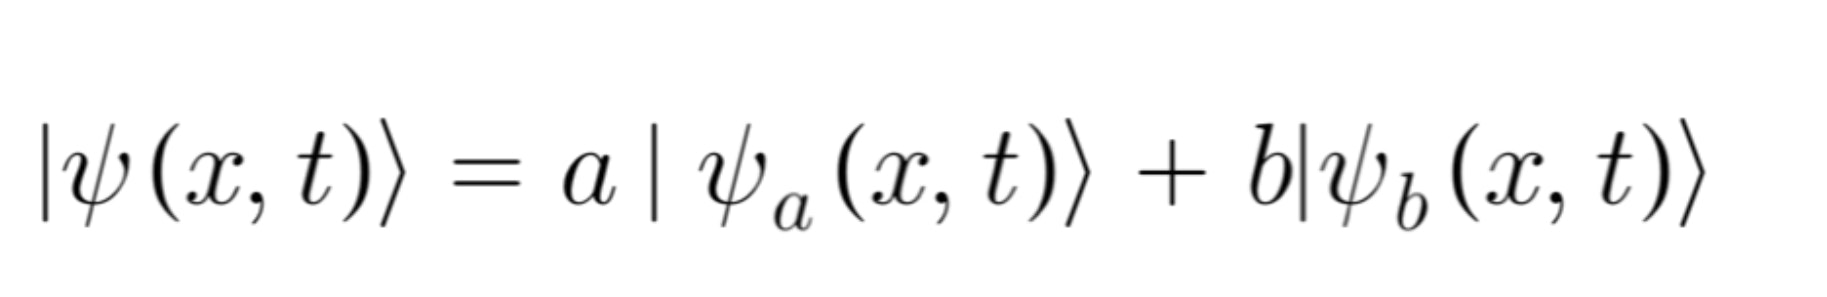
の確率存在密度
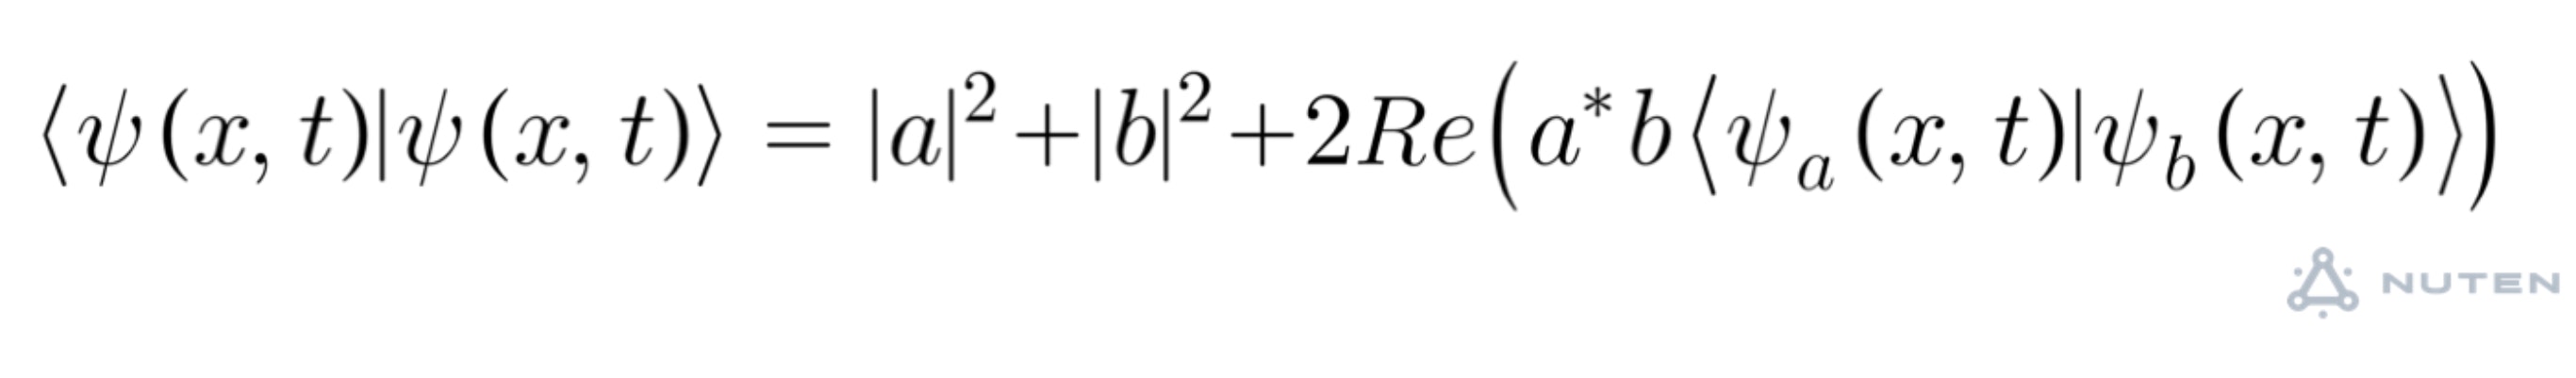
をグラフにしてみました。
今回はa=0.9,b=0.1としました。
コード
mixture.py
import matplotlib
matplotlib.use("Agg")
import numpy as np
import matplotlib.pyplot as plt
import matplotlib.animation as animation

time,x = np.mgrid[-3.141592:3.141592:40j,0:3.1415:100j]
wavefunction1 = 1.414213 * np.sin(x) * np.exp(-1j * time)
wavefunction2 = 1.414213 * np.sin(2 * x) * np.exp(-4j * time)
wave_mixture = 0.9 * wavefunction1 + 0.1 * wavefunction2
probability_density_wave_mixture = np.conj(wave_mixture) * wave_mixture

# plot
fig = plt.figure()

imgs = []

for i in range(40):
	img = plt.plot(x[i],np.real(probability_density_wave_mixture[i]), linewidth =4, color="#2e0fc1")
	imgs.append(img)


ani = animation.ArtistAnimation(fig, imgs, interval=70)
ani.save("output3.gif", writer="imagemagick")
作業環境
Debian 4.9.82
Python3.6.3 Anaconda
またgifの保存にはImagemagickを入れる必要があります。
sudo apt-get install imagemagick
参考にさせていただいた本、サイト
入門 量子ダイナミクス(上) 時間依存の量子力学を中心に
David J. Tannor (原著), 山下 晃一 (翻訳)