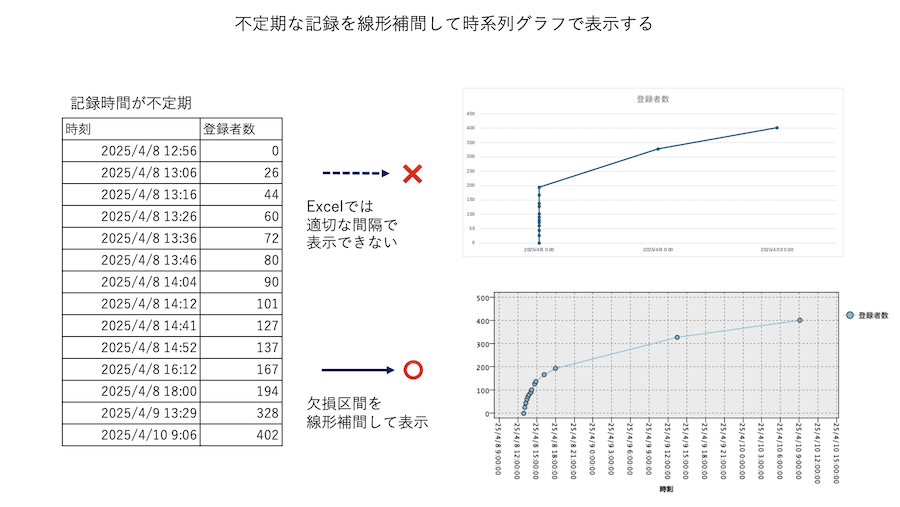
不定期な記録を線形補間して時系列グラフで表示する
1.想定される利用目的
・予約数の可視化
・Serverログなどの不定期な記録の可視化
2.サンプルストリームのダウンロード
ストリーム
3.サンプルストリームの説明

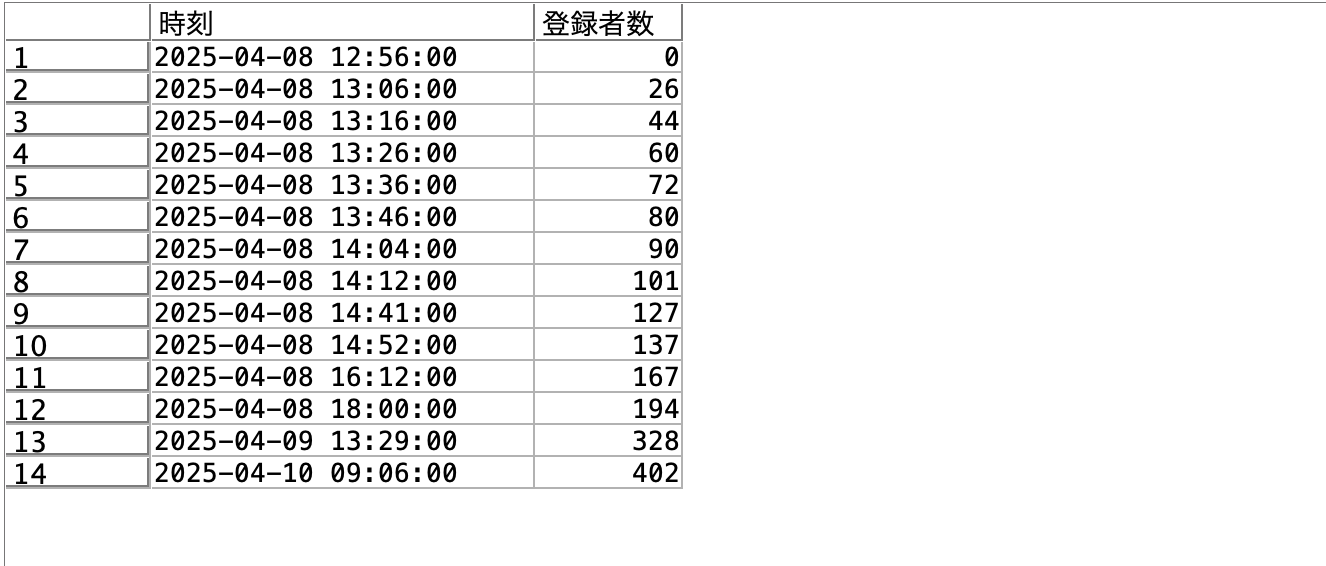
a.入力データは以下の通りです。時間間隔がまちまちに記録されています。
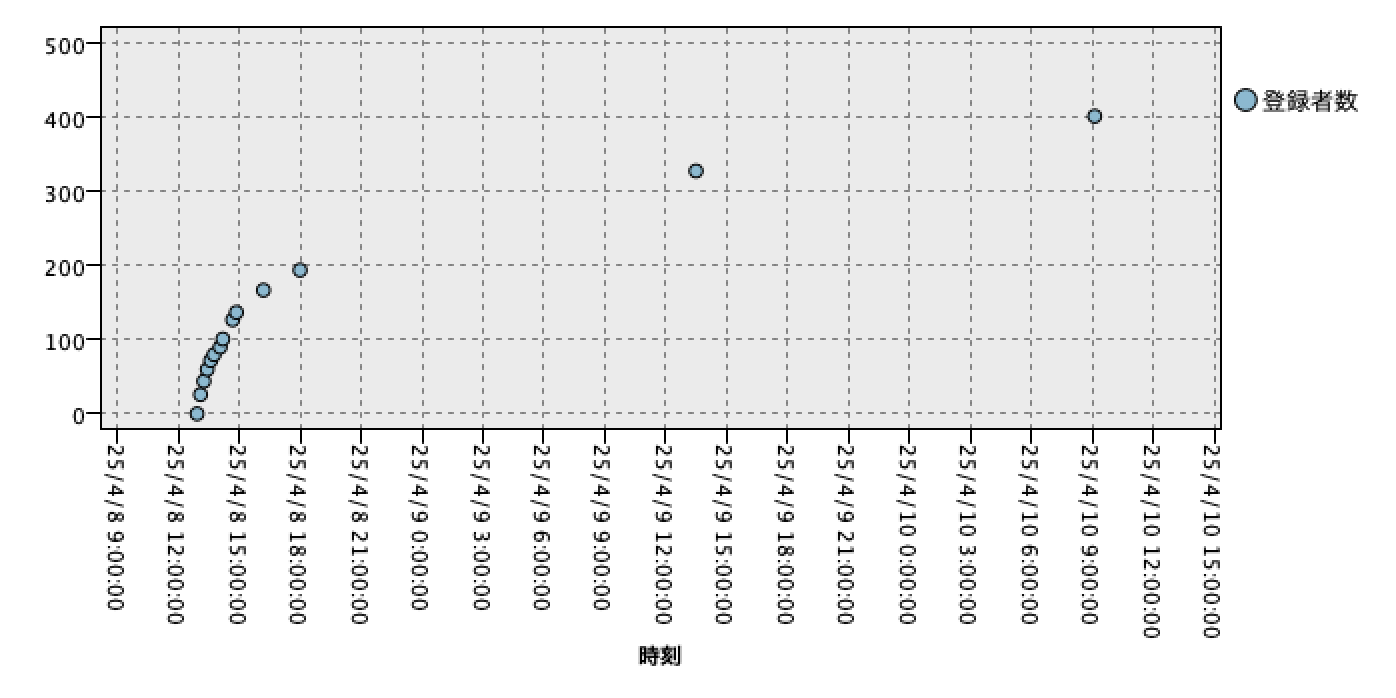
b.[時系列グラフ]ノードを編集します。[ユーザー設定]にタイムスタンプ列を指定します。
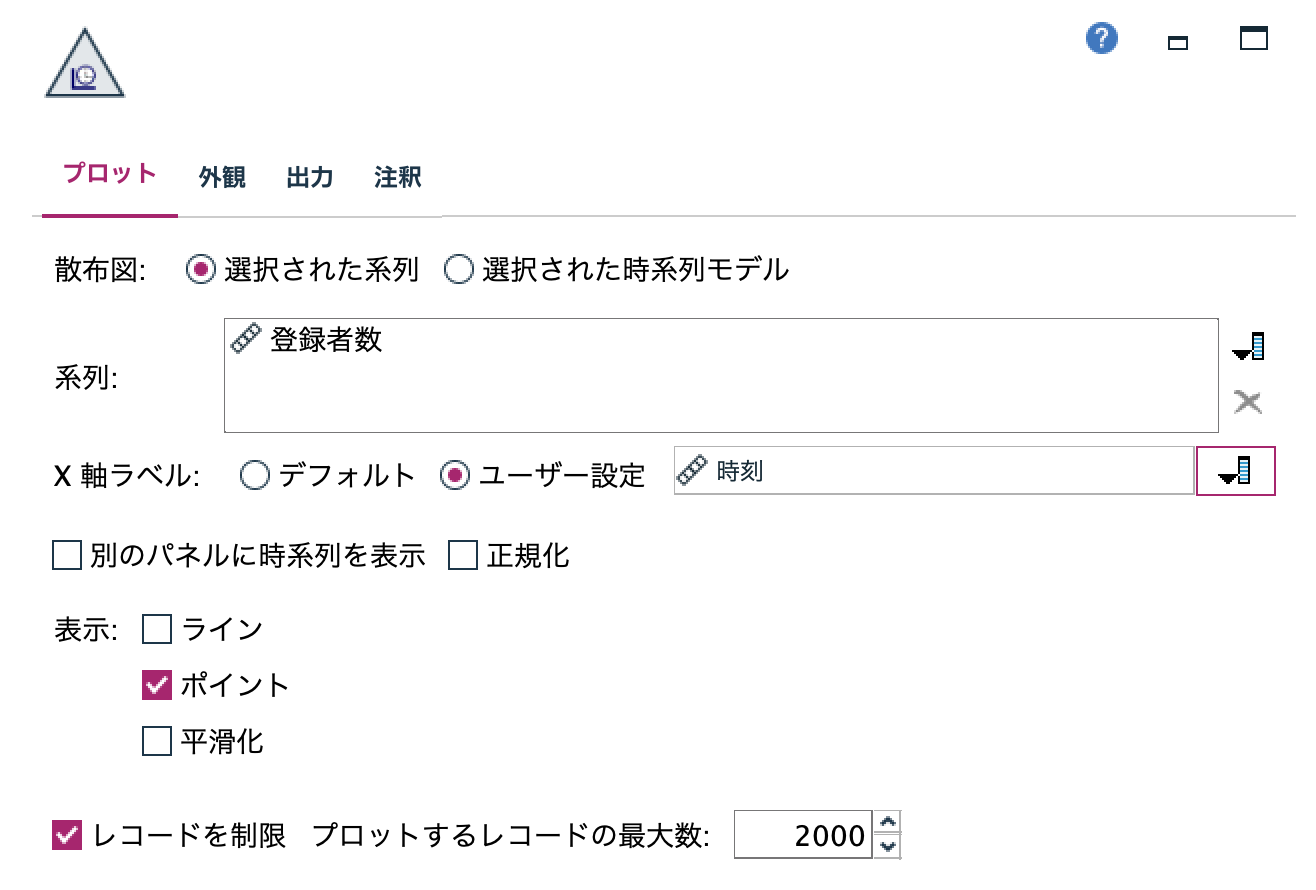
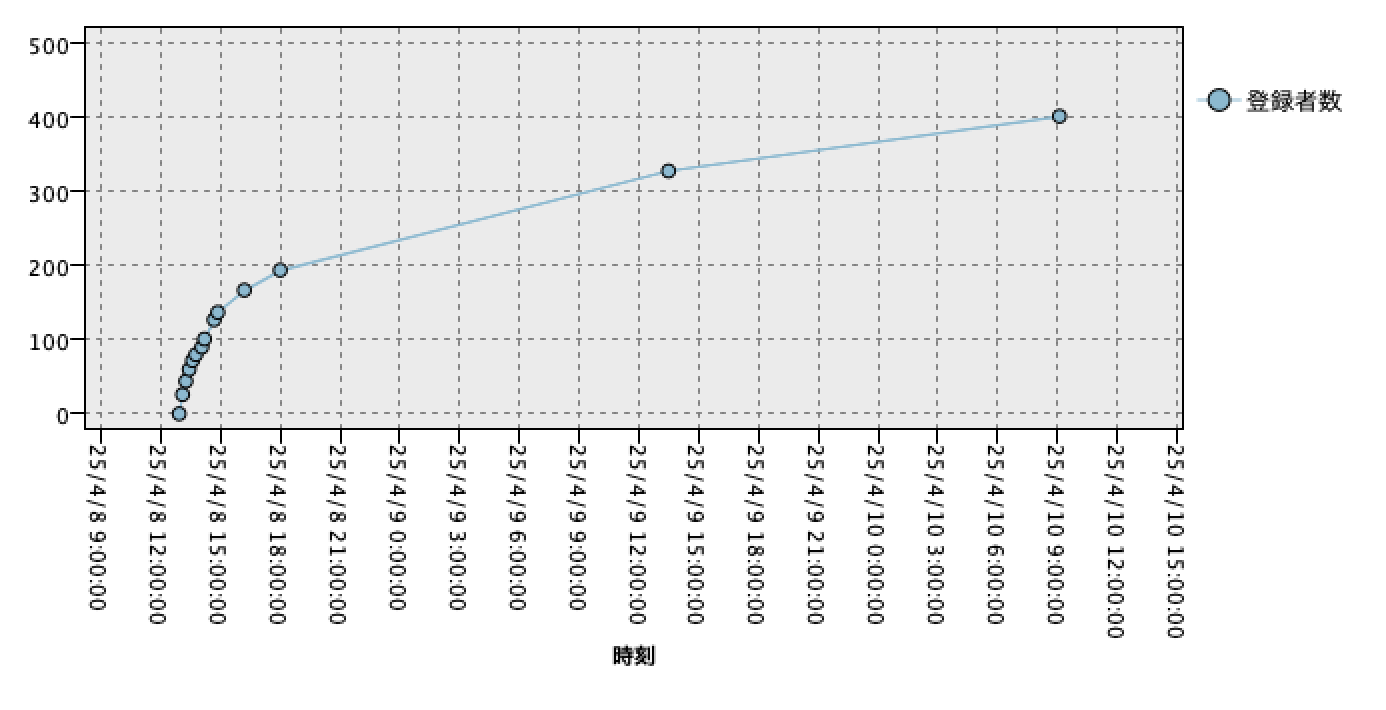
[実行]します。実績のある値だけプロットされました。
c.[時系列グラフ]ノードを編集します。[表示]に[ライン]を加えます。
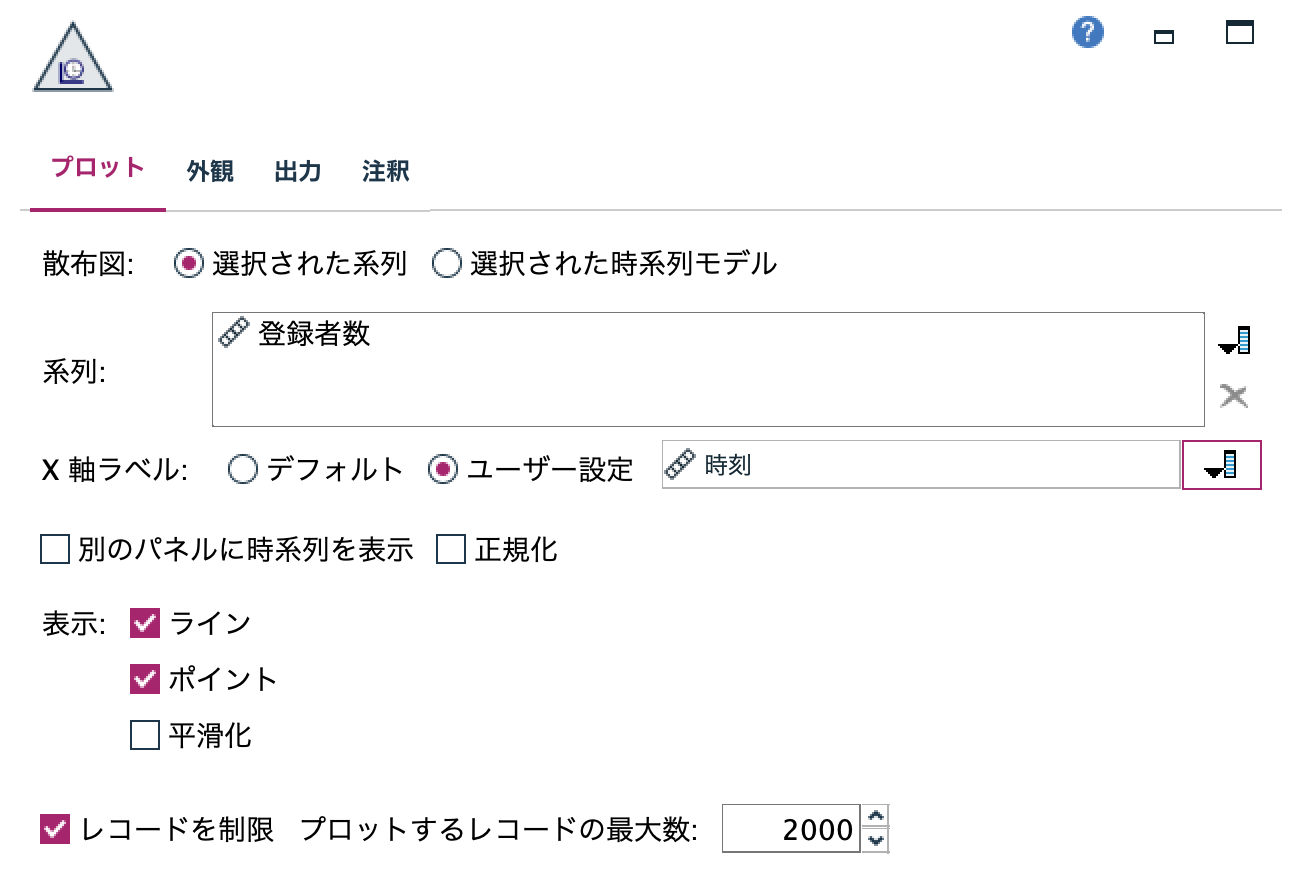
[実行]します。
注意事項
最後の記録以降をグラフに表示させる場合や、予測モデルに利用するため欠損値を線形補間するには
逆引き5-18を参考にしてください。
4.参考情報
時系列グラフ
日付と時刻の列からタイムスタンプの列を作成する
SPSS Modeler ノードリファレンス目次
SPSS Modeler 逆引きストリーム集(データ加工)