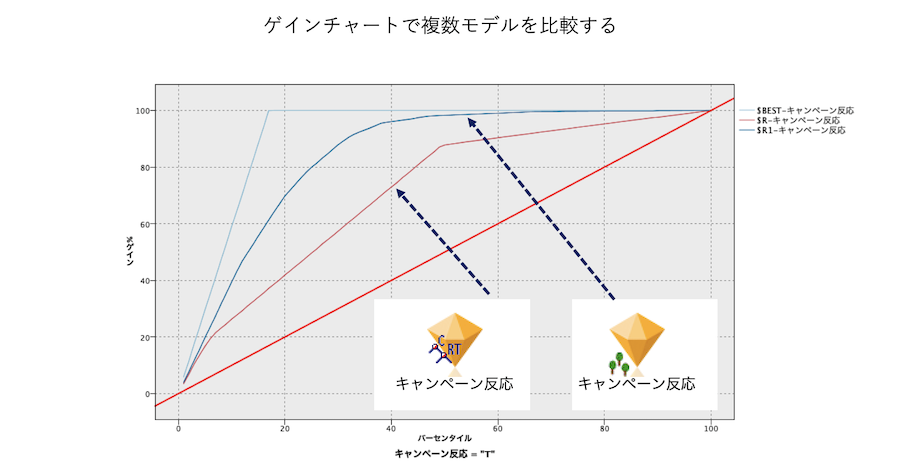
ゲインチャートで複数モデルを比較する(評価グラフ)
1.想定される利用目的
・複数の予測モデルの性能比較
2.サンプルストリームのダウンロード
ストリーム
3.サンプルストリームの説明
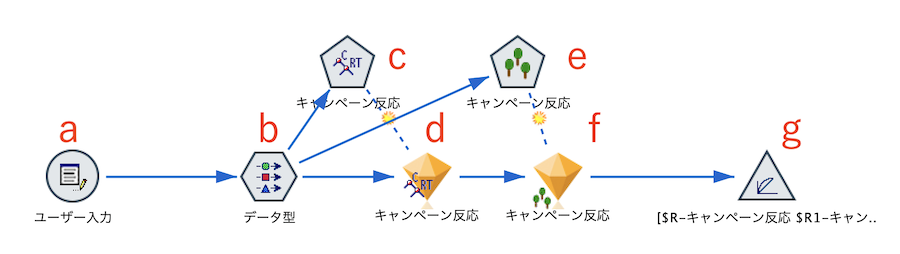
a.入力データは以下の通りです。

b.[データ型]ノードを編集します。キャンペーン反応を他の項目から予測します。

c.[C&RTree]ノードを実行します。
d.[C&RTree]ナゲットを配置します。
e.[Random Trees]ノードを実行します。
f.[Random Trees]ナゲットを配置します。
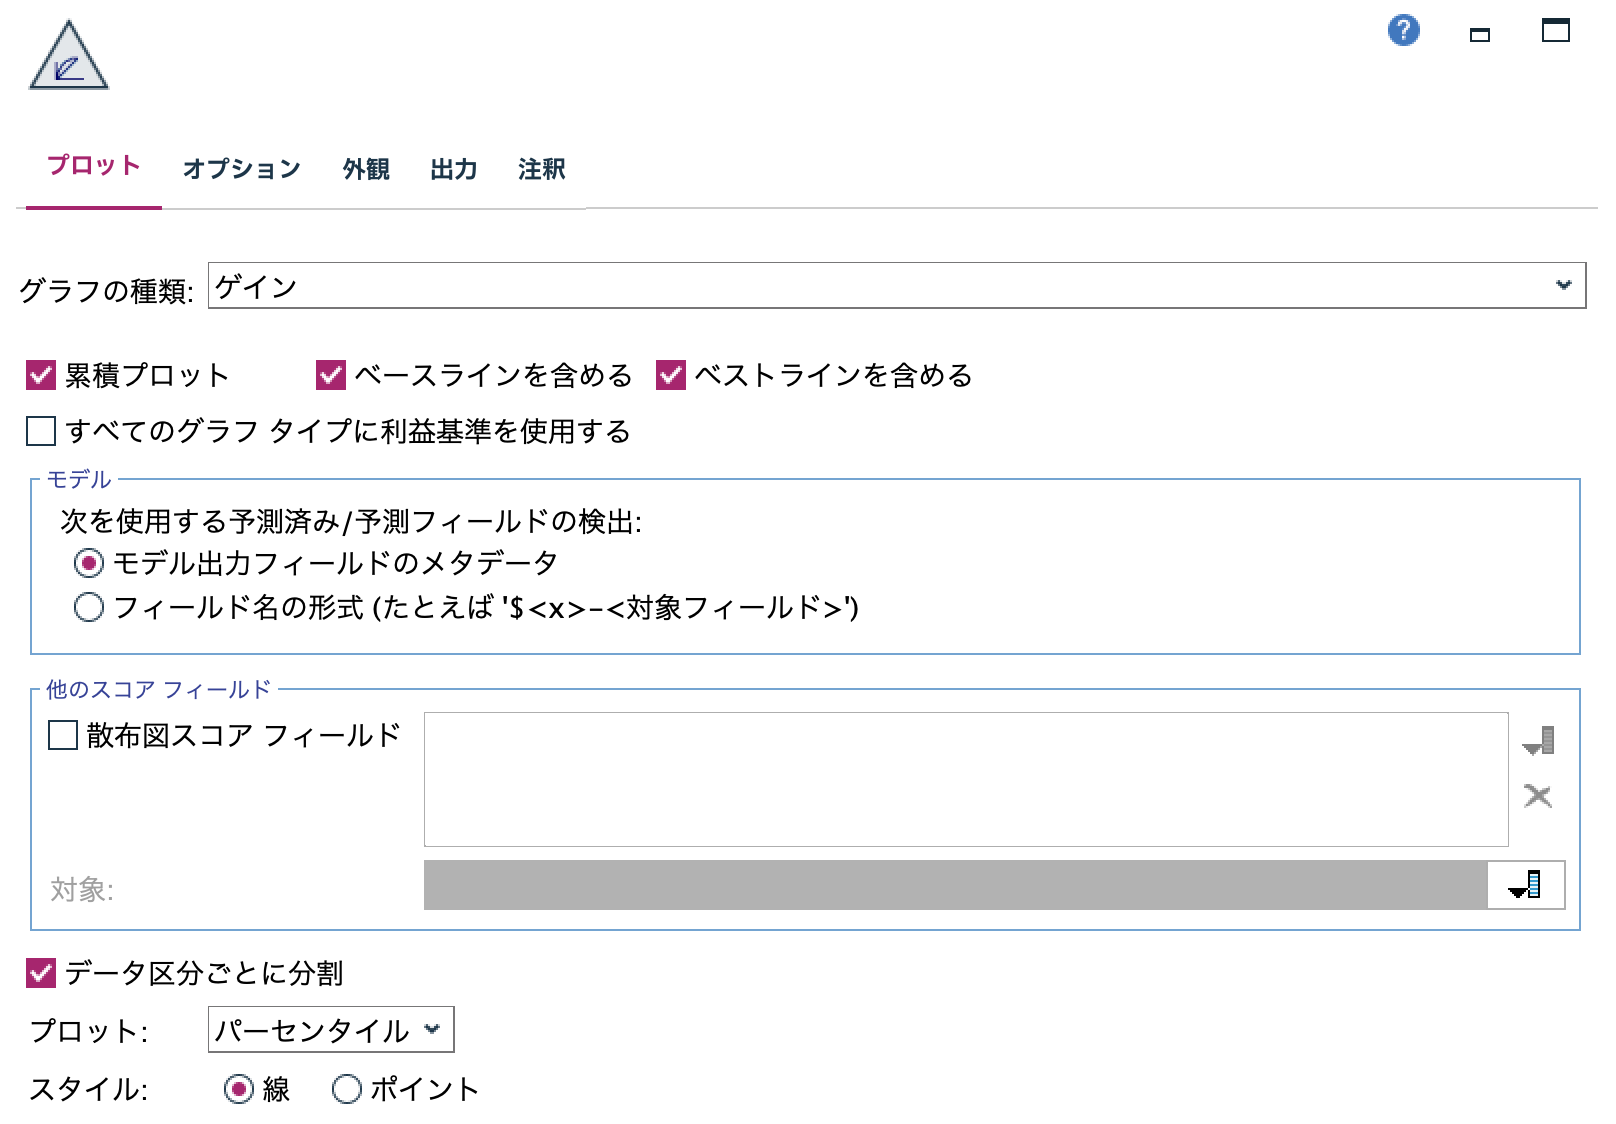
g.[評価グラフ]ノードを編集します。
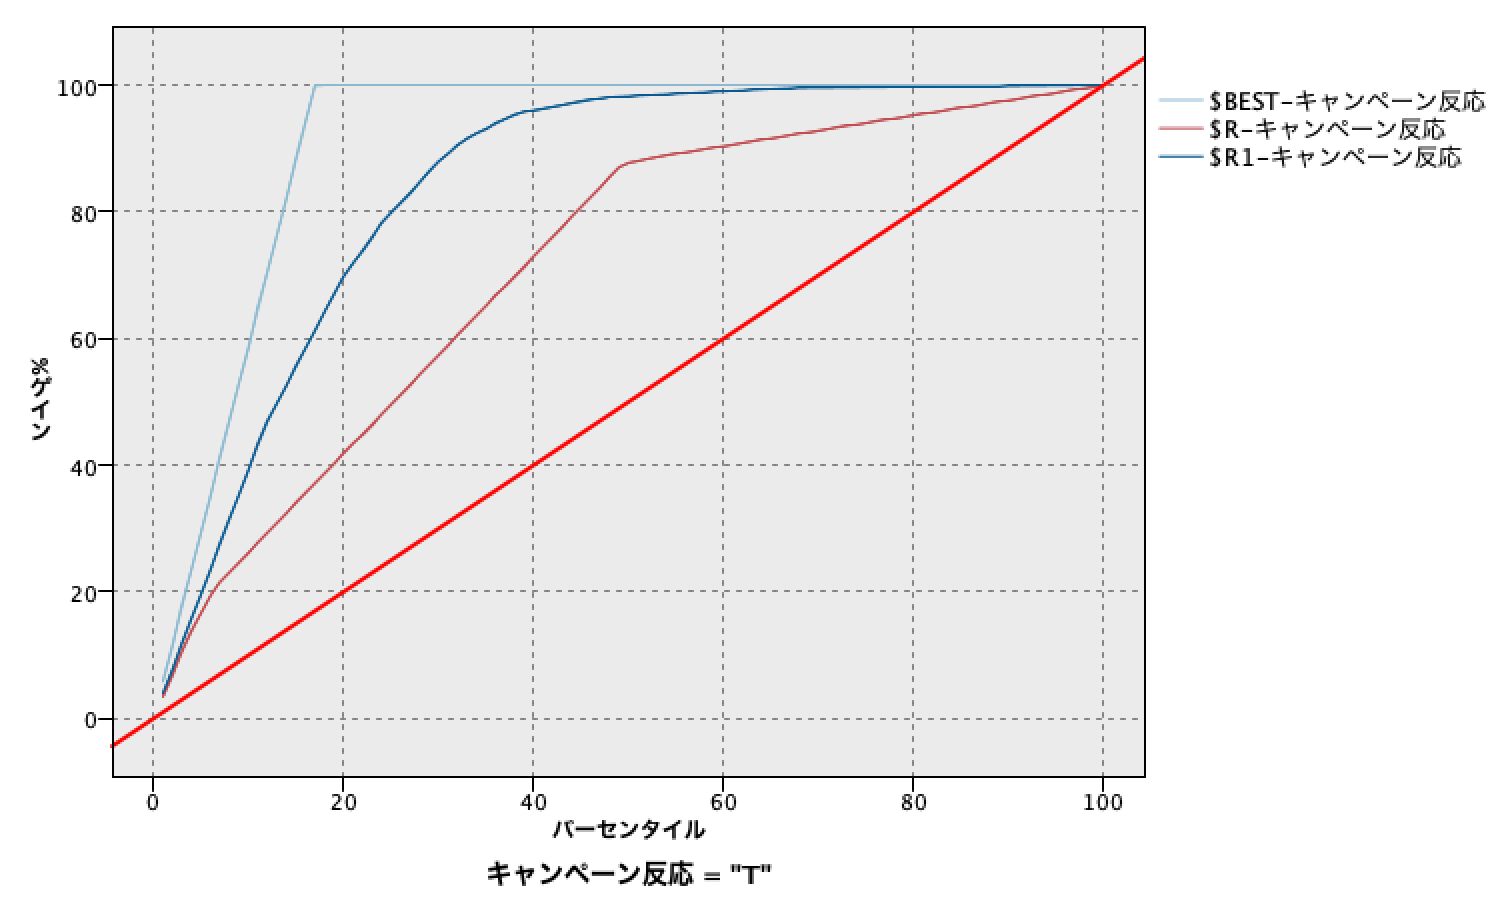
[実行]します。上からベストモデル、Random Trees、C&RTreeのカーブが描画されました。X軸の20は対象データのスコア上位2割を示しており、Random Treesのスコア上位2割で実際のキャンペーン反応の7割を、C&RTreeのそれでは4割を捕捉できます。
注意事項
ゲインチャートの座標からGini(AR値)を求める方法はこちらです。
4.参考情報
評価グラフ
SPSS Modeler ノードリファレンス目次
SPSS Modeler 逆引きストリーム集(データ加工)