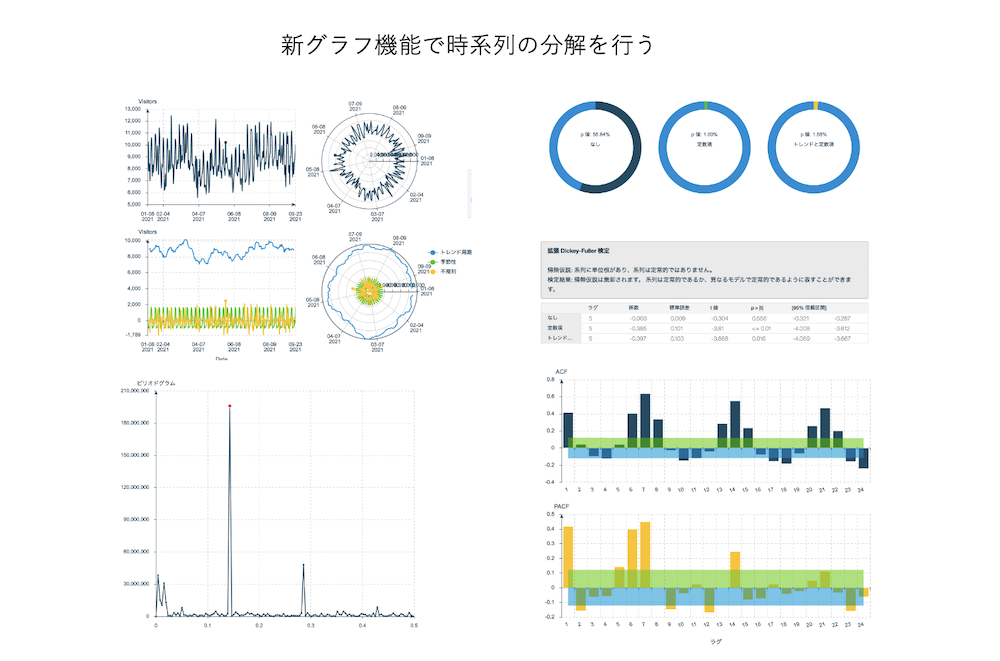
時系列を分解する(新グラフ)
*一般的な時系列グラフには逆引き10-4で紹介した複数系列の表示を用います。
1.想定される利用目的
・時系列予測モデリングのためのデータ理解
2.サンプルストリームのダウンロード
3.サンプルストリームの説明
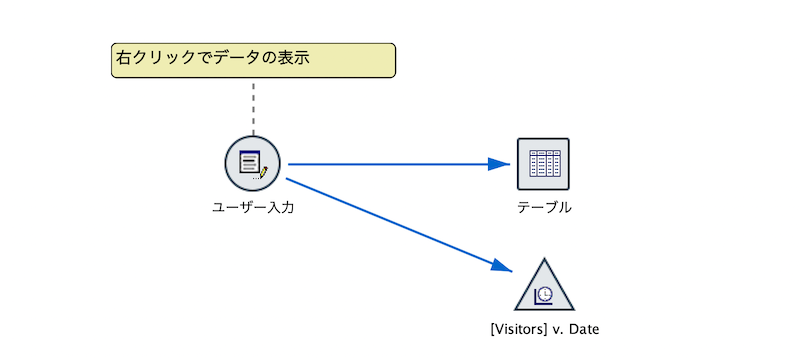
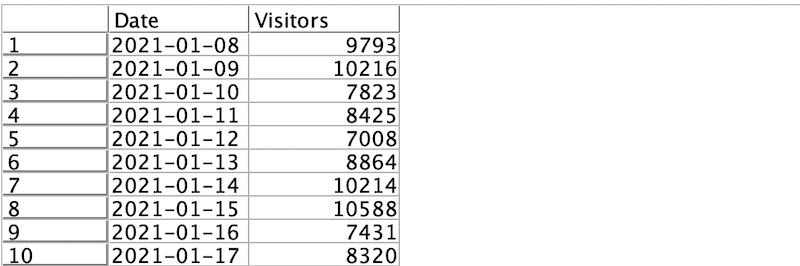
入力するデータを確認するため[テーブル]を実行します。
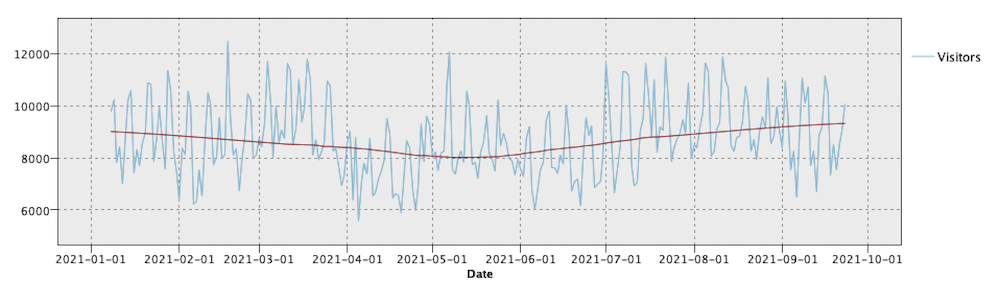
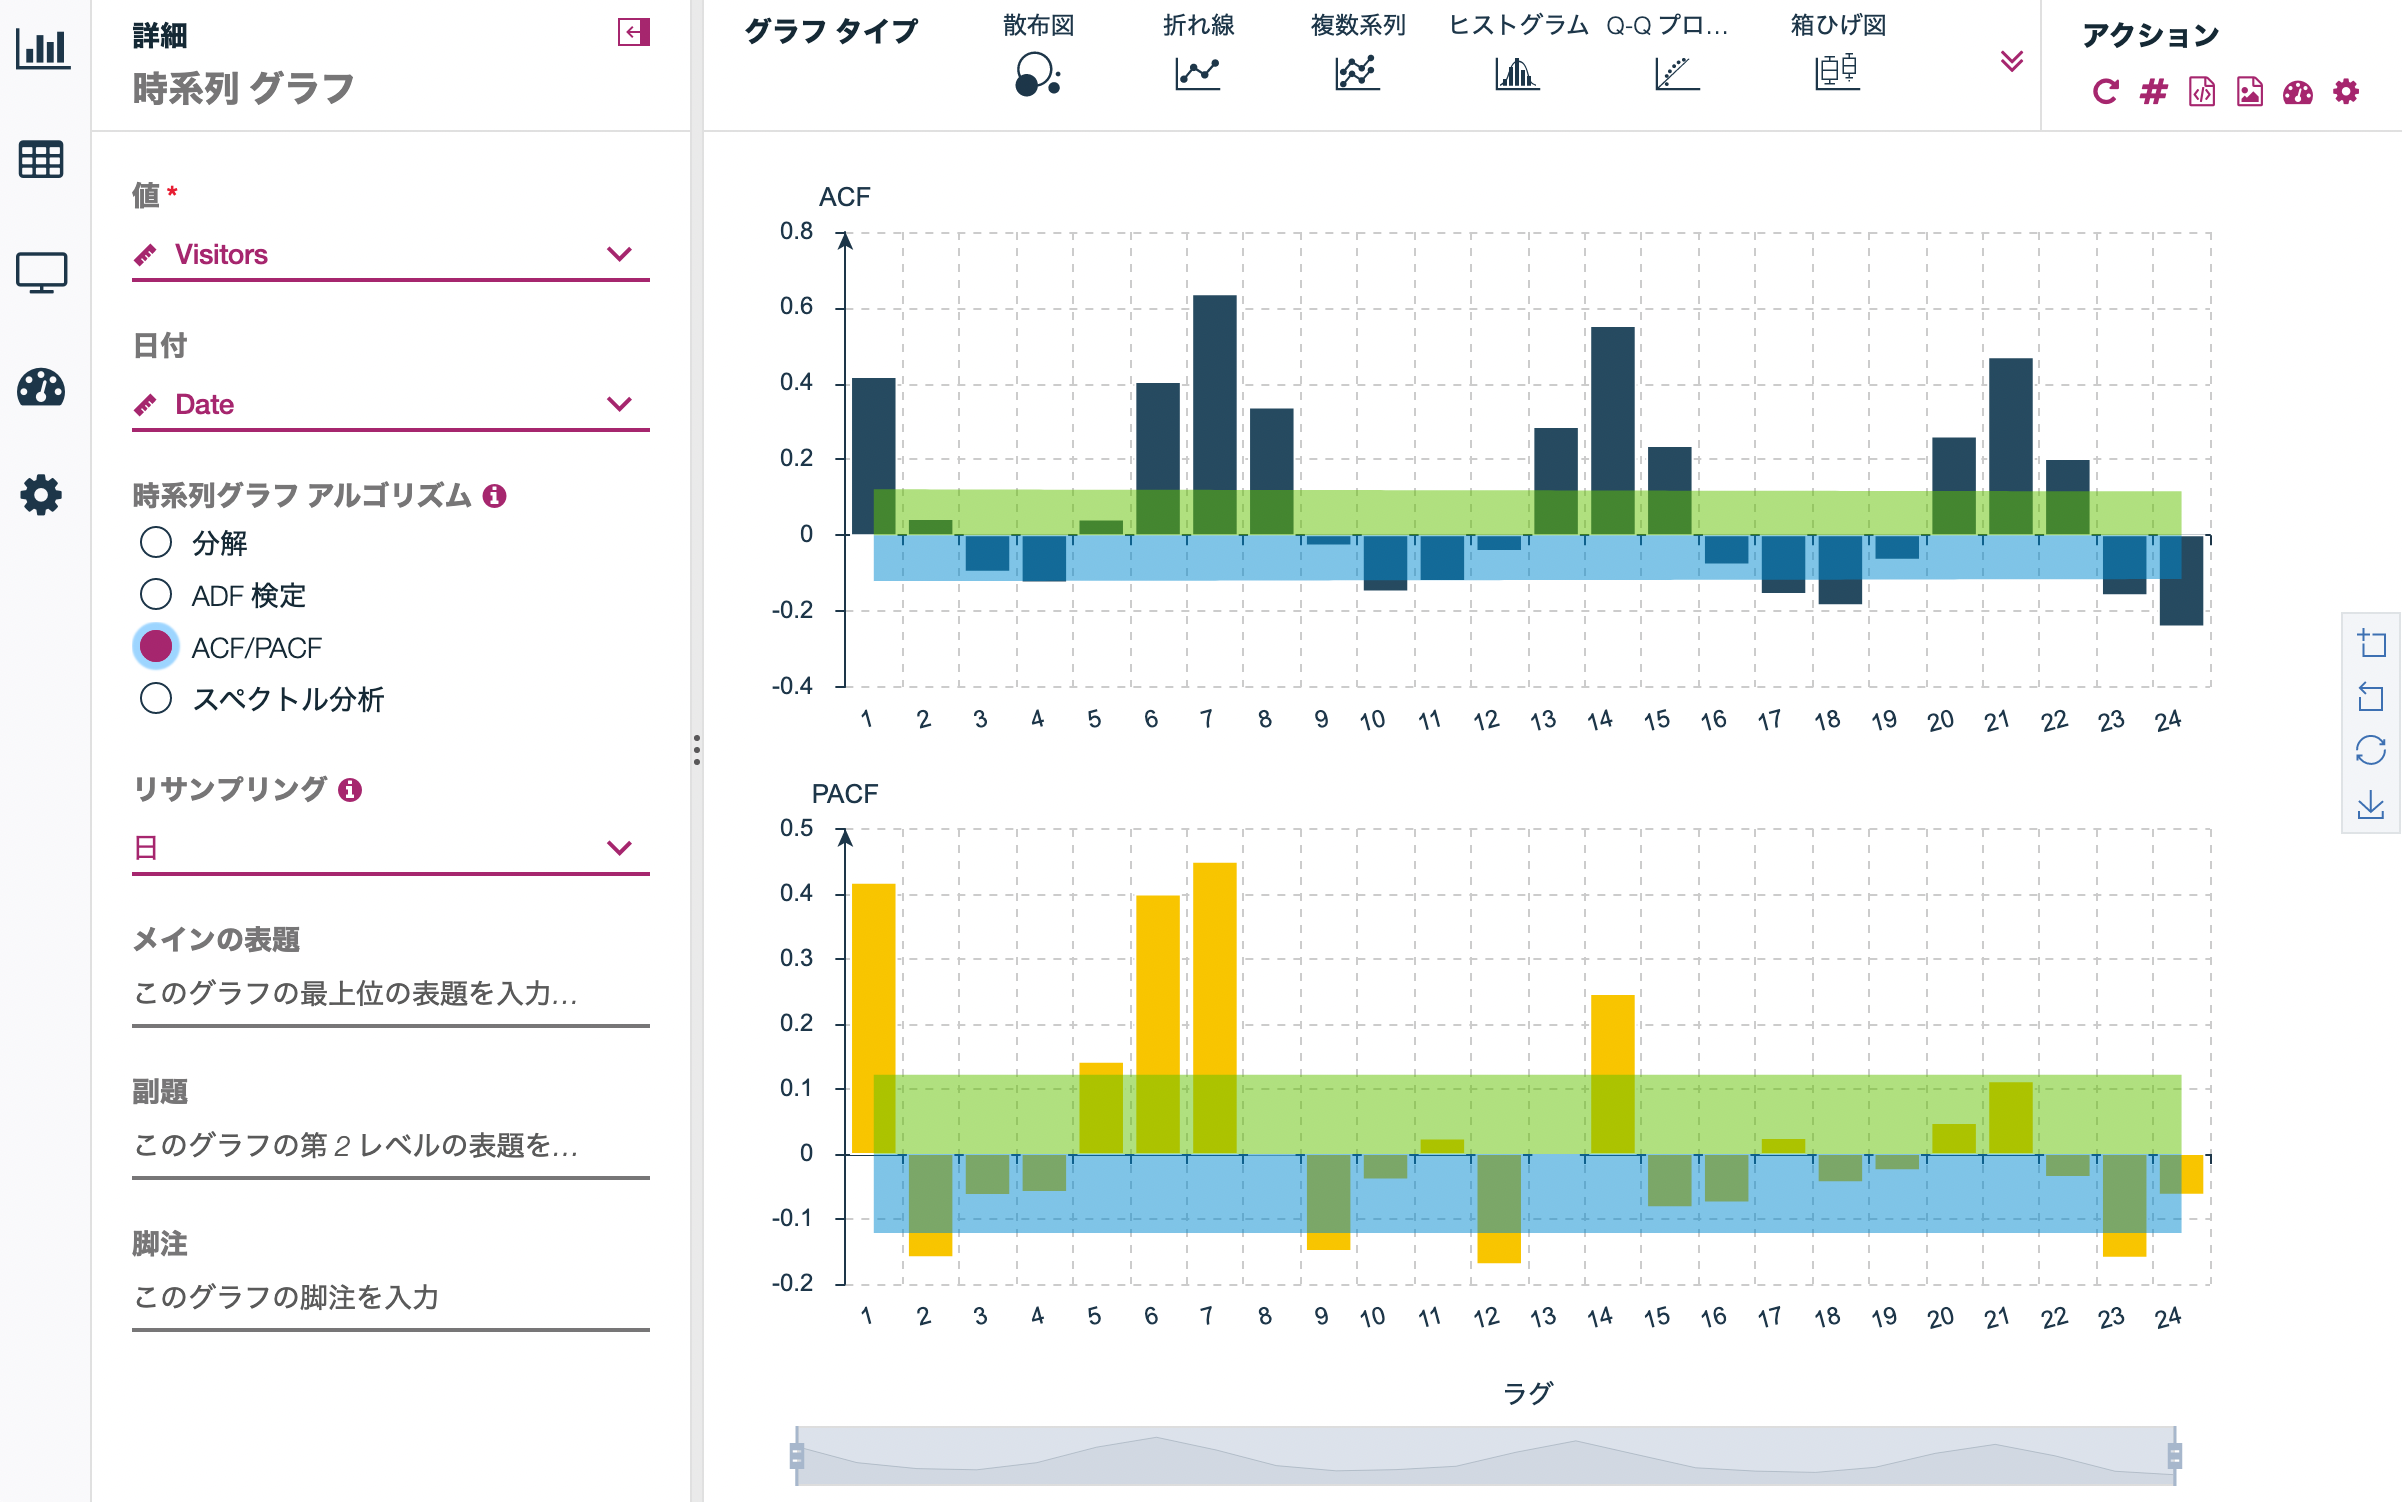
[時系列グラフ]ノードで従来のグラフを表示します。
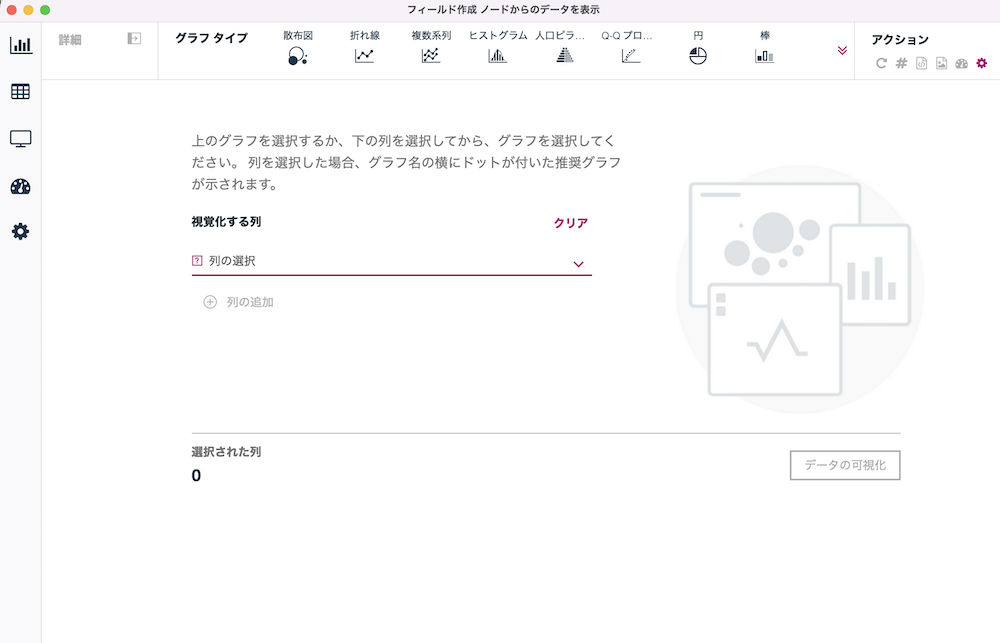
[ユーザー入力]ノードを右クリックして[データの表示]を選択します。
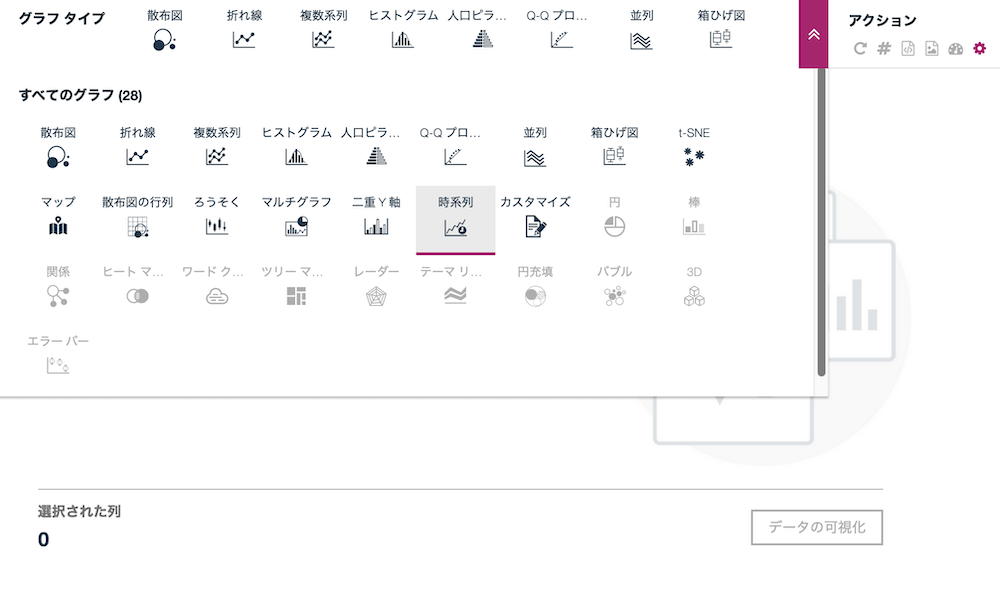
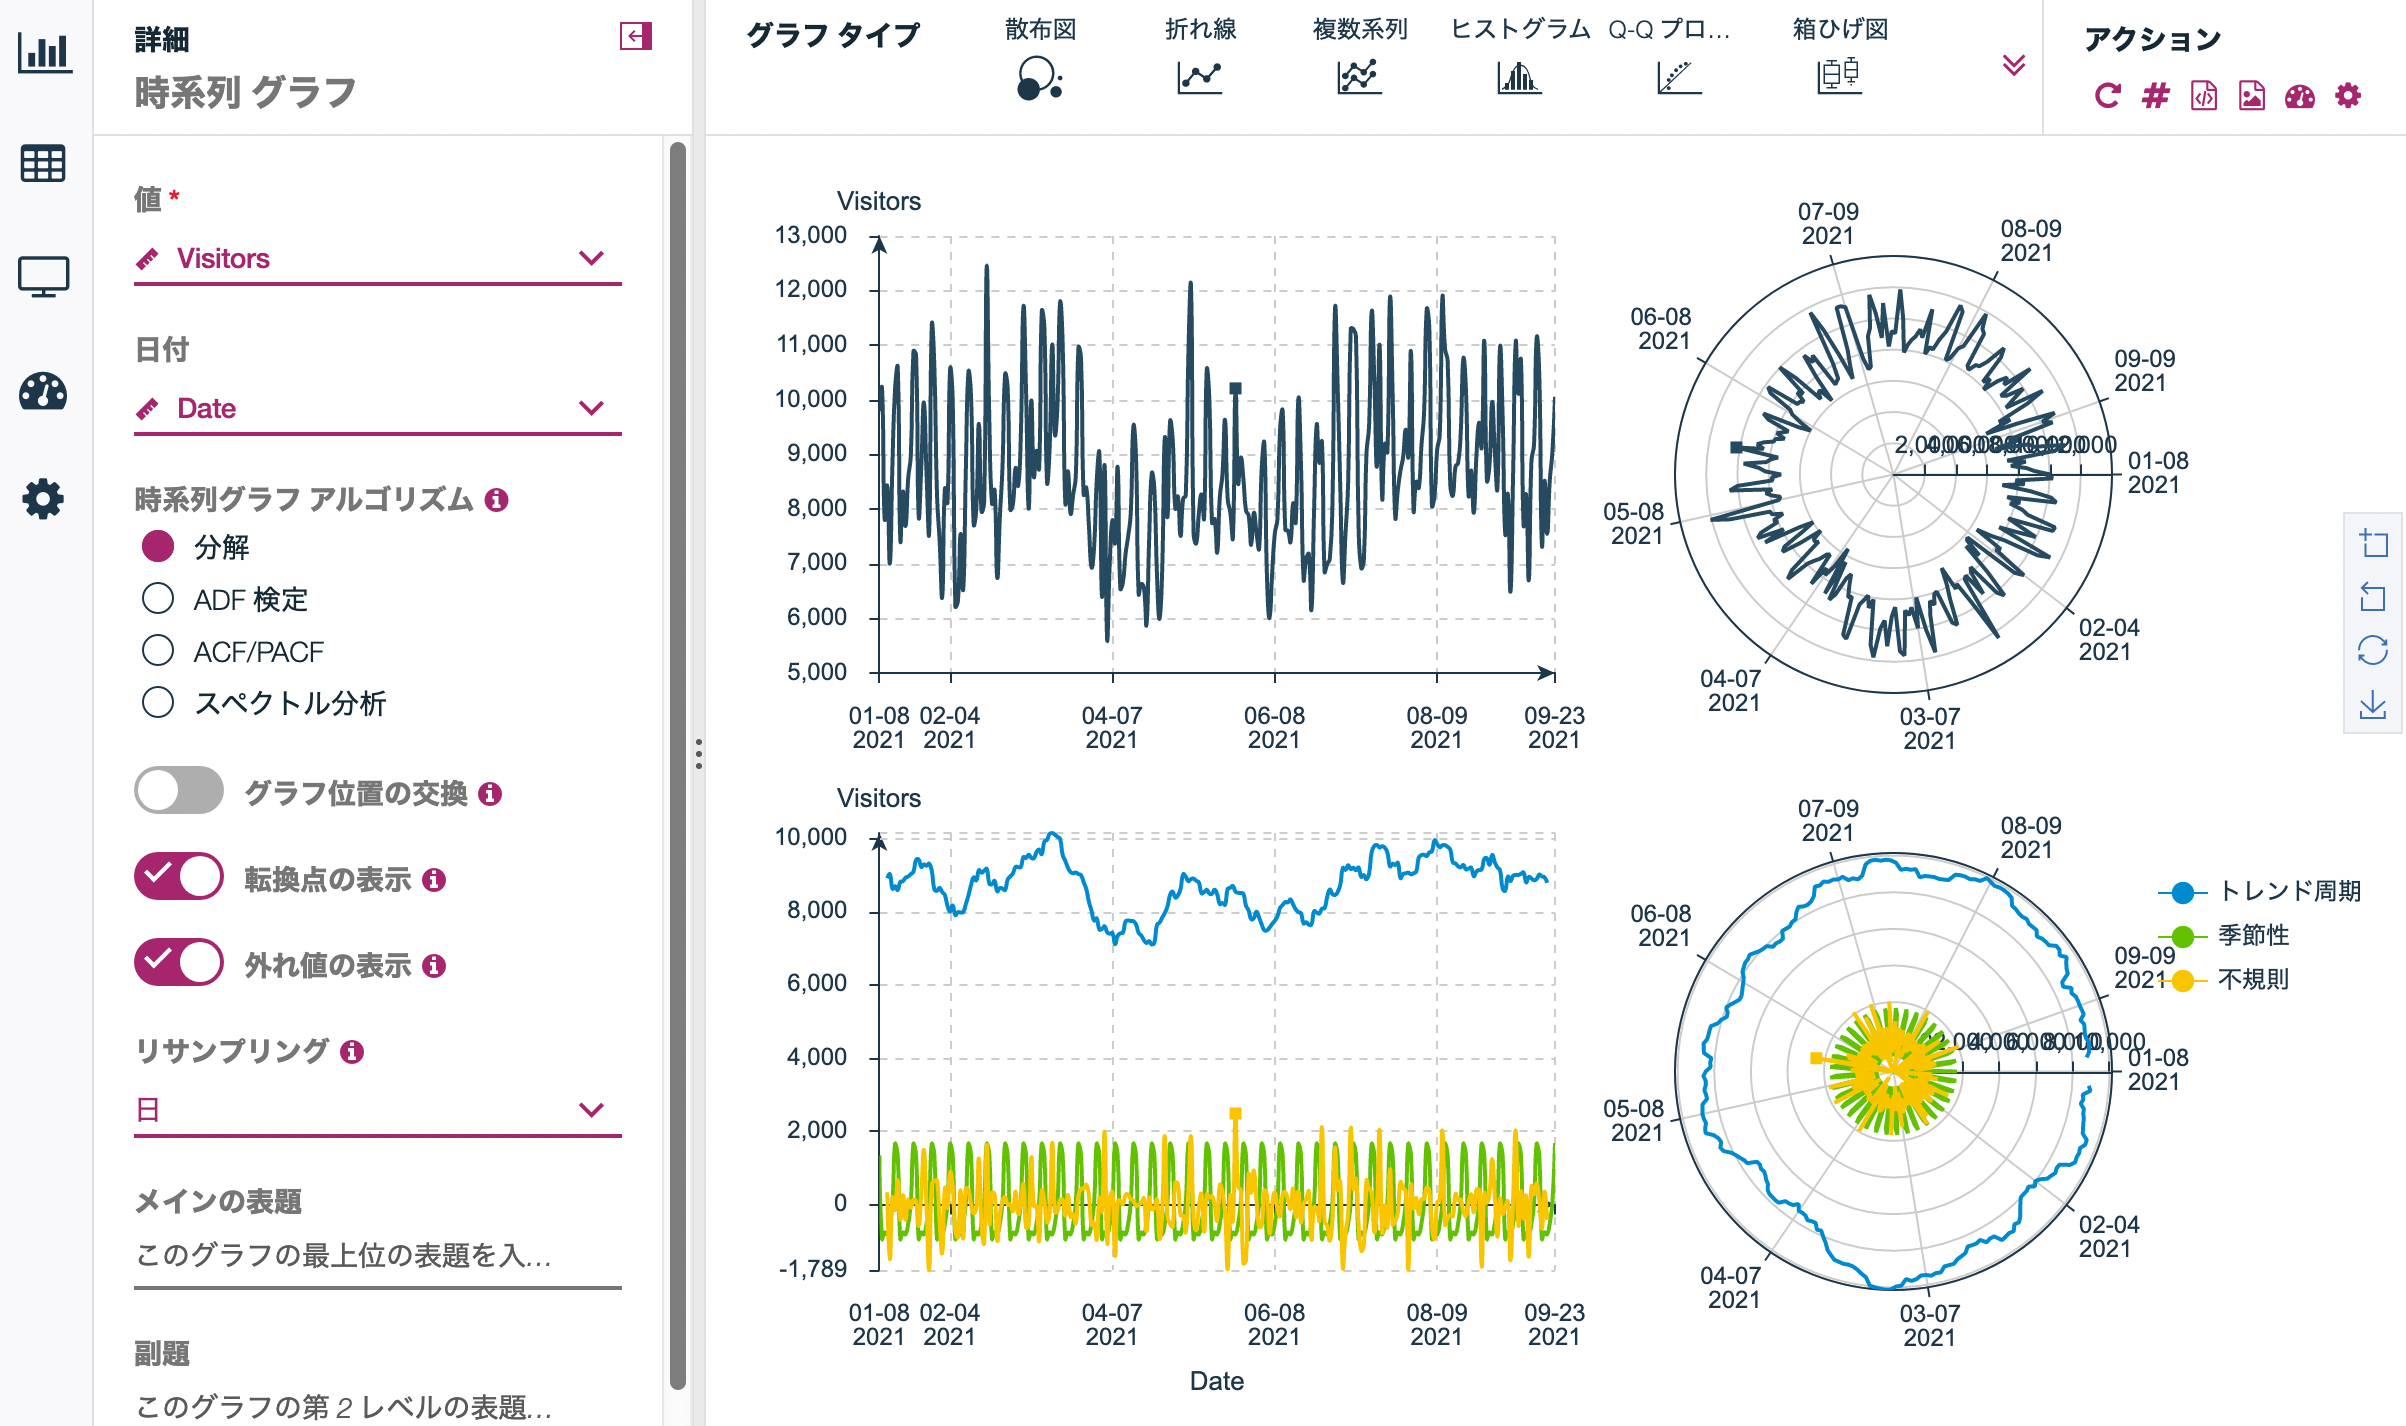
[時系列]を選択します。
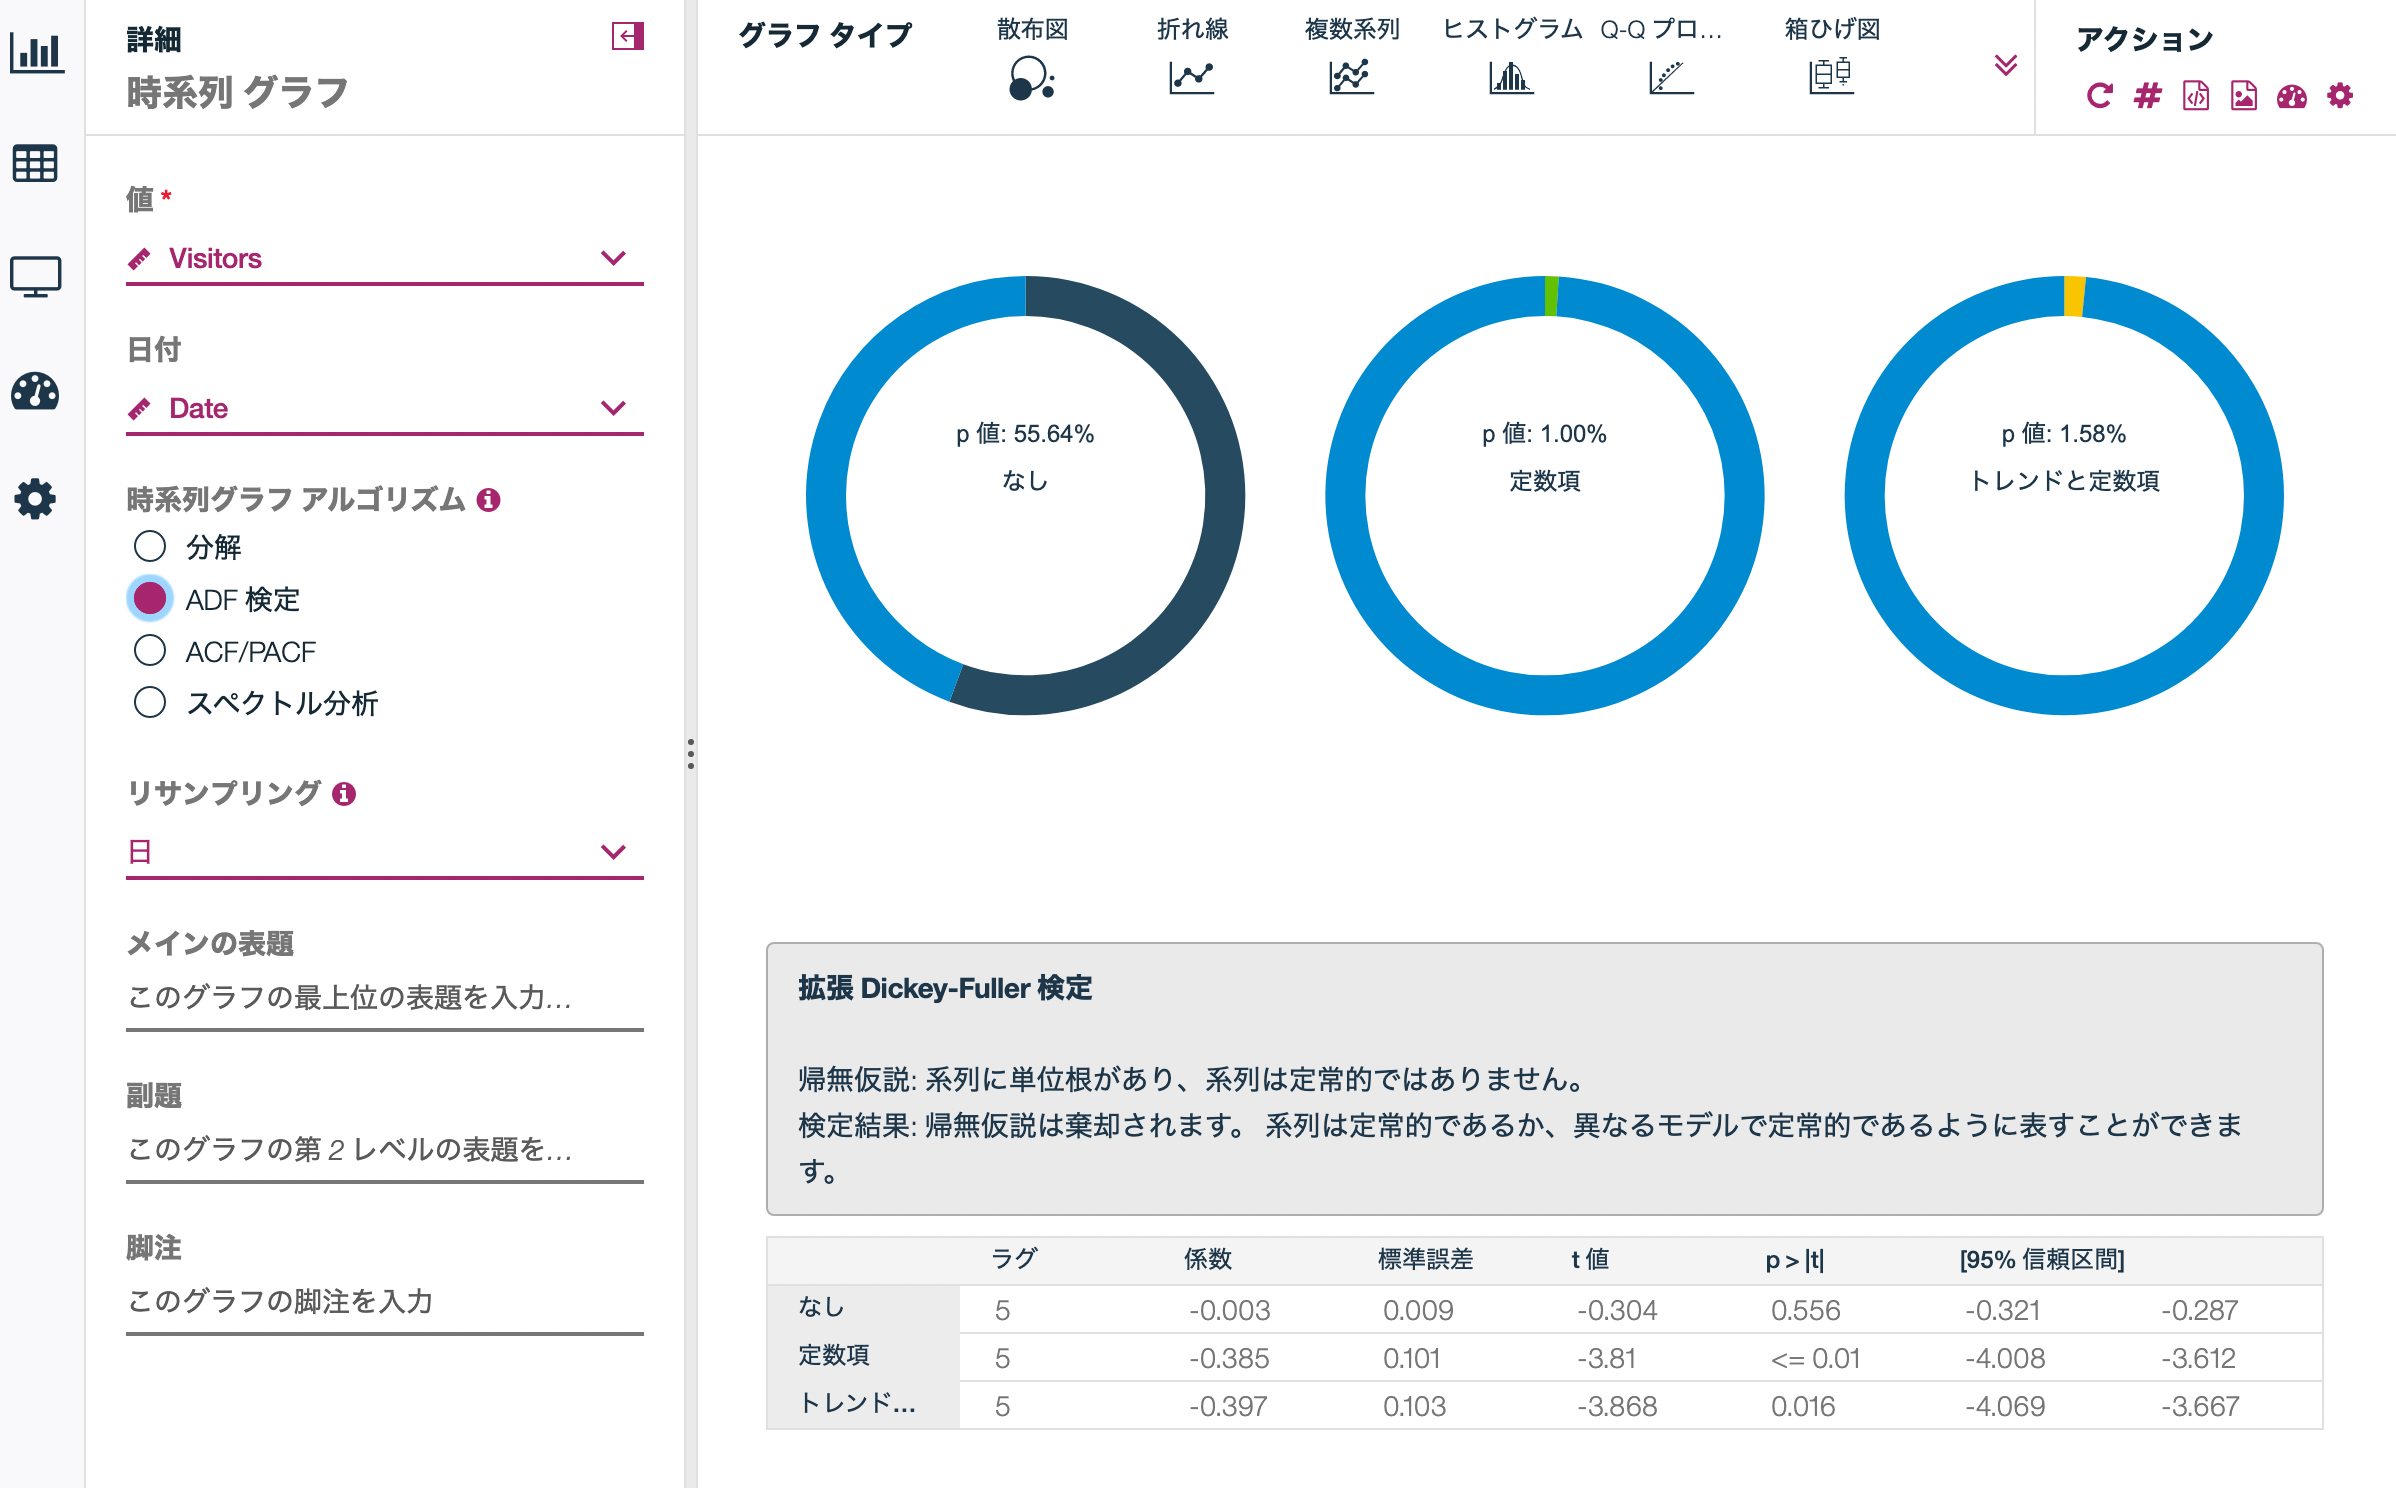
以下の画面左の設定に従いセットします。
注意事項
新グラフ機能はバージョン18.1以降で装備されました。
4.参考情報
新グラフを解説した記事
SPSS Modeler ノードリファレンス目次
SPSS Modeler 逆引きストリーム集(データ加工)