Rのパッケージchoroplethrのビネットの翻訳です.
( 原文: http://cran.r-project.org/web/packages/choroplethr/index.html )
- a) イントロダクション
- b) アメリカの州単位コロプレス図
- c) アメリカの郡単位コロプレス図
- d) アメリカの郵便番号に基づく地図
- e) 国家単位のコロプレス図
- f) 国勢調査の地図
- g) 世界銀行データの地図
- h) コロプレス図の動画
- i) 自分の地図を作る
- j) 行政区画レベル1の地図を作る
b) アメリカの州単位コロプレス図
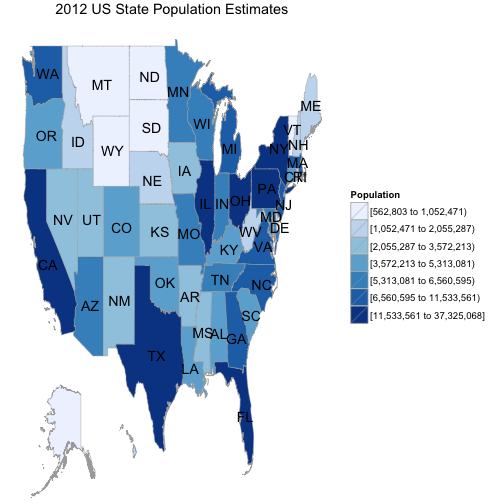
state_choropleth関数によってアメリカの州単位のコロプレス図を作成することができます.
library(choroplethr)

?df_pop_state
data(df_pop_state)

?state_choropleth
state_choropleth(df_pop_state)
上で示したように,state_choroplethに必須の引数はデータフレームだけです.
オプション引数は?state_choroplethとタイプすれば見ることができます.
データ要件
state_choropleth関数に渡すデータフレームは"region"と"value"という名前の列を持っている必要があります.
"region"列の要素はchoroplethrが使用している地図の地域名と厳密に一致している必要があります.
これらの地域名はstate.regionsオブジェクトで定義されています.
library(choroplethrMaps)

?state.regions
data(state.regions)
head(state.regions)
##       region abb fips.numeric fips.character
## 1     alaska  AK            2             02
## 2    alabama  AL            1             01
## 3   arkansas  AR            5             05
## 4    arizona  AZ            4             04
## 5 california  CA            6             06
## 6   colorado  CO            8             08
choroplethrを使用するためには,state.regionsの"region"列の命名規則に従わなければなりません.
データの探索
state_choropleth 関数にはデータの探索を助ける二つの引数が用意されています.
num_colorsとzoom引数です.
num_colorsの値はデフォルトでは7です.これは7種類の色が使用され,それぞれの色で等しい数の州が塗り分けられるということです.
num_colorsが1の場合は連続的なカラースケールが使用されます.
zoomはデフォルトではNULLであり,全ての州が表示されます.
zoomには有効な地域名のベクトルを指定することができます.
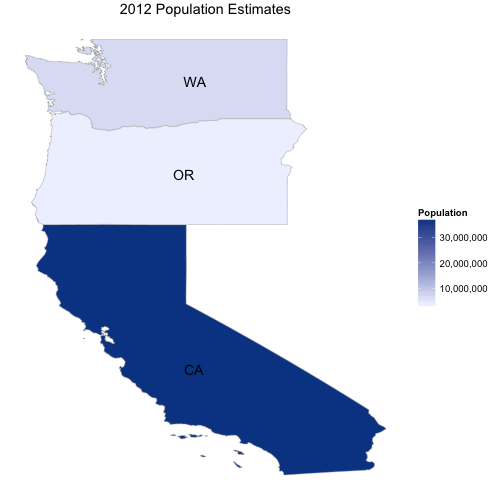
例として,choroplethrでアメリカ西海岸の州の人口を表示してみましょう.
state_choropleth(df_pop_state,
                 title      = "2012 Population Estimates",
                 legend     = "Population",
                 num_colors = 1,
                 zoom       = c("california", "washington", "oregon"))
高度なオプション
上で例示したオプション引数によるカスタマイズ以上のことがしたい場合は,
StateChoroplethオブジェクトを作成する必要があります.
choroplethrはオブジェクト指向プログラミングを活用するためにR6を使っています.
以下の例ではパレットをカスタマイズするためにChoropleth基底オブジェクトを
ggplot2_scaleを使って拡張しています.
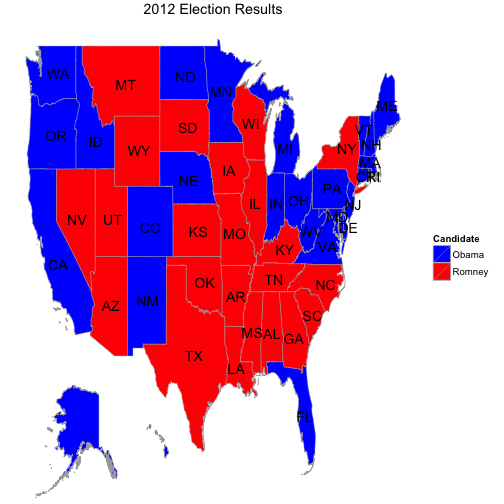
このデータセットは2012年のアメリカ大統領選挙のものです.
通常は,この地図では民主党支持の州は青で,共和党支持の州は赤で表示されます.
library(ggplot2)

?df_president
data(df_president)

choro = StateChoropleth$new(df_president)
choro$title = "2012 Election Results"
choro$ggplot_scale = scale_fill_manual(name="Candidate", values=c("blue", "red"))
choro$render()
州名のラベルを取り除く等の,StateChoroplethの他のオプションについては,choroplethrのソースコードを参照してください.
注意:StateChoroplethオブジェクトに手動でスケールを設定するときは注意が必要です.特に,choroplethrではアラスカとハワイを地図に差し込むためにggplot2のカスタムアノテーションを使用しているので,以下の手順に従わないと地図の主要部分と差し込み部分のスケールが一致しません.
- 離散的なスケールの場合は,上の例のように
drop=FALSE引数をスケールの関数に渡してください. - 連続的なスケールの場合は,データセット全体の最小値と最大値を含んだ
limits引数を渡してください.


