Rのパッケージchoroplethrのビネットの翻訳です.
( 原文: http://cran.r-project.org/web/packages/choroplethr/index.html )
- a) イントロダクション
- b) アメリカの州単位コロプレス図
- c) アメリカの郡単位コロプレス図
- d) アメリカの郵便番号に基づく地図
- e) 国家単位のコロプレス図
- f) 国勢調査の地図
- g) 世界銀行データの地図
- h) コロプレス図の動画
- i) 自分の地図を作る
- j) 行政区画レベル1の地図を作る
e) 国家単位のコロプレス図
country_choropleth関数で国のコロプレス図を作成することができます.
library(choroplethr)
?df_pop_country
data(df_pop_country)
?country_choropleth
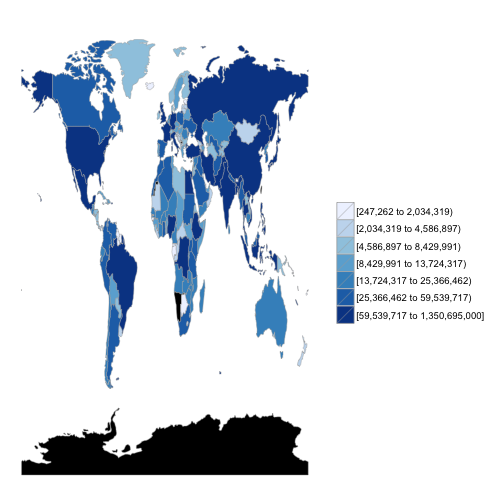
country_choropleth(df_pop_country)
## Warning in self$bind(): The following regions were missing and are being
## set to NA: namibia, western sahara, taiwan, antarctica, kosovo
上で示したように,country_choroplethに必須の引数はデータフレームだけです.
オプション引数は?country_choroplethとタイプすれば見ることができます.
この地図はchoroplethrの新たな機能の例示になっています.
"value"がない場合(南極の人口って何人でしょうか?),その地域は黒く表示されます
データ要件
country_choropleth関数に渡すデータフレームは"region"と"value"という名前の列を持っている必要があります.
"region"列の要素はchoroplethrが使用している地図の地域名と厳密に一致している必要があります.
これらの地域名はcountry.regionsオブジェクトで定義されています.
library(choroplethrMaps)

?country.regions
data(country.regions)
head(country.regions)
##        region iso2c
## 1 afghanistan    AF
## 2      angola    AO
## 3  azerbaijan    AZ
## 4     moldova    MD
## 5  madagascar    MG
## 6      mexico    MX
choroplethrを使用するには,country.regionsの"region"列の命名規則に従わなければなりません.
つまり,アルファベット小文字でフルネームの国名を使う必要があります.
データの探索
country_choropleth 関数にはデータの探索を助ける二つの引数が用意されています.num_colorsとzoom引数です.
num_colorsの値はデフォルトでは7です.これは7種類の色が使用され,それぞれの色で等しい数の州が塗り分けられるということです.
num_colorsの有効な値は1から7の間の整数です.
num_colorsが1の場合は連続的なカラースケールが使用されます.
zoomはデフォルトではNULLであり,全ての州が表示されます.
zoomには有効な州の名前のベクトルを指定することができます.
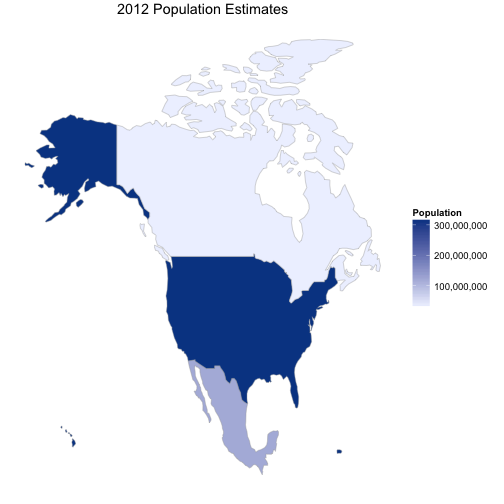
例として,choroplethrでアメリカ,カナダ,メキシコの人口を表示してみましょう.
country_choropleth(df_pop_country,
                 title      = "2012 Population Estimates",
                 legend     = "Population",
                 num_colors = 1,
                 zoom       = c("united states of america", "mexico", "canada"))
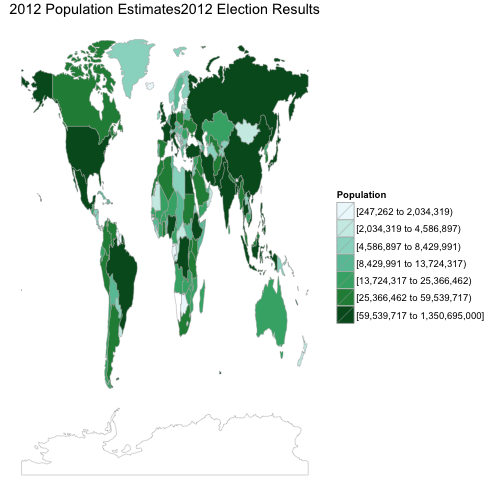
高度なオプション
上で例示したオプション引数によるカスタマイズ以上のことがしたい場合は,
CountryChoroplethオブジェクトを作成する必要があります.
choroplethrはオブジェクト指向プログラミングを活用するためにR6を使っています.
以下の例ではパレットをカスタマイズするためにChoropleth基底オブジェクトを
ggplot2_scaleを使って拡張しています.
library(ggplot2)

choro = CountryChoropleth$new(df_pop_country)
choro$title = "2012 Population Estimates2012 Election Results"
choro$ggplot_scale = scale_fill_brewer(name="Population", palette=2)
choro$render()
## Warning in self$bind(): The following regions were missing and are being
## set to NA: namibia, western sahara, taiwan, antarctica, kosovo