Rのパッケージchoroplethrのビネットの翻訳です.
( 原文: http://cran.r-project.org/web/packages/choroplethr/index.html )
- a) イントロダクション
- b) アメリカの州単位コロプレス図
- c) アメリカの郡単位コロプレス図
- d) アメリカの郵便番号に基づく地図
- e) 国家単位のコロプレス図
- f) 国勢調査の地図
- g) 世界銀行データの地図
- h) コロプレス図の動画
- i) 自分の地図を作る
- j) 行政区画レベル1の地図を作る
g) 世界銀行データの地図
choroplethr は,世界銀行の世界開発指標(WDI)のデータからコロプレス図を作成する機能をネイティブで持っています.
この機能はchoroplethr_wdi function関数によって利用可能です(?choroplethr_wdi).世界開発指標についてはここでより詳しく学ぶことができます.
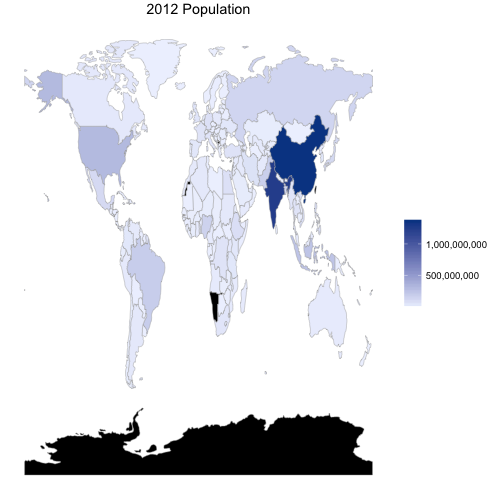
例:人口
世界の国々の人口を連続的なスケールを使って表したコロプレス図です.SP.POP.TOTLというコードのより詳しい情報についてはここを見てください.
library(choroplethr)
library(WDI)

choroplethr_wdi(code="SP.POP.TOTL", year=2012, title="2012 Population", buckets=1)
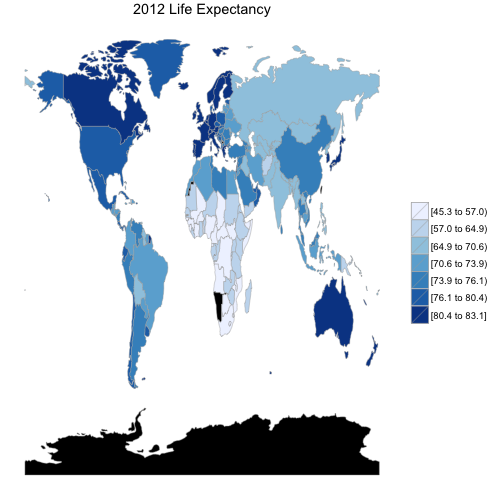
例:平均寿命
世界の国々の平均寿命のコロプレス図です.SP.DYN.LE00.INというコードのより詳しい情報についてはここを見てください.
choroplethr_wdi(code="SP.DYN.LE00.IN", year=2012, title="2012 Life Expectancy")
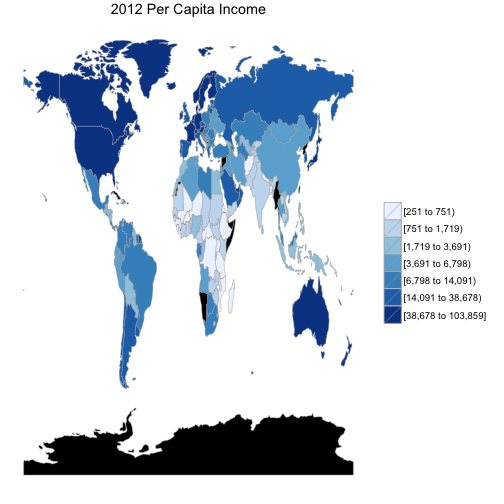
例:一人当たり所得
世界の国々一人当たり所得のコロプレス図です.NY.GDP.PCAP.CDというコードのより詳しい情報についてはここを見てください.
choroplethr_wdi(code="NY.GDP.PCAP.CD", year=2012, title="2012 Per Capita Income")