Rのパッケージchoroplethrのビネットの翻訳です.
( 原文: http://cran.r-project.org/web/packages/choroplethr/index.html )
- a) イントロダクション
- b) アメリカの州単位コロプレス図
- c) アメリカの郡単位コロプレス図
- d) アメリカの郵便番号に基づく地図
- e) 国家単位のコロプレス図
- f) 国勢調査の地図
- g) 世界銀行データの地図
- h) コロプレス図の動画
- i) 自分の地図を作る
- j) 行政区画レベル1の地図を作る
a) イントロダクション
コロプレス図(階級区分図)とは
コロプレス図とは
- 地理的な境界を描いて
- ある尺度に基づいて領域を塗り分けた
地図のことです.
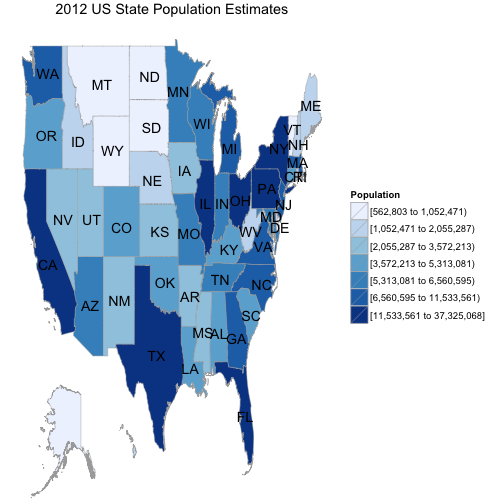
コロプレス図は,地理的な境界が自然な集計単位になっているデータを可視化する場合に便利です.
例として,2012年のアメリカの州別人口推計を表すコロプレス図を示します.
library(choroplethr)
?df_pop_state
data(df_pop_state)
state_choropleth(df_pop_state, title="2012 US State Population Estimates", legend="Population")
choroplethrとは
choroplethrはRでのコロプレス図の作成を容易にするRパッケージです.
そのために3つの特徴を備えています.
- 4つの異なる地図を用いたコロプレス図をすぐに作成できる関数を提供します.
- コロプレス図を作るための興味深いデータソースへのAPI接続を提供します.
- 任意のシェープファイル(Shapefile)からコロプレス図を作成するための
フレームワークを提供します.
残りのビネットではこれらの特徴について詳細に説明します.