背景・目的
以前、カスタムメトリクスやStep Functionsのログを確認してみました。
今回は、Step Functionsの実行状況をDatadogのダッシュボードで可視化したいと思います。
実践
- Datadogにサインインします
- ナビゲーションペインで、「Dashboards」をクリックします
- 「New Dashboard」をクリックします
- ダッシュボード名を指定し、New Dashboardをクリックします
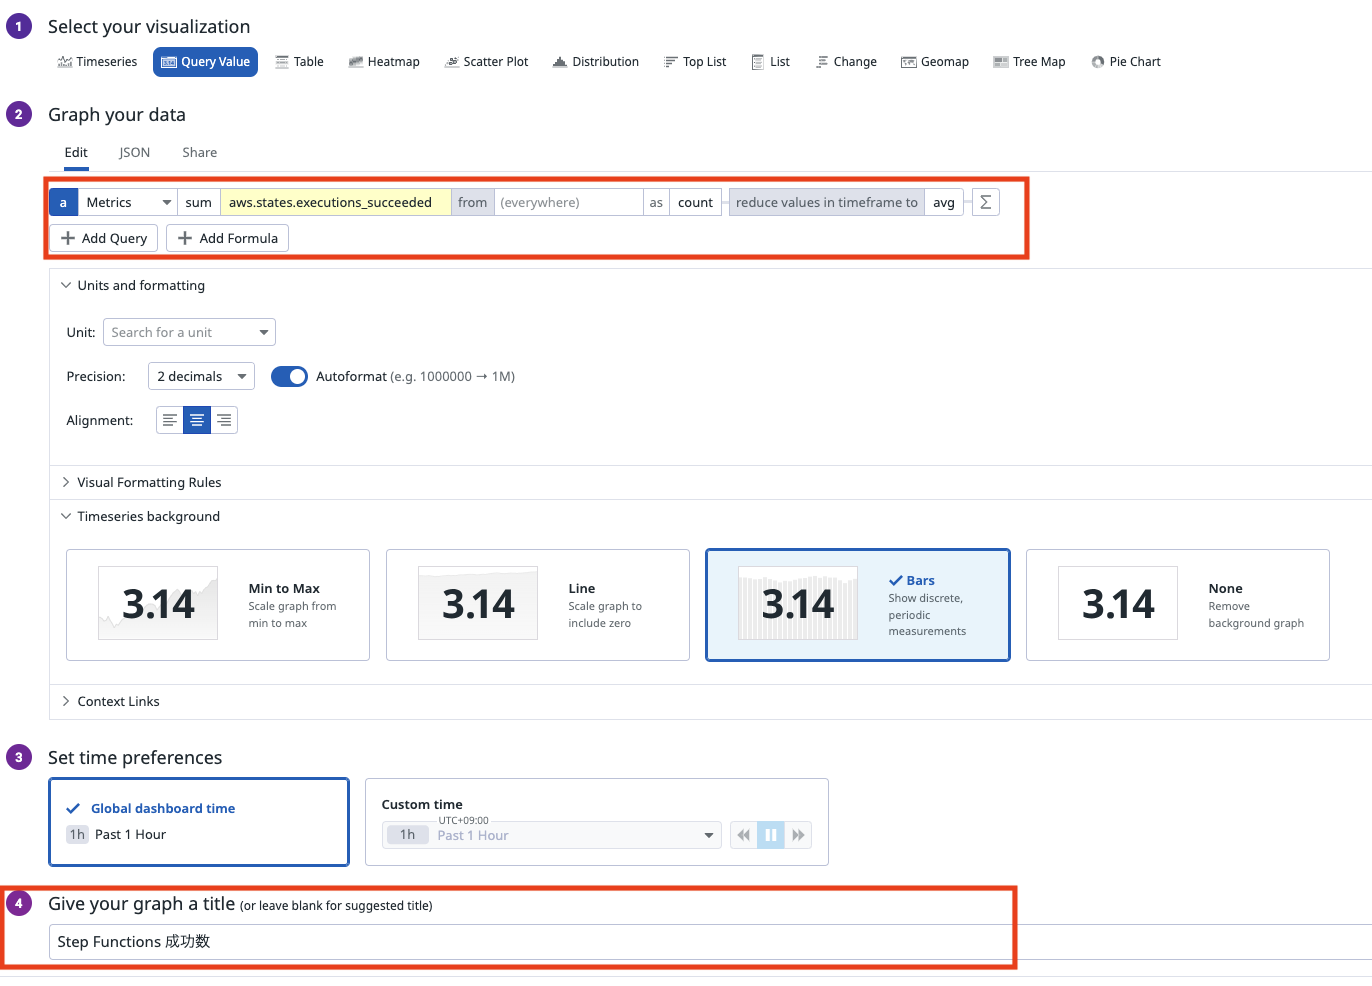
Query Value
- 「Add Widgets」をクリックします
- 「Query Value」を選択します
- 下記を指定し、「Save」をクリックします
- sum:aws.states.executions_succeeded as count
- タイトル
Timeseries
- 「Add Widgets」をクリックします
- 「Timeseries」を選択します
- 下記を指定し、「Save」をクリックします
- aws.states.executions_started sum by statemachinearn as count
- aws.states.executions_succeeded sum by statemachinearn as count
- aws.states.executions_failed sum by statemachinearn as count
- display: Areas
- タイトル

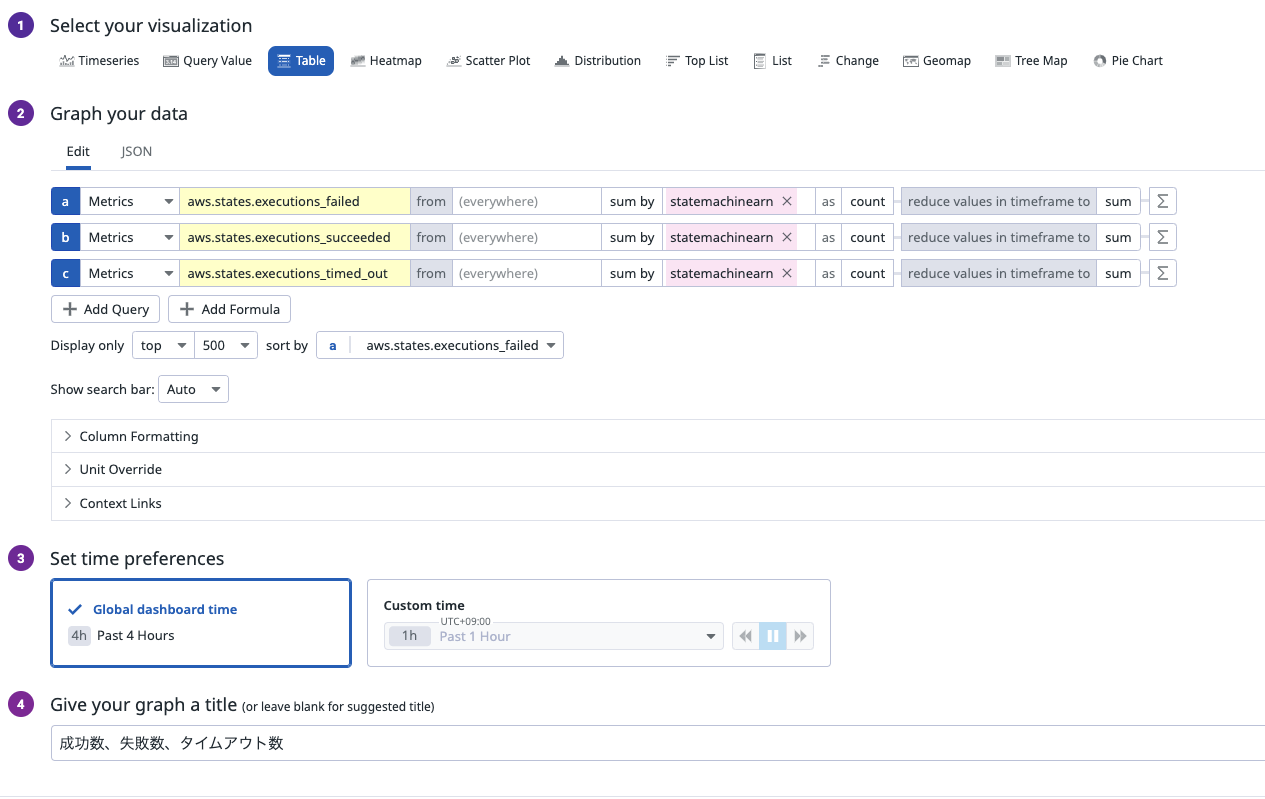
Table
- 「Add Widgets」をクリックします
- 「Table」を選択します
- 下記を指定し、「Save」をクリックします
- aws.states.executions_started sum by statemachinearn as count
- aws.states.executions_succeeded sum by statemachinearn as count
- aws.states.executions_failed sum by statemachinearn as count
- タイトル
ダッシュボード
- できました

考察
今回は、Step FunctionsのCloudWatchメトリクスを使って、Datadogでダッシュボードを作成してみました。
次回は、複数のStep Functionsを組み合わせて進捗管理をどう可視化できるか、試してみたいと思います。
参考