vico ver 1.13.1
準備
まずVicoの公式ページのGetting startedを見ながら依存関係にvicoを追加する。
Getting started
dependencies {
    // For Jetpack Compose.
    implementation("com.patrykandpatrick.vico:compose:1.13.1")

    // For `compose`. Creates a `ChartStyle` based on an M2 Material Theme.
    implementation("com.patrykandpatrick.vico:compose-m2:1.13.1")

    // For `compose`. Creates a `ChartStyle` based on an M3 Material Theme.
    implementation("com.patrykandpatrick.vico:compose-m3:1.13.1")

    // Houses the core logic for charts and other elements. Included in all other modules.
    implementation("com.patrykandpatrick.vico:core:1.13.1")

    // For the view system.
    implementation("com.patrykandpatrick.vico:views:1.13.1")
}
作成
まずは、最低限のグラフ
@Composable
fun GraphScreen() {
    val chartEntryModel = entryModelOf(5f, 3f, 4f, 2f, 1f)
    Column(
        modifier = Modifier.fillMaxSize(),
        verticalArrangement = Arrangement.Center
    ) {
        Chart(
            chart = lineChart(),
            model = chartEntryModel,
        )
    }
}
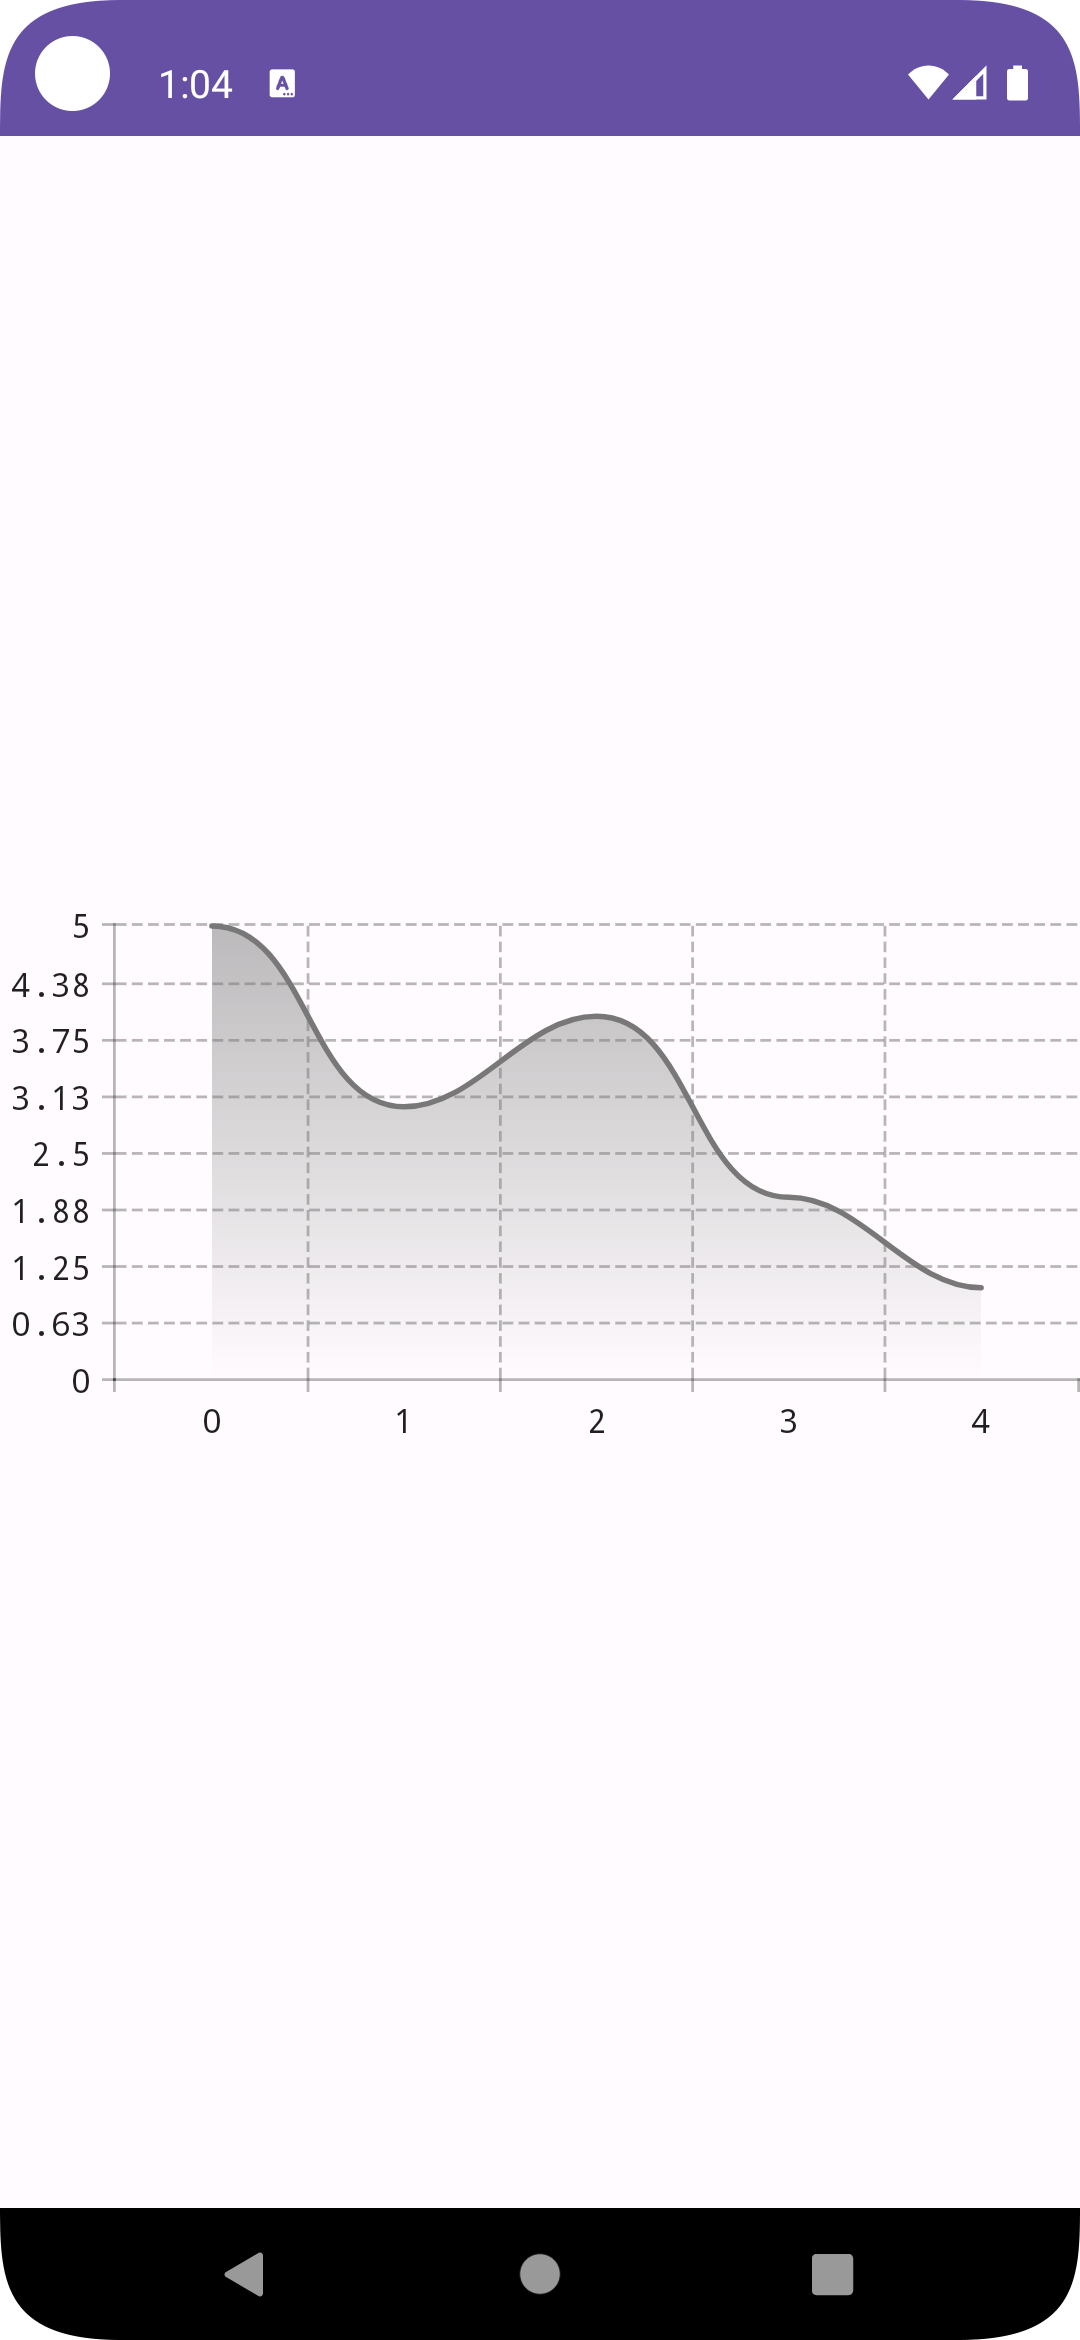
次はX軸とY軸を追加してみます。
@Composable
fun GraphScreen() {
    val chartEntryModel = entryModelOf(5f, 3f, 4f, 2f, 1f)
    Column(
        modifier = Modifier.fillMaxSize(),
        verticalArrangement = Arrangement.Center
    ) {
        Chart(
            chart = lineChart(),
            model = chartEntryModel,
            startAxis = rememberStartAxis(),
            bottomAxis = rememberBottomAxis(),
        )
    }
}

次はX軸をカスタマイズしてみます。
@Composable
fun GraphScreen() {
    val chartEntryModel = entryModelOf(5f, 3f, 4f, 2f, 1f)
    Column(
        modifier = Modifier.fillMaxSize(),
        verticalArrangement = Arrangement.Center
    ) {
        Chart(
            chart = lineChart(),
            model = chartEntryModel,
            startAxis = rememberStartAxis(),
            bottomAxis = rememberBottomAxis(
                title = "日付",
                titleComponent = TextComponent.Builder().build(),
                valueFormatter = { value, _ ->
                    val date = LocalDate.now().plusDays(value.toLong())
                    DateTimeFormatter.ofPattern("MM月dd日").format(date)
                }
            ),
        )
    }
}

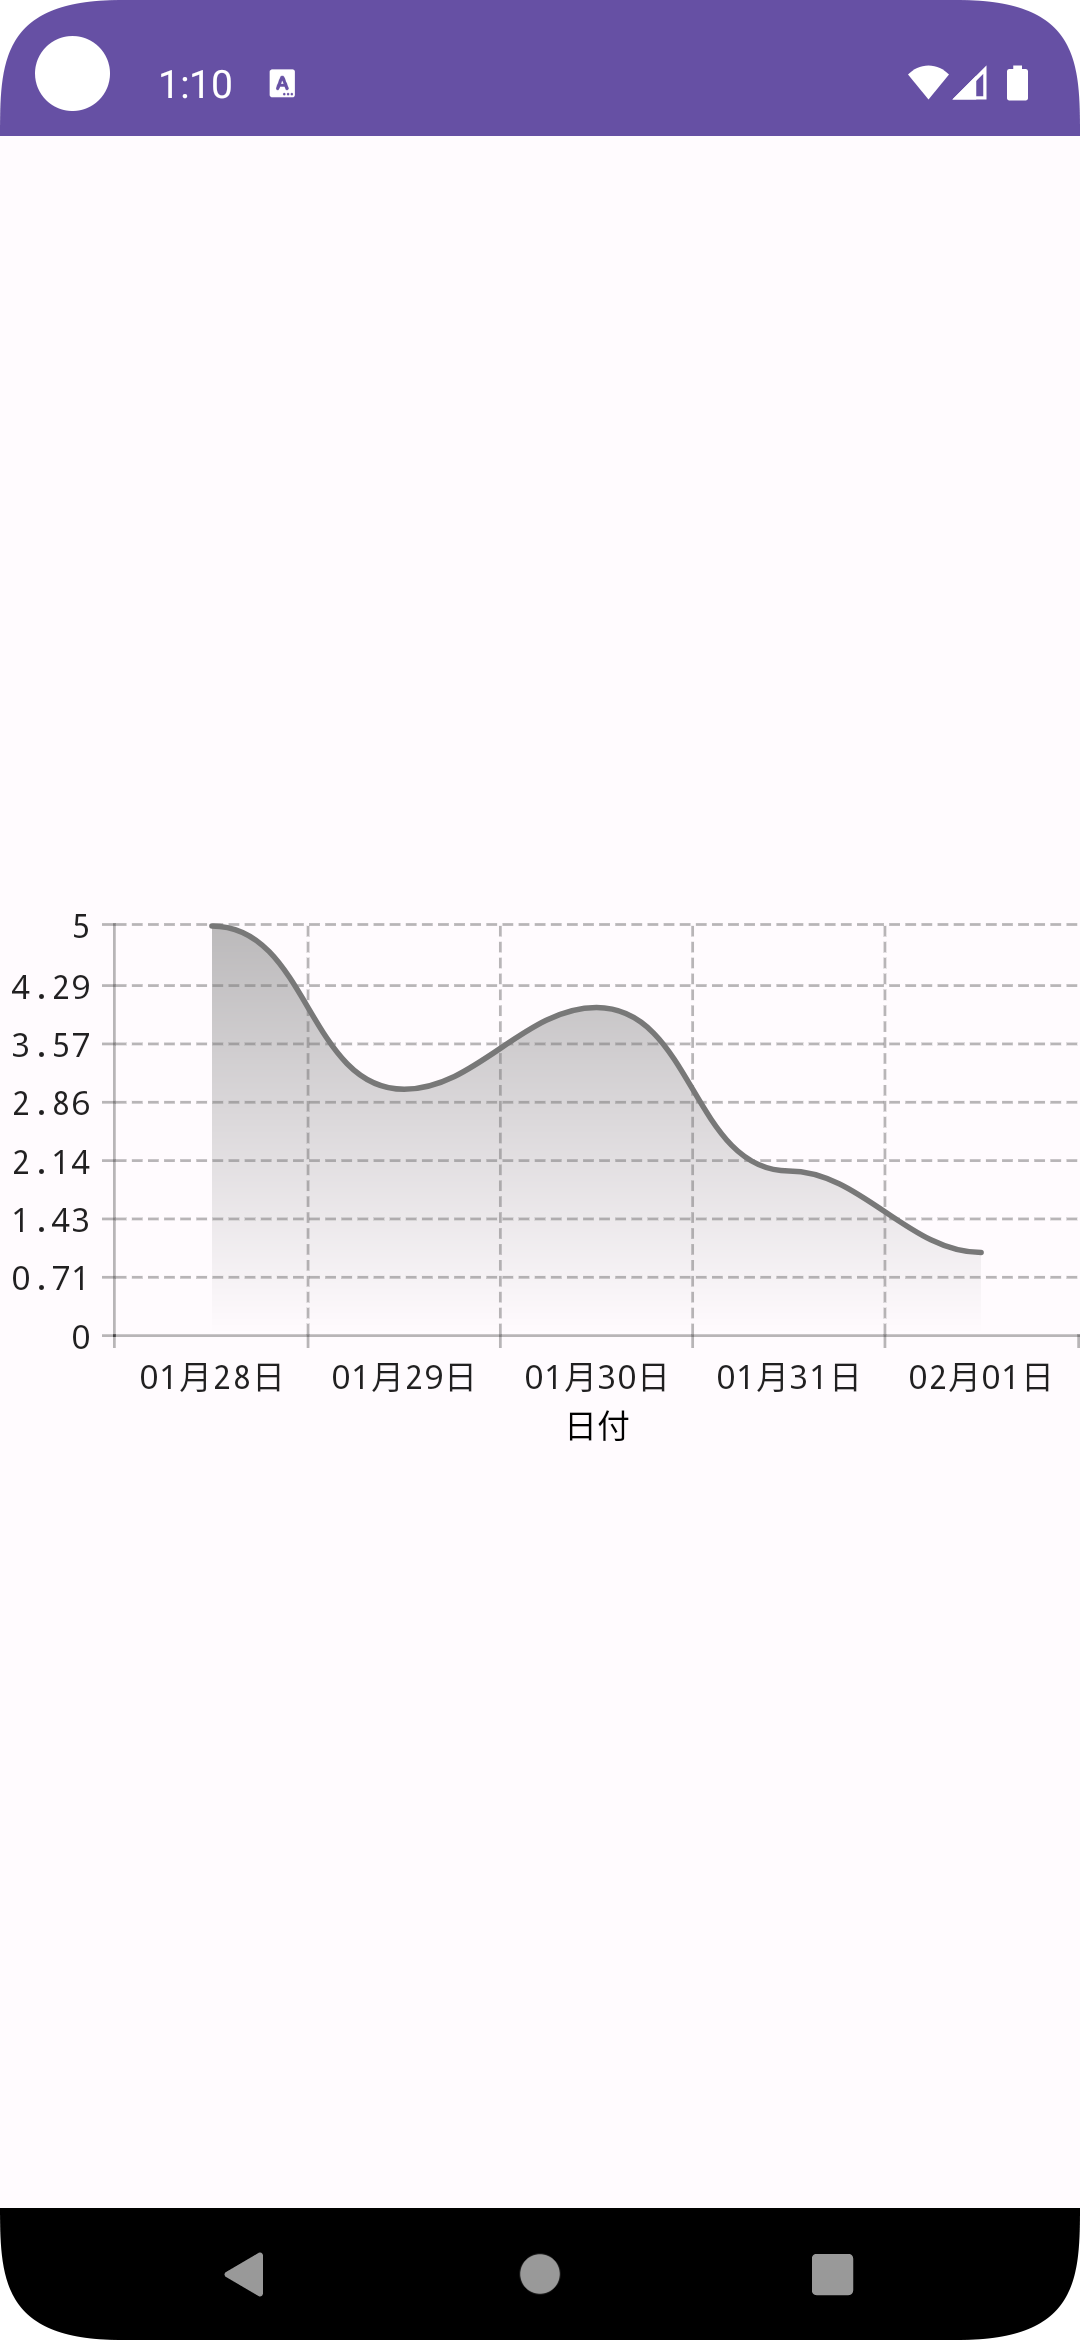
変わったのはbootomAxisの指定です。
まず、titleとtitleComponentを指定する事で軸のタイトルを表示しています。
ここで注意なのが、titleだけしてしても軸のタイトルは表示されないという事です。しっかりtitleとtitleComponentの両方を指定しましょう。
title = "日付",
titleComponent = TextComponent.Builder().build(),
次にvalueFormatterを指定して軸の値の表示をカスタムしています。
ここでは、日付に変換していますが、返す値を変更する事で様々な表示ができます。
valueFormatter = { value, _ ->
                    val date = LocalDate.now().plusDays(value.toLong())
                    DateTimeFormatter.ofPattern("MM月dd日").format(date)
                }
