趣旨
前回の記事はこちら。
【ggplot2】 コロナウイルスの感染者数を都道府県別に可視化してみた。 - Qiita
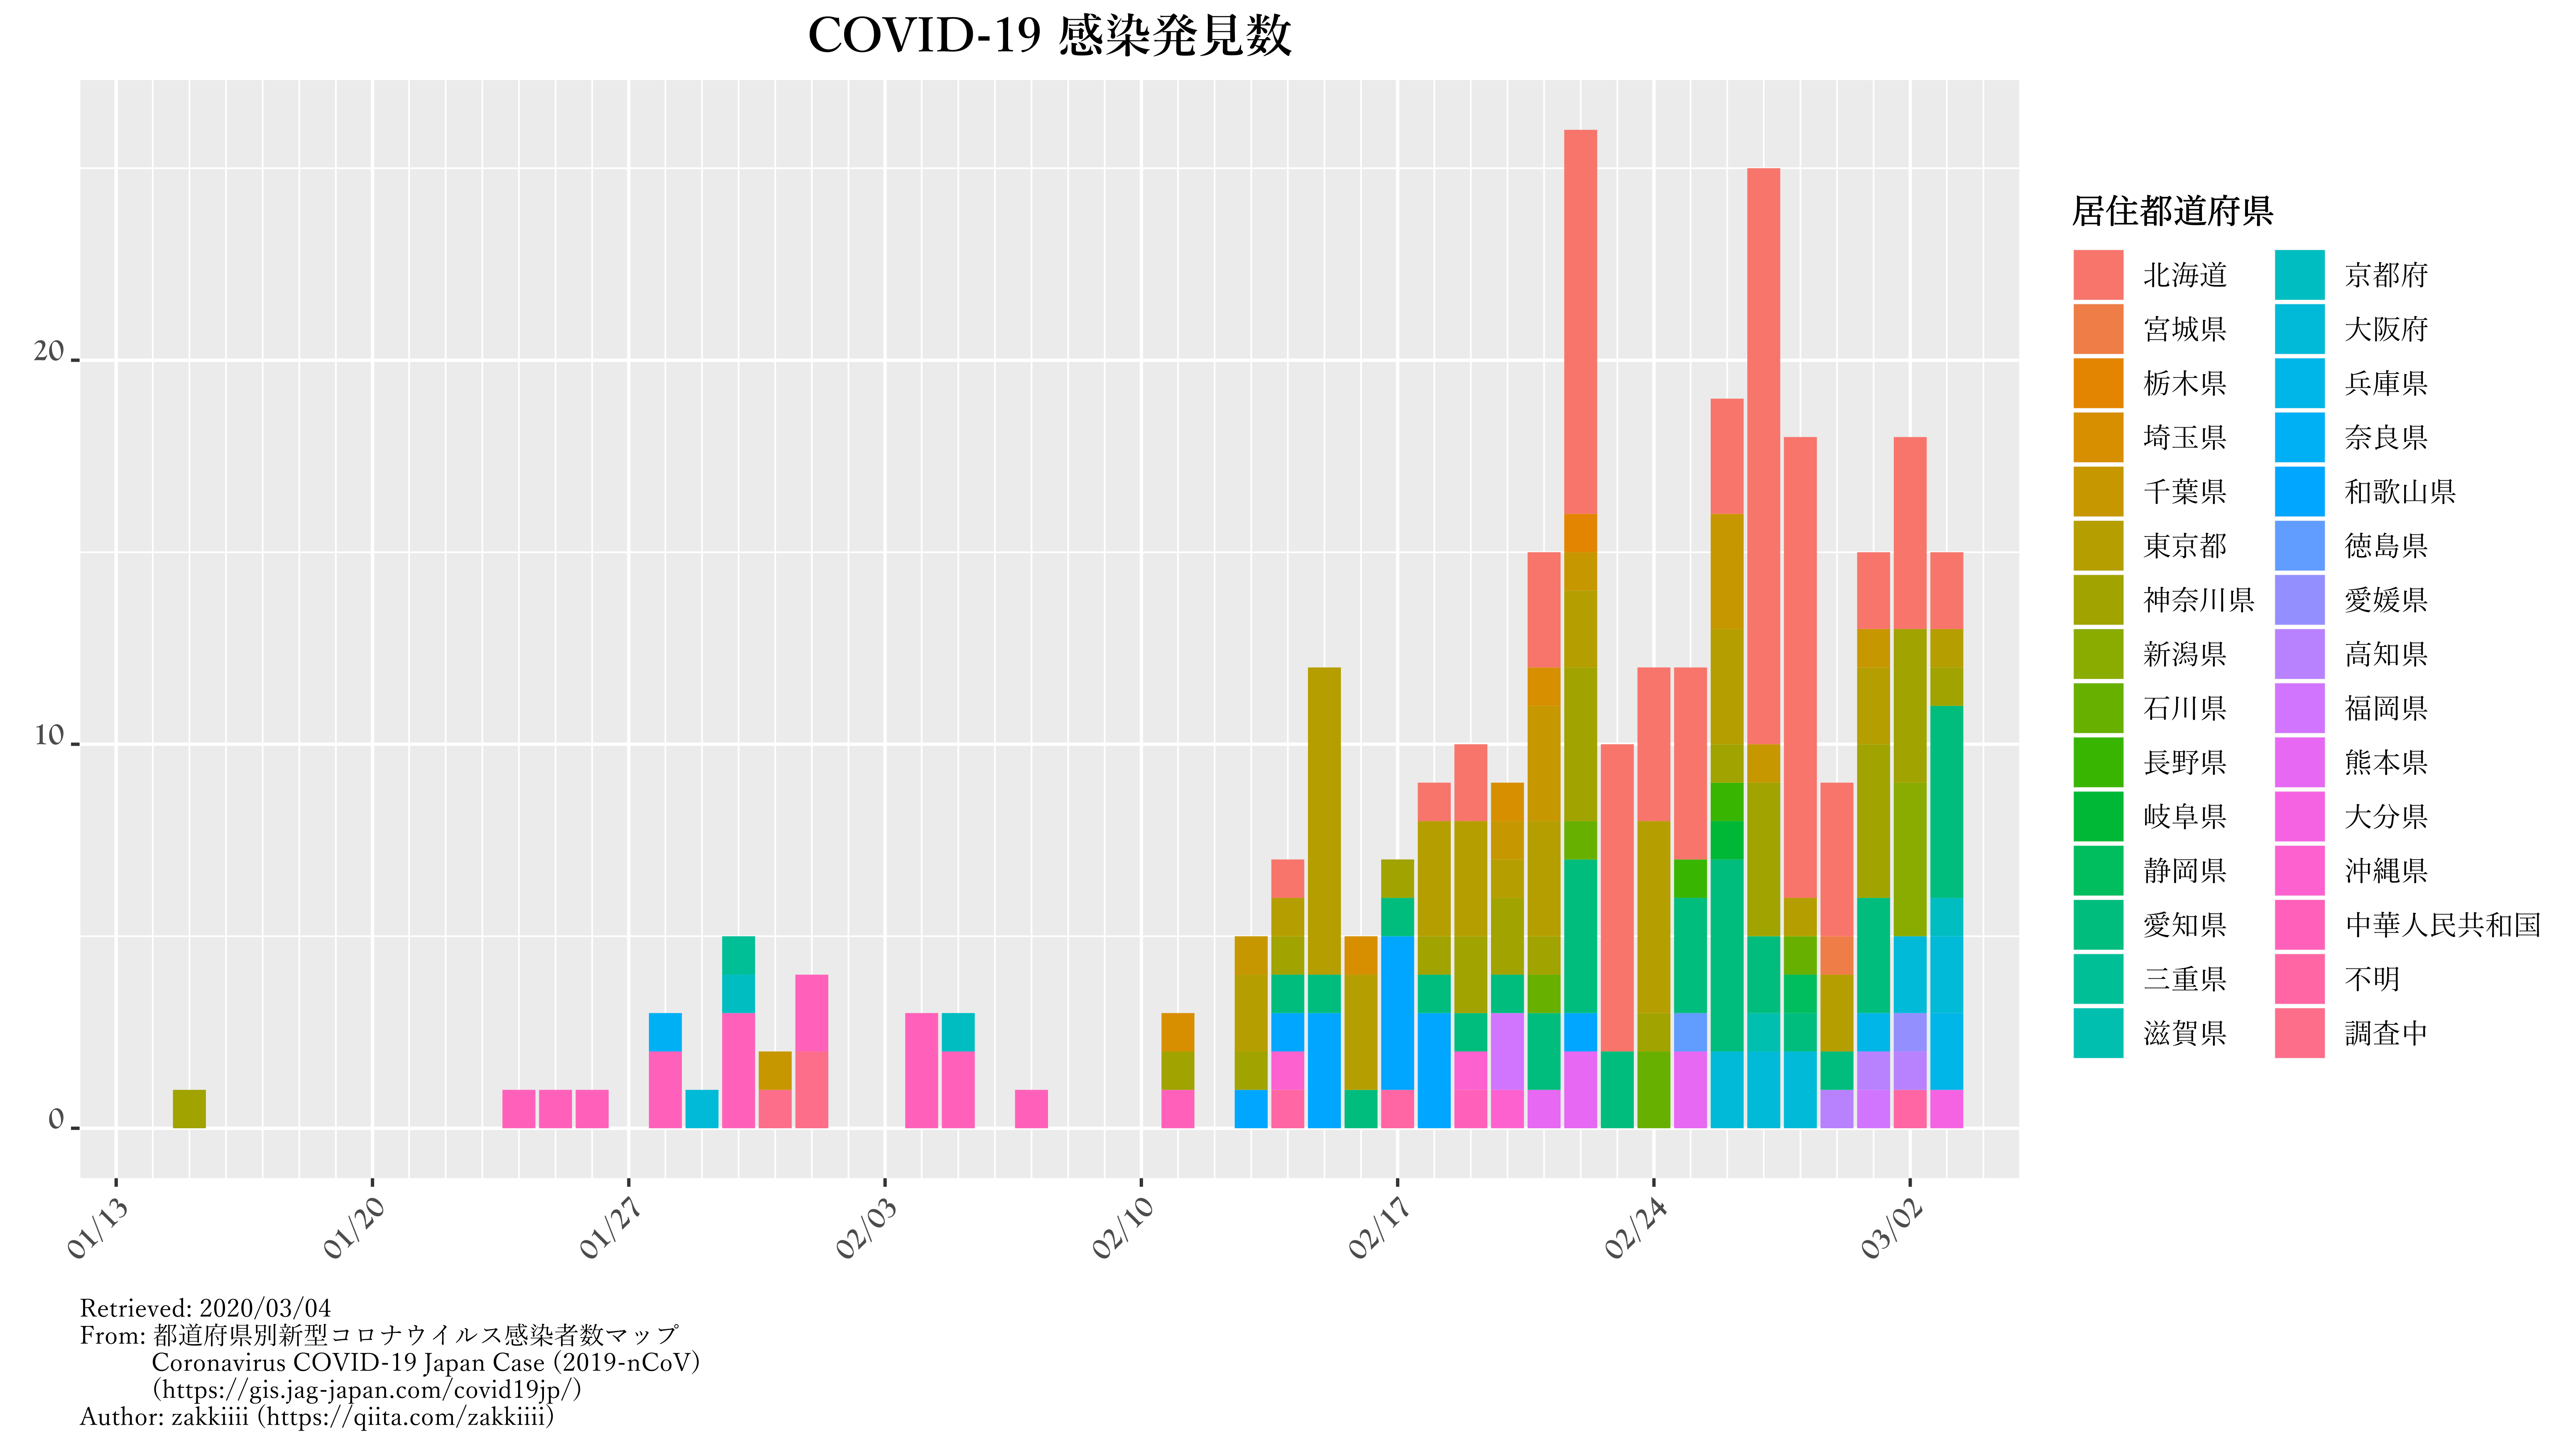
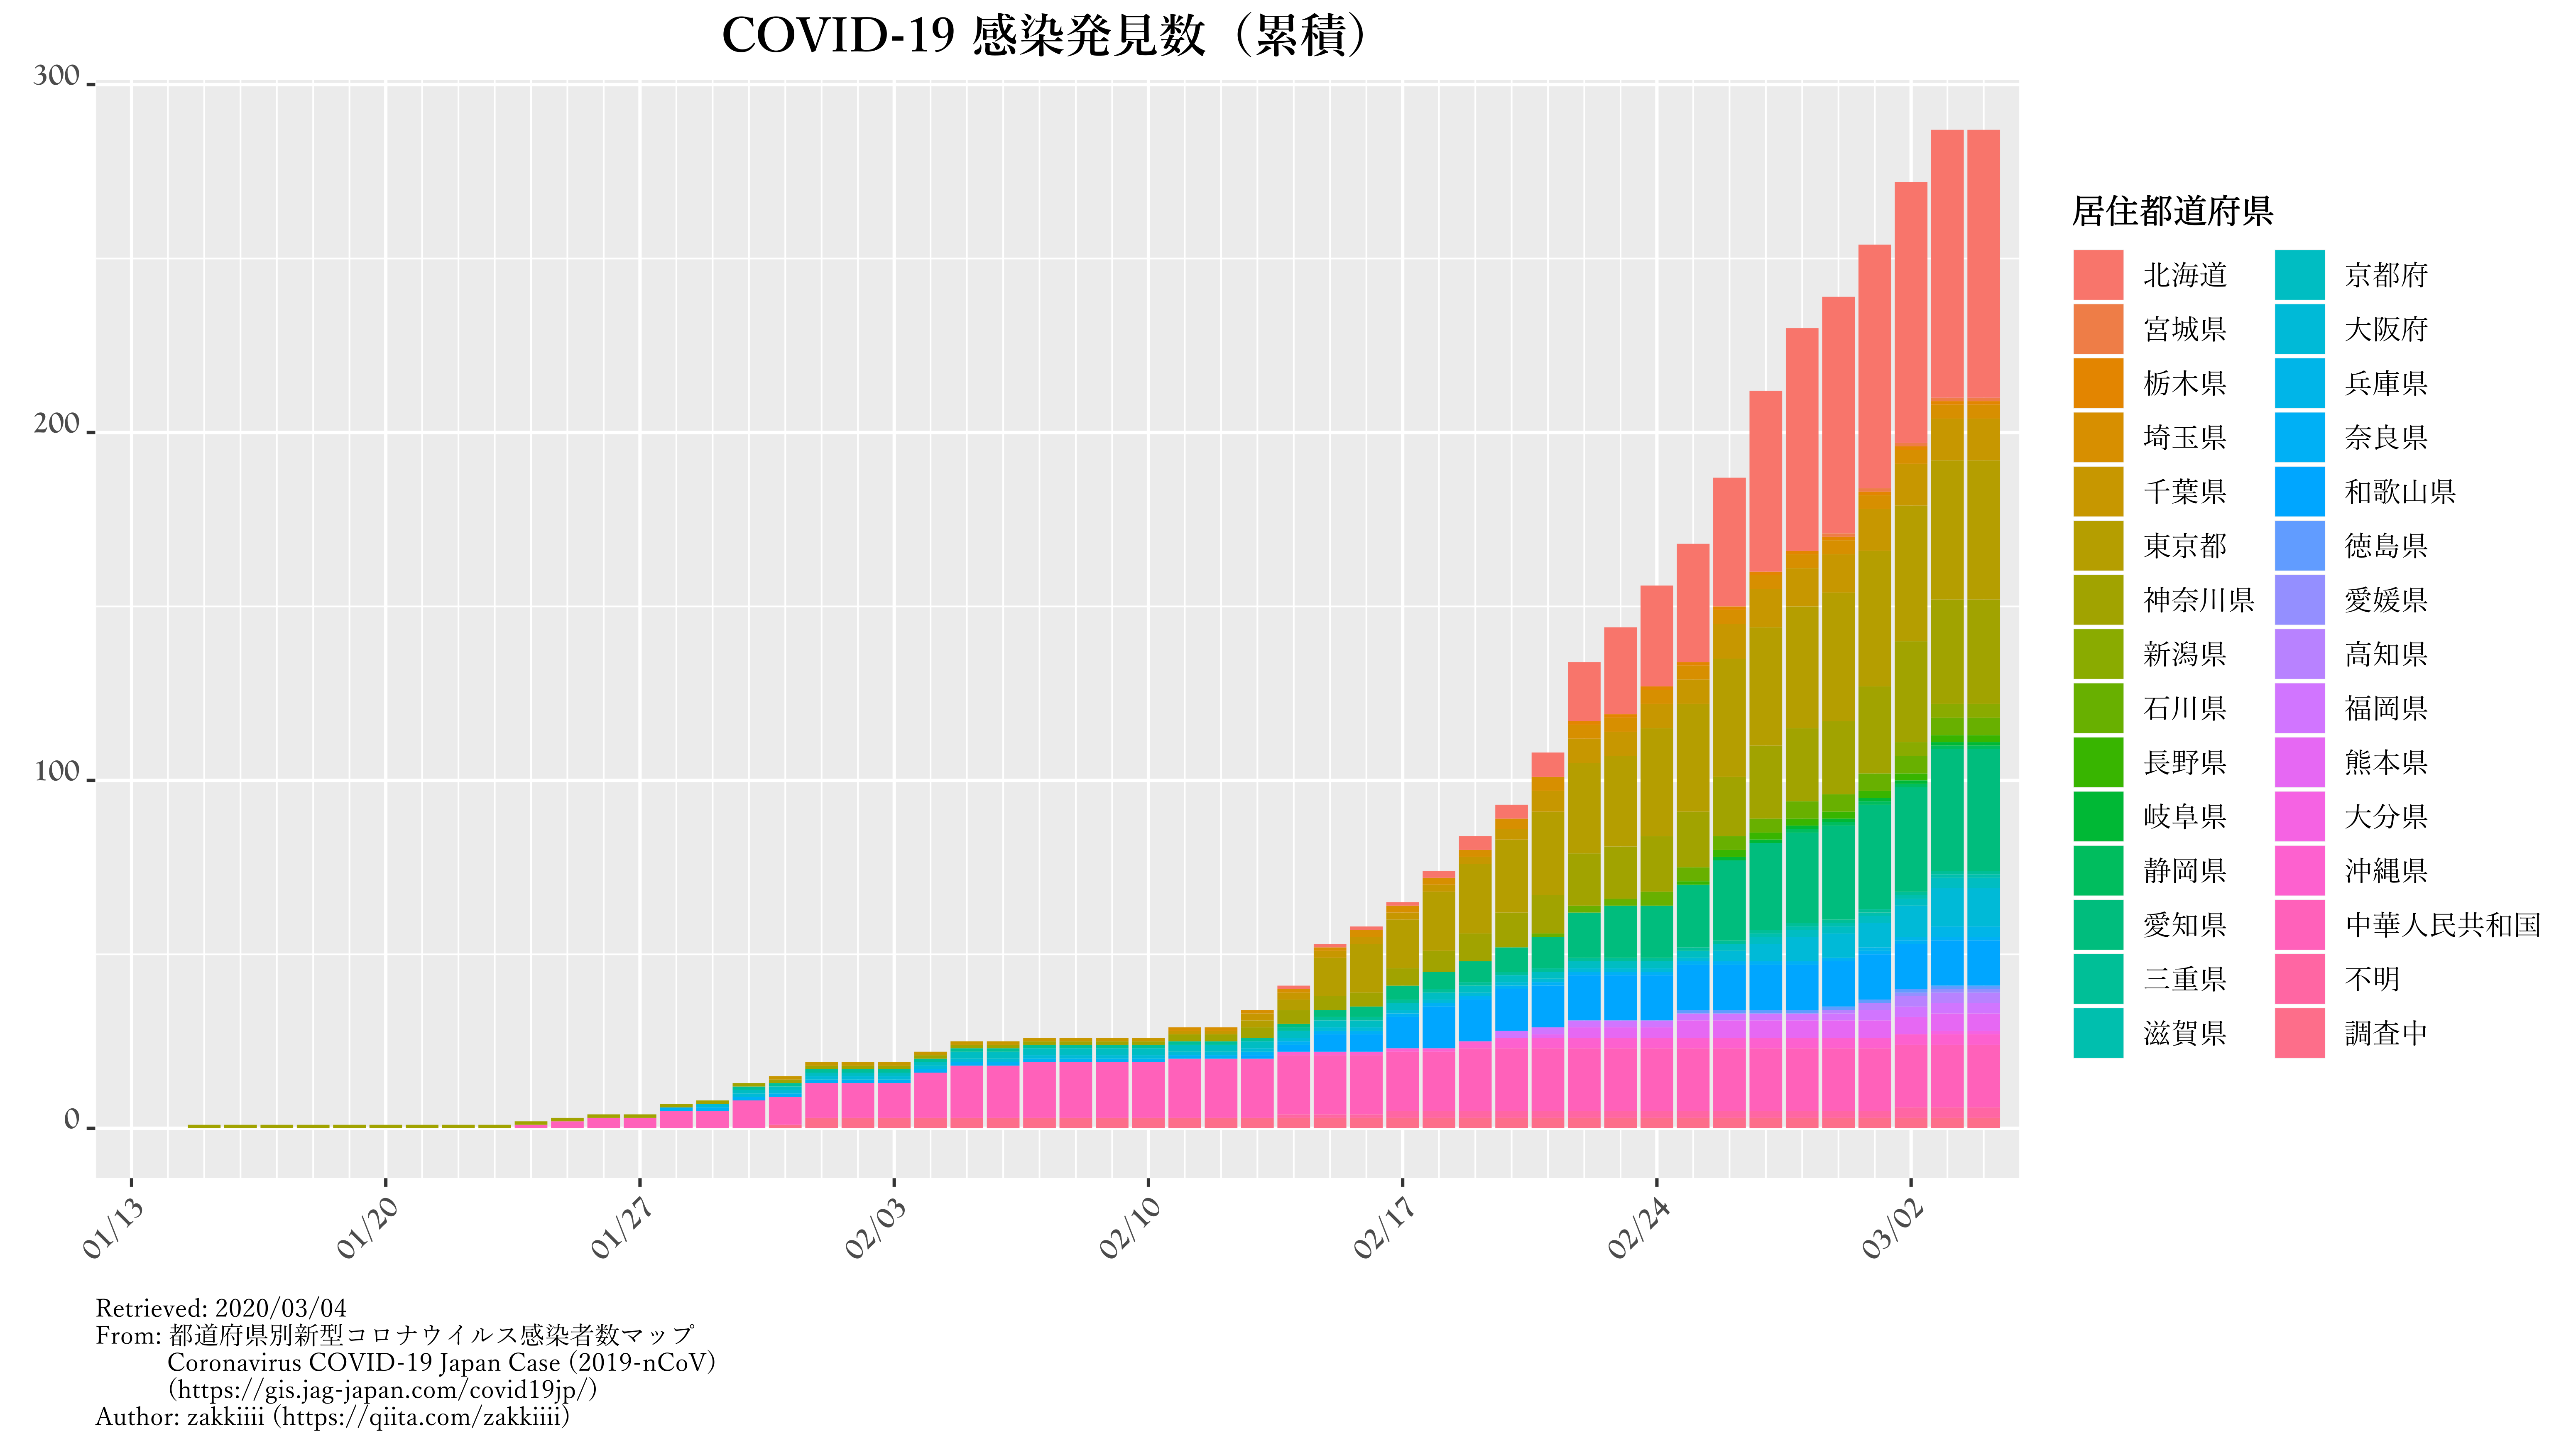
今回は元データをさらに加工して、時系列変化をグラフに起こして可視化してみます。
ついでにパネルデータも作っちゃいましょう。
出来上がったグラフたち
パネルデータ
都道府県を観察単位としてます。
全体のパネルデータ
> pref.Panel[48:58,]
# A tibble: 11 x 3
   確定日     居住都道府県     n
   <date>     <fct>        <dbl>
 1 2020-02-26 北海道           3
 2 2020-02-27 北海道          15
 3 2020-02-28 北海道          12
 4 2020-02-29 北海道           4
 5 2020-03-01 北海道           2
 6 2020-03-02 北海道           5
 7 2020-03-03 北海道           2
 8 2020-03-04 北海道           0
 9 2020-01-10 青森県           0
10 2020-01-11 青森県           0
11 2020-01-12 青森県           0
累計感染者数 > 0の都道府県に限定
> p.plot[48:58,]
# A tibble: 11 x 4
   確定日     居住都道府県     n cumsum
   <date>     <fct>        <dbl>  <dbl>
 1 2020-02-26 北海道           3     37
 2 2020-02-27 北海道          15     52
 3 2020-02-28 北海道          12     64
 4 2020-02-29 北海道           4     68
 5 2020-03-01 北海道           2     70
 6 2020-03-02 北海道           5     75
 7 2020-03-03 北海道           2     77
 8 2020-03-04 北海道           0     77
 9 2020-01-10 宮城県           0      0
10 2020-01-11 宮城県           0      0
11 2020-01-12 宮城県           0      0
各都道府県のレコード
> pref.Panel.list$東京都[35:40,]
# A tibble: 6 x 3
  確定日     居住都道府県     n
  <date>     <fct>        <dbl>
1 2020-02-13 東京都           2
2 2020-02-14 東京都           1
3 2020-02-15 東京都           8
4 2020-02-16 東京都           3
5 2020-02-17 東京都           0
6 2020-02-18 東京都           3
コード
すごく長いです。
長いので分割しました。
コード内の主なオブジェクトの内容は下記の通りです。
| オブジェクト名 | 概要 |
|---|---|
pref.Panel |
パネルデータ(全都道府県) |
pref.Panel.list |
pref.Panelを都道府県別に分割したものpref.Panel$都道府県名で各地域のデータにアクセス可能 |
p.plot |
pref.Panelから累計感染者数0の都道府県を除外したもの |
kansen.graph.p |
発見数の推移・積み上げ棒グラフ |
kansen.graph.p.all |
発見数の推移・都道府県別 |
kansen.graph.p.c |
発見数の累計・積み上げ棒グラフ |
kansen.graph.p.c.all |
発見数の累計・都道府県別 |
# package required
options(encoding = "utf-8")
library(dplyr)
library(stringr)
library(readxl)
library(foreach)
library(extrafont)
library(rvg)
library(ggplot2)
library(readr)
# .CSV from https://gis.jag-japan.com/covid19jp/
# https://dl.dropboxusercontent.com/s/6mztoeb6xf78g5w/COVID-19.csv
COVID_19 <- readr::read_csv("dataset/COVID-19.csv")
cvd <- COVID_19[,c(1, 8, 10, 11, 16, 19, 20, 24, 25, 26)]
cvd$確定日 <- as.Date(cvd$確定日, "%m/%d/%y")
pref.data <- c("北海道","青森県","岩手県","宮城県", "秋田県",
               "山形県", "福島県", "茨城県", "栃木県", "群馬県",
               "埼玉県", "千葉県", "東京都", "神奈川県", "新潟県",
               "富山県", "石川県", "福井県", "山梨県", "長野県",
               "岐阜県", "静岡県", "愛知県", "三重県", "滋賀県",
               "京都府", "大阪府", "兵庫県", "奈良県", "和歌山県",
               "鳥取県", "島根県", "岡山県", "広島県", "山口県",
               "徳島県", "香川県", "愛媛県", "高知県", "福岡県",
               "佐賀県", "長崎県", "熊本県", "大分県", "宮崎県",
               "鹿児島県", "沖縄県", "中華人民共和国", "不明",
               "調査中")
pref.factor <- factor(pref.data, levels = pref.data)
cvd$居住都道府県 <- factor(cvd$居住都道府県, levels = pref.data)
cvd <- group_by(cvd, 居住都道府県)
kansen.n <- summarize(cvd, n = n())
kansen.n <- full_join(data.frame(居住都道府県 = pref.factor), kansen.n, by = "居住都道府県")
kansen.n$n[is.na(kansen.n$n)] <- 0
# panel data create
pref.data.empty <- vector("list", length = length(pref.factor))
names(pref.data.empty) <- pref.factor

# edit split data
pref.split <- group_split(cvd)
names(pref.split) <- group_data(cvd)$居住都道府県
# bind
pref.data.full <- mapply(c, pref.data.empty[names(pref.data.empty)], pref.split[names(pref.data.empty)])
# emptyList making
epdf <- function(...){
  cb <- function(...){
    lst <- c(...)
    lst <- lapply(lst, as.matrix)
    lst <- c(lst, recursive = T, use.names = F)
    lst
  }
  alldata <- cb(...)
  colname <-   c(alldata, recursive = T, use.names = F)
  dtf <- data.frame(matrix(rep(NA,length(colname)), nrow = 1)[numeric(0),])
  names(dtf) <- colname
  dtf
}
# make empty pref. tibbles
eplst <- list(suppressWarnings(cvd[0,]))

# modifying empty pref.
pref.data.full[sapply(pref.data.full, is.null)] <- eplst
# make panels per pref.
pref.Panel.list <- foreach(n = 1:length(pref.data.full)) %do% {
  x <- as_tibble(pref.data.full[[n]])
  x <- group_by(x, 確定日)
  pref.found <- summarize(x, n = n())
  pref.days <- data.frame(確定日 = seq(as.Date("2020-01-10"), Sys.Date(), by = "days"), 居住都道府県 = factor(names(pref.data.full)[[n]], levels = levels(pref.factor)))
  pref.found <- full_join(pref.days, pref.found, by = "確定日")
  pref.found[is.na(pref.found)] <- 0
  as_tibble(pref.found)
}
names(pref.Panel.list) <- levels(pref.factor)
pref.Panel <- bind_rows(pref.Panel.list)


# pref. data visualize
# 発生件数0の都道府県を除外
p.plot <- group_by(pref.Panel, 居住都道府県) %>% dplyr::filter(., sum(n)>0) %>% ungroup()
p.plot <-  mutate(group_by(p.plot, 居住都道府県), cumsum = cumsum(n)) %>% ungroup()
kansen.graph.p <- ggplot(p.plot, aes(y = n,
                                     x = 確定日,
                                     fill = 居住都道府県))+
  geom_bar(stat = "identity")+
  ggtitle("COVID-19 感染発見数") +
  labs(caption = paste("Retrieved: 2020/03/04 \nFrom: 都道府県別新型コロナウイルス感染者数マップ \n           Coronavirus COVID-19 Japan Case (2019-nCoV)\n           (https://gis.jag-japan.com/covid19jp/)\nAuthor: zakkiiii (https://qiita.com/zakkiiii)"),
       x = element_blank(),
       y = element_blank(),
       fill = "居住都道府県")+
  scale_x_date(date_labels = "%m/%d",
               date_breaks = "week",
               date_minor_breaks = "days",
               limits = c(as.Date(min(dplyr::filter(p.plot, n>0)$確定日) - 3), as.Date(max(p.plot$確定日)+1)),
               expand = c(0,0))+
  theme(plot.title = element_text(family = "Yu Mincho Demibold",
                                  size = 15,
                                  hjust = 0.5),
        axis.text.x = element_text(angle = 45,
                                   hjust = 1,
                                   family = "Goudy Old Style",
                                   face = "bold",
                                   size = 10),
        axis.text.y = element_text(vjust = 0,
                                   family = "Goudy Old Style",
                                   face = "bold",
                                   size = 10),
        axis.title.x = element_text(family = "Yu Mincho",
                                    size = 11,
                                    vjust = 0,
                                    face = "bold"),
        axis.title.y = element_text(family = "Yu Mincho",
                                    size = 11,
                                    vjust = 1,
                                    face = "bold"),
        legend.text = element_text(family = "Yu Mincho",
                                   size = 9),
        legend.title = element_text(family = "Yu Mincho",
                                    size = 11,
                                    vjust = 1,
                                    face = "bold"),
        plot.caption  = element_text(family = "Yu Mincho", size = 8, hjust = 0))
svg(file = "kansen_p.svg", width = 16/1.4, height = 9/1.4, bg = "white")
kansen.graph.p
dev.off()


# 累計
kansen.graph.p.c <- ggplot(p.plot, aes(y = cumsum,
                                       x = 確定日,
                                       fill = 居住都道府県))+
  geom_bar(stat = "identity")+
  ggtitle("COVID-19 感染発見数(累積)") +
  labs(caption = paste("Retrieved: 2020/03/04 \nFrom: 都道府県別新型コロナウイルス感染者数マップ \n           Coronavirus COVID-19 Japan Case (2019-nCoV)\n           (https://gis.jag-japan.com/covid19jp/)\nAuthor: zakkiiii (https://qiita.com/zakkiiii)"),
       x = element_blank(),
       y = element_blank(),
       fill = "居住都道府県")+
  scale_x_date(date_labels = "%m/%d",
               date_breaks = "week",
               date_minor_breaks = "days",
               limits = c(as.Date(min(dplyr::filter(p.plot, n>0)$確定日) - 3), as.Date(max(p.plot$確定日)+1)),
               expand = c(0,0))+
  theme(plot.title = element_text(family = "Yu Mincho Demibold",
                                  size = 15,
                                  hjust = 0.5),
        axis.text.x = element_text(angle = 45,
                                   hjust = 1,
                                   family = "Goudy Old Style",
                                   face = "bold",
                                   size = 10),
        axis.text.y = element_text(vjust = 0,
                                   family = "Goudy Old Style",
                                   face = "bold",
                                   size = 10),
        axis.title.x = element_text(family = "Yu Mincho",
                                    size = 11,
                                    vjust = 0,
                                    face = "bold"),
        axis.title.y = element_text(family = "Yu Mincho",
                                    size = 11,
                                    vjust = 1,
                                    face = "bold"),
        legend.text = element_text(family = "Yu Mincho",
                                   size = 9),
        legend.title = element_text(family = "Yu Mincho",
                                    size = 11,
                                    vjust = 1,
                                    face = "bold"),
        plot.caption  = element_text(family = "Yu Mincho", size = 8, hjust = 0))
svg(file = "kansen_p_c.svg", width = 16/1.4, height = 9/1.4, bg = "white")
kansen.graph.p.c
dev.off()
# PANEL
kansen.graph.p.all <- ggplot(p.plot, aes(y = n,
                                         x = 確定日,
                                         fill = 居住都道府県,
                                         group = 居住都道府県))+
  geom_bar(stat = "identity")+
  ggtitle("居住都道府県別 COVID-19 感染発見数") +
  labs(caption = paste("Retrieved: 2020/03/04 \nFrom: 都道府県別新型コロナウイルス感染者数マップ \n           Coronavirus COVID-19 Japan Case (2019-nCoV)\n           (https://gis.jag-japan.com/covid19jp/)\nAuthor: zakkiiii (https://qiita.com/zakkiiii)"),
       x = element_blank(),
       y = element_blank(),
       fill = "居住都道府県")+
  scale_x_date(date_labels = "%m/%d",
               date_breaks = "2 weeks",
               date_minor_breaks = "week",
               limits = c(as.Date(min(dplyr::filter(p.plot, n>0)$確定日) - 3), as.Date(max(p.plot$確定日)+1)),
               expand = c(0,0))+
  theme(plot.title = element_text(family = "Yu Mincho Demibold",
                                  size = 15,
                                  hjust = 0.5),
        axis.text.x = element_text(angle = 45,
                                   hjust = 1,
                                   family = "Goudy Old Style",
                                   face = "bold",
                                   size = 10),
        axis.text.y = element_text(vjust = 0,
                                   family = "Goudy Old Style",
                                   face = "bold",
                                   size = 10),
        axis.title.x = element_text(family = "Yu Mincho",
                                    size = 11,
                                    vjust = 0,
                                    face = "bold"),
        axis.title.y = element_text(family = "Yu Mincho",
                                    size = 11,
                                    vjust = 1,
                                    face = "bold"),
        legend.text = element_text(family = "Yu Mincho",
                                   size = 9),
        legend.title = element_text(family = "Yu Mincho",
                                    size = 11,
                                    vjust = 1,
                                    face = "bold"),
        strip.text.x = element_text(family = "Yu Mincho"),
        plot.caption  = element_text(family = "Yu Mincho", size = 8, hjust = 0))+
  theme(legend.position="none")+
  facet_wrap(~ 居住都道府県, ncol=2)
svg(file = "kansen_p_all.svg", width = 10*1.2, height = 32*1.2, bg = "white")
kansen.graph.p.all
dev.off()


# PANEL累計
kansen.graph.p.c.all <- ggplot(p.plot, aes(y = cumsum,
                                         x = 確定日,
                                         fill = 居住都道府県,
                                         group = 居住都道府県))+
  geom_bar(stat = "identity")+
  ggtitle("居住都道府県別 COVID-19 感染発見数(累積)") +
  labs(caption = paste("Retrieved: 2020/03/04 \nFrom: 都道府県別新型コロナウイルス感染者数マップ \n           Coronavirus COVID-19 Japan Case (2019-nCoV)\n           (https://gis.jag-japan.com/covid19jp/)\nAuthor: zakkiiii (https://qiita.com/zakkiiii)"),
       x = element_blank(),
       y = element_blank(),
       fill = "居住都道府県")+
  scale_x_date(date_labels = "%m/%d",
               date_breaks = "2 weeks",
               date_minor_breaks = "week",
               limits = c(as.Date(min(dplyr::filter(p.plot, n>0)$確定日) - 3), as.Date(max(p.plot$確定日)+1)),
               expand = c(0,0))+
  theme(plot.title = element_text(family = "Yu Mincho Demibold",
                                  size = 15,
                                  hjust = 0.5),
        axis.text.x = element_text(angle = 45,
                                   hjust = 1,
                                   family = "Goudy Old Style",
                                   face = "bold",
                                   size = 10),
        axis.text.y = element_text(vjust = 0,
                                   family = "Goudy Old Style",
                                   face = "bold",
                                   size = 10),
        axis.title.x = element_text(family = "Yu Mincho",
                                    size = 11,
                                    vjust = 0,
                                    face = "bold"),
        axis.title.y = element_text(family = "Yu Mincho",
                                    size = 11,
                                    vjust = 1,
                                    face = "bold"),
        legend.text = element_text(family = "Yu Mincho",
                                   size = 9),
        legend.title = element_text(family = "Yu Mincho",
                                    size = 11,
                                    vjust = 1,
                                    face = "bold"),
        strip.text.x = element_text(family = "Yu Mincho"),
        plot.caption  = element_text(family = "Yu Mincho", size = 8, hjust = 0))+
  theme(legend.position="none")+
  facet_wrap(~ 居住都道府県, ncol=2)
svg(file = "kansen_p_c_all.svg", width = 10*1.2, height = 32*1.2, bg = "white")
kansen.graph.p.c.all
dev.off()
おわりに
めっちゃ大変でした。
圧倒的成長。
Enjoy!
おしまい。
参考文献
https://stackoverflow.com/questions/39257867/date-minor-breaks-in-ggplot2
https://stackoverflow.com/questions/45287010/plotting-order-for-ggplot-groups-with-repeated-factors
https://stackoverflow.com/questions/35618260/remove-legend-ggplot-2-2
http://sakananoiroiro.seesaa.net/article/452917978.html
https://community.rstudio.com/t/why-does-scale-x-date-create-labels-for-the-padded-area-too/3031/2
http://motw.mods.jp/R/ggplot_facet.html
http://bcl.sci.yamaguchi-u.ac.jp/~jun/notebook/r/tidyverse/dplyr/
https://datacarpentry.org/R-ecology-lesson/04-visualization-ggplot2.html
https://gis.jag-japan.com/covid19jp/


