本記事について
CNNを用いて,CIFAR-10でaccuracy95%を達成できたので,役にたった手法(テクニック)をまとめました.
CNNで精度を向上させる際の参考になれば幸いです.
本記事では,フレームワークとしてKerasを用いていますが,Kerasの使い方について詳しく説明することはありません.
Kerasの簡単な使い方に関しては,以下のリンクが参考になります.
https://qiita.com/iss-f/items/b12308b44376ba69ac6a
本記事で用いるコード・学習済みモデルは以下で公開しています.
バグ等があった場合はお知らせください.
https://github.com/yy1003/cifar10
準備
install
import numpy as np
import keras
from keras.models import  Model,load_model
from keras.layers import Dense,Dropout,Conv2D,MaxPooling2D,Input,GlobalAveragePooling2D,BatchNormalization
from keras.optimizers import Adam
from keras.preprocessing.image import ImageDataGenerator
from keras.callbacks import LearningRateScheduler
from keras.datasets import cifar10
from keras.utils.np_utils import to_categorical
import matplotlib.pyplot as plt
from sklearn.metrics import accuracy_score
import pickle
モデルの評価に用いる関数
以下の関数でモデルを評価します.
## modelの評価
def my_eval(model,x,t):
    ev = model.evaluate(x,t)
    print("loss:" ,end = " ")
    print(ev[0])
    print("acc: ", end = "")
    print(ev[1])
データの確認と成型
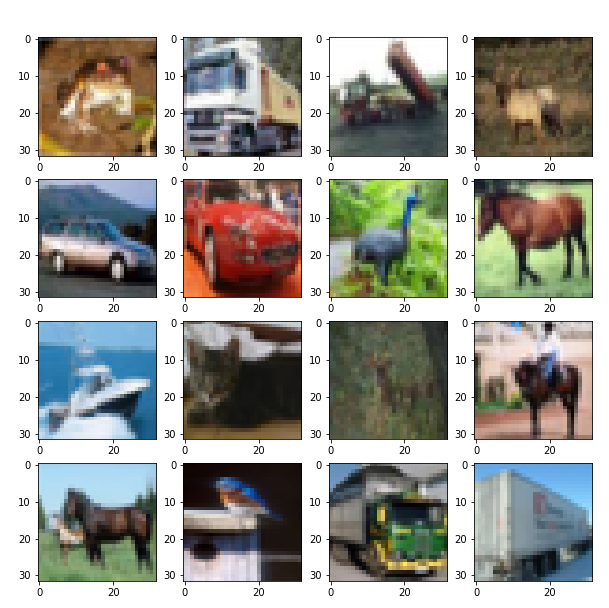
CIFAR-10は,32×32ピクセル,3チャネルからなるデータセットです.各画像に対しては,10種類のラベルのうち一つが割り振られています.
実際の画像例は以下のとおりです.
データをロードします.
ついでにラベルをone-hot表現に直し,画素値を正規化して,データを成型しておきます.
(x_train_raw, t_train_raw), (x_test_raw,t_test_raw) = cifar10.load_data()
t_train = to_categorical(t_train_raw)
t_test = to_categorical(t_test_raw)
x_train = x_train_raw / 255
x_test  = x_test_raw / 255
バッチサイズとエポック数
本記事では全ての学習をバッチサイズ500,エポック数150で学習を行います.
batch_size = 500
epochs = 150
steps_per_epoch = x_train.shape[0] // batch_size
validation_steps = x_test.shape[0] // batch_size
ベンチマーク
まずは,ベンチマークとして,以下の様に比較的規模の小さいCNNを用いてみます.
def create_bench_model():
    inputs = Input(shape = (32,32,3))
    x = Conv2D(64,(3,3),padding = "SAME",activation= "relu")(inputs)
    x = Conv2D(64,(3,3),padding = "SAME",activation= "relu")(x)
    x = Dropout(0.25)(x)
    x = MaxPooling2D()(x)

    x = Conv2D(128,(3,3),padding = "SAME",activation= "relu")(x)
    x = Conv2D(128,(3,3),padding = "SAME",activation= "relu")(x)
    x = Dropout(0.25)(x)
    x = MaxPooling2D()(x)

    x = Conv2D(256,(3,3),padding = "SAME",activation= "relu")(x)
    x = Conv2D(256,(3,3),padding = "SAME",activation= "relu")(x)
    x = GlobalAveragePooling2D()(x)

    x = Dense(1024,activation = "relu")(x)
    x = Dropout(0.25)(x)
    y = Dense(10,activation = "softmax")(x)

    return Model(input = inputs, output = y)
model = create_bench_model()
model.compile(loss = "categorical_crossentropy",optimizer = Adam(), metrics = ["accuracy"])
train_gen = ImageDataGenerator().flow(x_train,t_train, batch_size )
val_gen = ImageDataGenerator().flow(x_test,t_test, batch_size)
history = model.fit_generator(train_gen, epochs=epochs, steps_per_epoch = steps_per_epoch,\
                          validation_data = val_gen, validation_steps =validation_steps)

my_eval(model,x_test,t_test)
10000/10000 [==============================] - 2s 172us/step
loss: 0.8592279056429863
acc: 0.8439
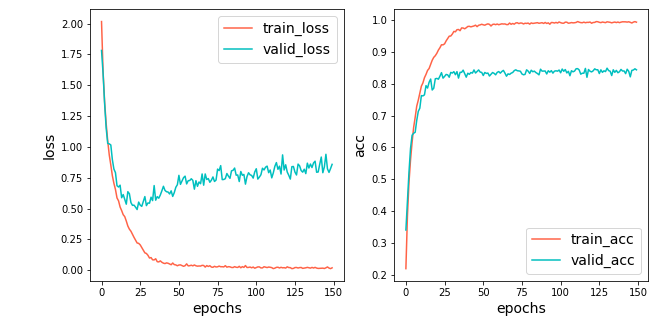
赤線がtrain,青線がvalidです.
accuracyは,84.39%とまずまずの値が出ています.
しかし,25epoch目以降では,validでのlossが悪化し続けていて,過学習が起きていることが分かります.
trainとvalidのaccuracyの開きも大きいです.
Data Augmentation
Data Augmentationは,訓練画像に変換を加えることでデータを水増しし,汎化性能を向上させる手法です.
KerasでのData Augmentationを用いた学習については,公式ドキュメントが参考になります.
https://keras.io/ja/preprocessing/image/
どのような画像が生成されるかについては,以下のリンクが詳しいです.
https://qiita.com/takurooo/items/c06365dd43914c253240
先ほどのモデル構造はそのままで,Data Augmentationを行い汎化性能を向上させることで,精度向上を狙います.
def da_generator():
    return ImageDataGenerator(rotation_range = 20, horizontal_flip = True, height_shift_range = 0.2,\
                                width_shift_range = 0.2,zoom_range = 0.2, channel_shift_range = 0.2
                                ).flow(x_train,t_train, batch_size )
model = create_bench_model()
model.compile(loss = "categorical_crossentropy",optimizer = Adam(), metrics = ["accuracy"])
val_gen = ImageDataGenerator().flow(x_test,t_test, batch_size)
history = model.fit_generator(da_generator(), epochs=epochs, steps_per_epoch = steps_per_epoch,\
                          validation_data = val_gen, validation_steps = validation_steps)

my_eval(model,x_test,t_test)
10000/10000 [==============================] - 2s 157us/step
loss: 0.43272671551704406
acc: 0.8742
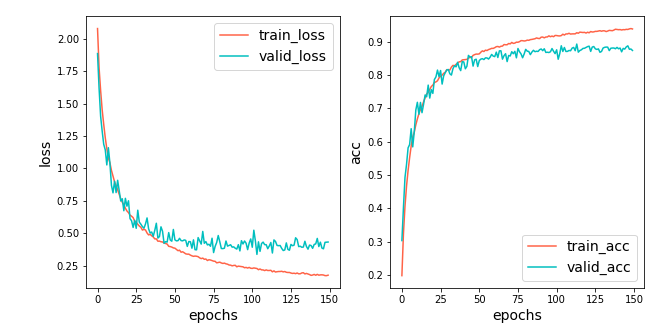
accuracyは87.42%となり,先ほどの84.39%から約3%ほどの向上が見られます.
validのlossの悪化も防げています.
Data Augmentaionなしの場合と比べてみます.
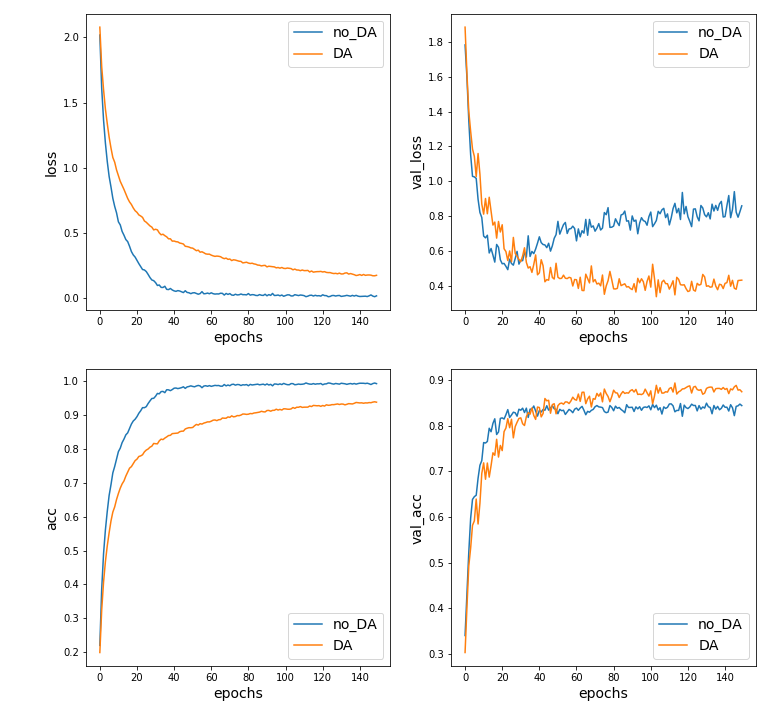
青線が,Data Augmentation無し,橙線がData augmentaion有りを示しています.
左側の図がtrainのlossとaccuracyを示していて,右側の図がvalidに関するものです.
trainでは,loss・accともにData augmentaionなしの方が良いですが,validでは逆にData Augmentation有りのほうが良い結果となっています.
期待通り,Data Augmentationにより汎化性能が向上していることが分かります.
層を増やす
先ほどのData Augmentationを用いた学習では,trainのaccが95%ほどで停滞していて,100%には到達していません.
訓練データの複雑さに対して,モデルの表現力が足りていない可能性が考えられます.
そこで,以下のように畳み込み層・全結合層ともに層を増やしたモデルで学習を行ってみます.
層を増やすことにより,モデルの表現力向上を目指します.
層を増やしたこと以外の変更点として,適当な箇所でBatch Normalizationを行っています.
層を増やしたことにより,学習が難しくなっていて,Batch Normalization無しでは学習が全く進みませんでした.
def create_deep_model():
    inputs = Input(shape = (32,32,3))

    x = Conv2D(64,(3,3),padding = "SAME",activation= "relu")(inputs)
    x = Conv2D(64,(3,3),padding = "SAME",activation= "relu")(x)
    x = BatchNormalization()(x)
    x = Conv2D(64,(3,3),padding = "SAME",activation= "relu")(x)
    x = MaxPooling2D()(x)
    x = Dropout(0.25)(x)

    x = Conv2D(128,(3,3),padding = "SAME",activation= "relu")(x)
    x = Conv2D(128,(3,3),padding = "SAME",activation= "relu")(x)
    x = BatchNormalization()(x)
    x = Conv2D(128,(3,3),padding = "SAME",activation= "relu")(x)
    x = MaxPooling2D()(x)
    x = Dropout(0.25)(x)

    x = Conv2D(256,(3,3),padding = "SAME",activation= "relu")(x)
    x = Conv2D(256,(3,3),padding = "SAME",activation= "relu")(x)
    x = BatchNormalization()(x)
    x = Conv2D(256,(3,3),padding = "SAME",activation= "relu")(x)
    x = Conv2D(256,(3,3),padding = "SAME",activation= "relu")(x)
    x = Conv2D(256,(3,3),padding = "SAME",activation= "relu")(x)
    x = BatchNormalization()(x)
    x = Conv2D(512,(3,3),padding = "SAME",activation= "relu")(x)
    x = Conv2D(512,(3,3),padding = "SAME",activation= "relu")(x)
    x = GlobalAveragePooling2D()(x)

    x = Dense(1024,activation = "relu")(x)
    x = Dropout(0.5)(x)
    x = Dense(1024,activation = "relu")(x)
    x = Dropout(0.5)(x)
    y  = Dense(10,activation = "softmax")(x)

    return Model(inputs,y)
モデル構造以外の条件は変えずに学習を行い,先ほどのベンチマークと比較してみます.
両者ともData Augmentationは行っています.
model = create_deep_model()
model.compile(loss = "categorical_crossentropy",optimizer = Adam(), metrics = ["accuracy"])
val_gen = ImageDataGenerator().flow(x_test,t_test, batch_size)
history = model.fit_generator(da_generator(), epochs=epochs, steps_per_epoch = steps_per_epoch,\
                          validation_data = val_gen, validation_steps = validation_steps)

my_eval(model,x_test,t_test)
10000/10000 [==============================] - 4s 408us/step
loss: 0.39195451920330526
acc: 0.9004

青線が,最初にベンチマークとして用意したモデル,
橙線が今回用いた層を深くしたモデルです.
ベンチマークのモデルに比べて,trainのaccuracyとlossが微差ですが改善されており,期待していたモデルの表現力向上の効果が確認できます.
同時に,validでのaccuracyも,層を増やす前の87.42%から90.04%へと改善されています.
学習率減衰
学習率減衰は,ある程度学習が進んだところで,学習率を小さくする手法です.
学習率を小さくすることで,モデルのパラメータの微調整が可能になり精度が向上します.
Kerasでは,epochごとに学習率を変更できます (参考: https://blog.shikoan.com/keras-learning-rate-decay/ ).
モデル構造は先ほどのものを用いて,学習率減衰を導入して学習します.
def step_decay(epoch):
    lr = 0.001
    if(epoch >= 100):
        lr/=5
    if(epoch>=140):
        lr/=2
    return lr
model = create_deep_model()
model.compile(loss = "categorical_crossentropy",optimizer = Adam(), metrics = ["accuracy"])
val_gen = ImageDataGenerator().flow(x_test,t_test, batch_size)
lr_decay = LearningRateScheduler(step_decay)
history = model.fit_generator(da_generator(), epochs=epochs, steps_per_epoch = steps_per_epoch,\
                        validation_data = val_gen, validation_steps = validation_steps,callbacks = [lr_decay])

my_eval(model,x_test,t_test)
10000/10000 [==============================] - 4s 422us/step
loss: 0.27507986684702335
acc: 0.925
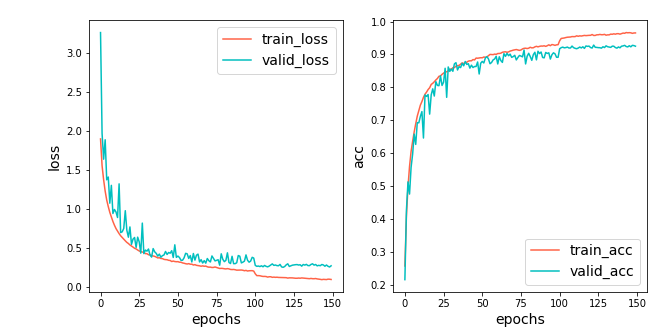
accuracyが90.04%から,92.50%に向上しました.
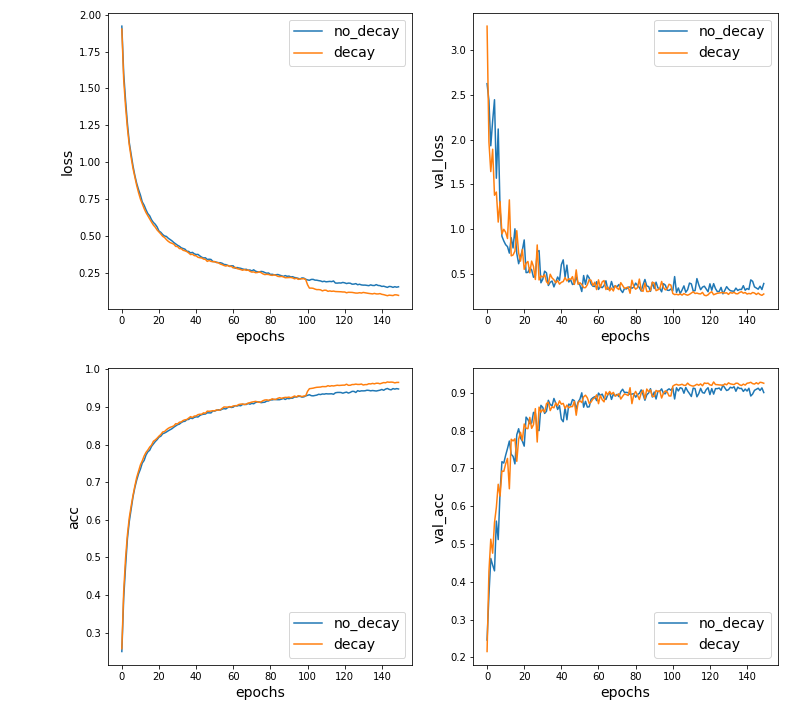
lossとaccの推移を見ると,学習率を小さくした100epoch目で両者とも改善が見られます.
以下の,学習率減衰なしの場合との比較も分かりやすいです.
青線が学習率減衰無し,橙線が学習率減衰有りを表します.
Test Time Augmentation(TTA)
Test Time Augmentationは,予測時にもData Augmentationを行う手法です.
ラベルを予測したい一つの画像から,複数の画像をAugmentationによって生成し,それらに対する予測の平均を最終的な予測とします.
複数の予測から最終的な予測を構成するという意味では,
アンサンブル学習をイメージしてもらえると分かりやすいかもしれません.
以下のリンクが参考になります.
https://qiita.com/cfiken/items/7cbf63357c7374f43372
試しに,先ほどの学習率減衰を導入して学習したモデルでTTAを行ってみます.
def tta(model,test_size,generator,batch_size ,epochs = 10):
    #test_time_augmentation
    #batch_sizeは,test_sizeの約数でないといけない.
    pred = np.zeros(shape = (test_size,10), dtype = float)
    step_per_epoch = test_size //batch_size
    for epoch in range(epochs):
        for step in range(step_per_epoch):
            sta = batch_size * step
            end = sta + batch_size
            tmp_x = generator.__next__()
            pred[sta:end] += model.predict(tmp_x)

    return pred / epochs


def tta_generator():
    return ImageDataGenerator(rotation_range = 20 , horizontal_flip = True,height_shift_range = 0.2,\
                                 width_shift_range = 0.2,zoom_range = 0.2,channel_shift_range = 0.2\
                                  ).flow(x_test,batch_size = batch_size,shuffle = False)
tta_epochs = 50
model = load_model(data_dir + "models/lr_decay.hdf5") #学習率減衰を使用して学習したモデルをロード
tta_pred = tta(model,x_test.shape[0],tta_generator(),batch_size ,epochs = tta_epochs)

print("tta_acc: ",end = "")
print( accuracy_score( np.argmax(tta_pred,axis = 1) , np.argmax(t_test,axis = 1)))
tta_acc: 0.9431
TTAによる予測のaccuracyは94.31%でした.
TTAなしの予測のaccuracyは92.50%だったので,1.5%以上の改善になります.
アンサンブル学習
アンサンブル学習は,複数の学習器を組み合わせて,一つの学習器を構成する手法です.
アンサンブル学習ではモデルの多様性が大事になってきます.
今回は10個のモデルを用意し,そのうち5個のモデルをAugmentをより強くして学習をさせることにより,多様性をもたせます.
多様性という意味では,各モデルで画像の前処理の方法を変えてみる等も面白いと思います.
def da_generator_strong():
    return ImageDataGenerator(rotation_range = 20, horizontal_flip = True, height_shift_range = 0.3,\
                                width_shift_range = 0.3,zoom_range = 0.3, channel_shift_range = 0.3
                                ).flow(x_train,t_train, batch_size )
では,モデルを学習させます(学習率減衰・TTA使用).
ens_epochs = 10
tta_epochs = 50

for i in range(ens_epochs):
    model = create_deep_model()
    model.compile(loss = "categorical_crossentropy",optimizer = Adam(), metrics = ["accuracy"])
    val_gen = ImageDataGenerator().flow(x_test,t_test, batch_size)
    lr_decay = LearningRateScheduler(step_decay)

    if(i < ens_epochs/2 ):
        train_gen = da_generator()
    else: #半分のモデルは,Augmentを強くする
        train_gen = da_generator_strong()
    his = model.fit_generator(train_gen, epochs=epochs, steps_per_epoch = steps_per_epoch,\
                          validation_data = val_gen, validation_steps = validation_steps,verbose = 0,callbacks = [lr_decay])

    pred = tta(model,x_test.shape[0],tta_generator(),batch_size ,epochs = tta_epochs)
    np.save(data_dir + "predictions/" + "pred_" + str(i),pred)
得られた10個の予測結果の平均を最終予測とし,accuracyを求めます.
acc_list = []
final_pred = np.zeros_like(t_test)
for i in range(ens_epochs):
    pred = np.load(data_dir + "predictions/pred_" + str(i) + ".npy") # 各モデルの予測結果をロード
    acc_list.append(accuracy_score( np.argmax(pred,axis = 1), np.argmax(t_test,axis = 1)) )
    final_pred += pred

final_pred /= ens_epochs
print("final_acc: " ,end = "")
print( accuracy_score(np.argmax(final_pred,axis = 1), np.argmax(t_test,axis = 1)))
final_acc: 0.9507
というわけで,ギリギリですがaccuracy95%を達成できました.
各モデル単体でのaccuracyも見てみましょう.
print(acc_list)
print("acc_mean: ",end = "")
print( np.mean(acc_list))
[0.9422, 0.9393, 0.9395, 0.9431, 0.9403, 0.9433, 0.9448, 0.9439, 0.9433, 0.941]
acc_mean: 0.9420700000000002
各モデル単体でのaccuracyは平均94.2%ほどなので,アンサンブル学習により1%弱精度が改善されたことが分かります.
おわりに
CIFAR-10で95%を達成するために行ったテクニックを解説してきました.
おかしい点や疑問点,感想等有りましたらコメント頂けると,とても嬉しいです.
本記事がQiita初投稿なので,書き方等に関してのご指摘等も歓迎です.
