What's Cloud Native?
- Cloud native technologies empower organizations to build and run scalable applications in modern, dynamic environments such as public, private, and hybrid clouds.
- Resilient, Manageable, and Observable
- たくさんのアプリケーションを動かすことへの問題、はパブリッククラウド や Docker や Kubernetes がかなり解決してくれた
- それらをいい感じに協調させたり、問題が起きた時に正しく対処を行えるかどうかに大きな課題があるのが現在
Why Cloud Native? (in Quipper case)
- 一つのコードベースで様々なビジネスが行われ、組織的・ビジネス的な複雑性が課題となっている
- B2C/B2B, 小中高, 国内/グローバル, そして新規事業
- サービスがたくさん増えて、複雑なエコシステムを形成しようとしている
- Microservices
- 複数のクラスタ、環境上に、様々なプロダクト、アプリケーション
- 一貫した方法で Observability を提供したい
- https://ymotongpoo.hatenablog.com/entry/2019/03/25/084500
- SRE がボトルネックにならず、開発チームが自律的かつ高速にプロダクト開発を回せるようにしたい
- セルフサービス化の流れ
- Observability は大事だけど、そればかりに時間を取られては本末転倒
The Theree Pillars of Observability
-
https://www.oreilly.com/library/view/distributed-systems-observability/9781492033431/ch04.html
- Event Logs
- Quipper では GCP の Stackdriver Logging を使っている (これは超絶便利!!)
- Metrics
- Quipper では主に Datadog を使っている
- 今日はこれの話
- Tracing
- Jaeger 試したりしているけどまだまだ活用できてない
- そもそも社内的にまだそんなに欲されている状況でもない
- とはいえ必要になるのも時間の問題なので今日の kawasy さんの発表楽しみです!!!
- Event Logs
Collecting Ruby Metrics for Datadog
- 今日は prometheus_exporter という gem について紹介します
- Ruby プロセスや様々なフレームワーク (Rails, Puma, Sidekiq, etc) のための Prometheus の Exporter を提供する
- Prometheus? Exporter?
Prometheus
- 時系列データベースを基盤としたモニタリングシステム
- が、Quipper で使っている訳ではないので僕も触ったことがある訳ではない
- そもそも Datadog を使っているのに何故?
- そこで Exporter
Prometheus Exporter
- 監視対象のサーバ等で起動して、Prometheus から pull してメトリクスを取得するための Web API みたいなもの
- オープンソースで多数公開されている
- Datadog は Prometheus Exporter からのメトリクス収集もできる
# HELP ruby_rss Total RSS used by process.
# TYPE ruby_rss gauge
ruby_rss{type="master",pid="1",pod_name="api-6bcf6c8554-jntdq"} 390942720
ruby_rss{pod_name="api-6bcf6c8554-jntdq",type="web",pid="45"} 346877952
ruby_rss{pod_name="api-6bcf6c8554-jntdq",type="web",pid="42"} 347594752
ruby_rss{pod_name="api-6bcf6c8554-jntdq",type="web",pid="39"} 350285824
ruby_rss{pod_name="api-6bcf6c8554-jntdq",type="web",pid="50"} 347901952

# HELP ruby_unicorn_workers_total Number of unicorn workers.
# TYPE ruby_unicorn_workers_total gauge
ruby_unicorn_workers_total{pod_name="api-6bcf6c8554-jntdq"} 4

# HELP ruby_unicorn_active_workers_total Number of active unicorn workers
# TYPE ruby_unicorn_active_workers_total gauge
ruby_unicorn_active_workers_total{pod_name="api-6bcf6c8554-jntdq"} 0
Datadog and Kubernetes
- Datadog には Auto Discovery という仕組みがあり、Pod (コンテナの集合的なやつ) の annotations (メタデータみたいなやつ) に設定を記述するだけで、Datadog が勝手に収集してくれる
- コピペでメトリクスの収集が行われるようになるので簡単
- サービス作成時のテンプレート的なやつに含めて自動化とかもできそう
- Kubernetesにデプロイしたアプリケーションのメトリクスを自動収集する
Annotation
metadata:
  annotations:
    ad.datadoghq.com/api.check_names: |
      ["prometheus"]
    ad.datadoghq.com/api.init_configs: |
      [{}]
    ad.datadoghq.com/api.instances: |
      [
        {
          "prometheus_url": "http://%%host%%:9394/metrics",
          "namespace": "prometheus_checks",
          "metrics": ["*"]
        }
      ]
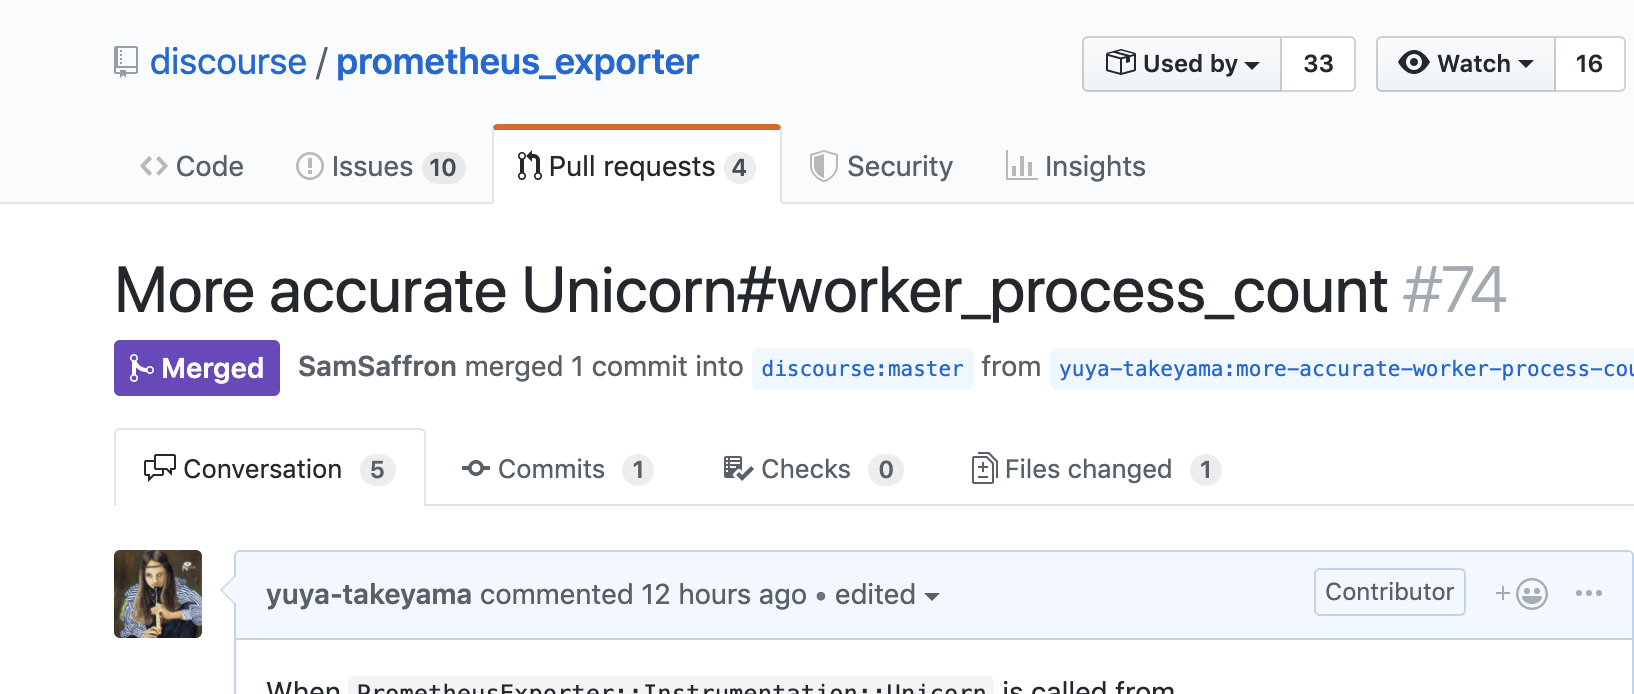
今日の成果
Ruby クイズ: 何が問題だったでしょう
元のコード
    def worker_process_count
      # ...

      # find all processes whose parent is the unicorn master
      # but we're actually only interested in the number of processes (= lines of output)
      result = `ps --no-header -o pid --ppid #{pid}`
      result.lines.count
    end