概要
グラフにエラーバーをつけたいことは多々ありますよね。
今回はグラフにエラーバーをつけて、検量線を描くことを目標とします。
データの用意
from matplotlib import pyplot as plt
import random
import numpy as np
from sklearn.metrics import r2_score

## テストデータの作成
x = [i+random.uniform(-0.2, 0.2) for i in range(5)] # 変数を初期化
y = [i+random.uniform(-0.5, 0.5) for i in range(5)]
x_err = [random.uniform(-0.5, 0.5) for i in range(5)] # 誤差範囲を乱数で生成
y_err = [random.uniform(-0.5, 0.5) for i in range(5)]
y軸方向にerror barを設定
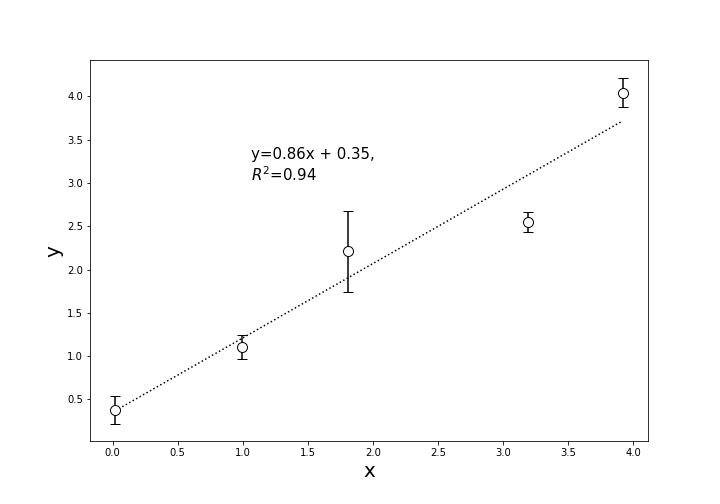
もっとも多く使うのはy軸方向にerror barを設定するケースだと思います。
plt.errorbarのyerrに誤差の入った配列を設定します。以下によく使う引数をまとめました。
| 引数 | 意味 |
|---|---|
| x | x軸の値(配列) |
| y | y軸の値(配列) |
| xerr | x軸の誤差の値(配列) |
| yerr | y軸の誤差の値(配列) |
| fmt | マーカーの表示, 'o', 'v'など 詳しくはこちら |
| markersize | マーカーの大きさ |
| color | マーカーの色 |
| markeredgecolor | マーカーの縁の色 |
| ecolor | エラーバーの色 |
| capsize | エラーバーの横線の長さ |
(matplotlib.pyplot.errorbarにはもっと詳しくあります。)
また、検量線はnp.polyfitで一次近似して、scikit_learnのr2_scoreで決定係数を出します。
# y軸方向にのみerrorbarを表示
plt.figure(figsize=(10,7))
plt.errorbar(x, y, yerr = y_err, capsize=5, fmt='o', markersize=10, ecolor='black', markeredgecolor = "black", color='w')
coef=np.polyfit(x, y, 1)
appr = np.poly1d(coef)(x)
plt.plot(x, appr,  color = 'black', linestyle=':')
y_pred = [coef[0]*i+coef[1] for i in x]
r2 = r2_score(y, y_pred)
plt.text(max(x)/3.7, max(y)*6/8, 'y={:.2f}x + {:.2f}, \n$R^2$={:.2f}'.format(coef[0], coef[1], r2), fontsize=15)
plt.xlabel('x', fontsize=20)
plt.ylabel('y', fontsize=20)
# plt.savefig('y_error_bar.png')
x, y軸両方にerror barを設定
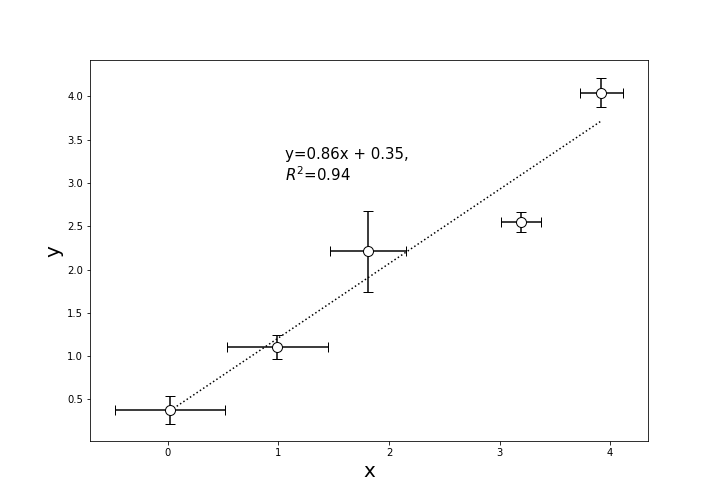
x軸方向にもerror barをつけたいこともあるでしょう。
その場合は、xerr引数に誤差配列を渡せばできます。
# x軸方向にもerrorbarを表示
plt.figure(figsize=(10,7))
plt.errorbar(x, y, yerr = y_err, xerr = x_err, capsize=5, fmt='o', markersize=10, ecolor='black', markeredgecolor = "black", color='w')
coef=np.polyfit(x, y, 1)
appr = np.poly1d(coef)(x)
plt.plot(x, appr,  color = 'black', linestyle=':')
y_pred = [coef[0]*i+coef[1] for i in x]
r2 = r2_score(y, y_pred)
plt.text(max(x)/3.7, max(y)*6/8, 'y={:.2f}x + {:.2f}, \n$R^2$={:.2f}'.format(coef[0], coef[1], r2), fontsize=15)
plt.xlabel('x', fontsize=20)
plt.ylabel('y', fontsize=20)
# plt.savefig('xy_error_bar.png')
リソース
以下のrepositoryに実行コードがあります。
https://github.com/YutoOhno/ErrorBar

