概要
Google ColabではUIを作る方法に、Google Colabのフォーム機能(Forms snippets)、JupyterのUIライブラリとして使えるIpywidgets(advanced_outputs.ipynb)等があります。コメント一行でUI生成。Form機能を使った一歩先のGoogle Colab活用術の記事時点では、IpywidgetsはGoogle Colabで使えませんでしたが、Stack Overflow Ipywidgets with Google Colaboratoryの記事を参考にすると、大部分が使えるようです。実際に現在(2022/8/20)では、動きました。
今回紹介するのは、それらとは違いGoogle Colabのライブラリのwidgetsを使った、グラフ等をバックグラウンドで動くタブにUI表示する方法です。
Google Colabで作成したコードは、こちらにあります。
下準備
- 各種インポート(実行時の各versionは、Google Colab内で作成したコードにあります。)
- コード内で使う関数を定義
各種インポート
from google.colab import widgets
import time
import numpy as np
import matplotlib.pyplot as plt
実行時の各versionは、Google Colab内で作成したコードこちらにあります。
コード内で使う関数を定義
def show_plot_info(t):
    fig = plt.figure()
    ax = fig.add_subplot(111)
    x = np.arange(0, 6, 0.1)
    y = np.sin(x)
    ax.plot(x + t, y)
    ax.set_xlim(0, 20)
    ax.set_title('t=' + str(t))
    ax.set_xlabel('x')
    ax.set_ylabel('y')
    plt.show()


def show_plot_info_2gird(t, grid):
    fig = plt.figure()
    ax = fig.add_subplot(111)
    x = np.arange(0, 6, 0.1)
    if grid == 0:
        y = np.cos(x)
        ax.set_title('cos t=' + str(t))
    else:
        y = np.sin(x)
        ax.set_title('sin t=' + str(t))
    ax.plot(x + t, y)
    ax.set_xlim(0, 10)
    ax.set_xlabel('x')
    ax.set_ylabel('y')
    plt.show()
方法
- タブの表示方法
- output_to()関数を使ってタブを表示
- output_to()関数のオプションselectの使い方
- output_to()関数を使わないでタブを表示
- output_to()関数を使ってタブを表示
- グリッドの表示方法
- output_to()関数を使ってグリッドを表示
- output_to()関数を使わないでグリッドを表示
- タブの配置の変え方
- タブとグリッドの消し方
1. タブの表示方法
output_to()関数を使って表示
times = range(20)
tbs = widgets.TabBar([str(t) for t in times])
for t in times:
    with tbs.output_to(str(t)):
        print('もちろん文字も入れられます')
        show_plot_info(t)
        print('タブ{}です'.format(str(t)))
tbs = widgets.TabBar([str(t) for t in times])で、タブを作成します。
with tbs.output_to(str(t))で、出力したいタブを選択して開いて書き込みます。文字やグラフを書き込むことができます。
出力結果

output_to()関数のオプションselectの使い方
times = range(20)
tbs = widgets.TabBar([str(t) for t in times])
for t in times:
    flag = (t % 5 == 0)
    with tbs.output_to(str(t), select=flag):
        print('もちろん文字も入れられます')
        show_plot_info(t)
        print('タブ{}です'.format(str(t)))
        if flag:
            print('このタブは5の倍数なので表示されます')
        else:
            print('このタブはバックグラウンドに表示されます')
tbs.output_to()関数のオプションでselect=Trueのとき、タブを切り替えます。デフォルトは、select=Trueです。
出力結果
タブ名が5の倍数のとき、切り替わります。

output_to()関数を使わないでタブを表示
times = range(20)
tbs = widgets.TabBar([str(t) for t in times])
for t, _ in zip(times, tbs):
        print('もちろん文字も入れられます')
        show_plot_info(t)
        print('タブ{}です'.format(str(t)))
tbsはfor文の繰り返しオブジェクトに使うことができ、tbsの作成した配列の順番で書き込めます。
出力結果
2. グリッドの表示方法
output_to()関数を使ってグリッドを表示
times = range(2)
grid = widgets.Grid(2, 1)
for t in times:
    with grid.output_to(t, 0):
        print('もちろん文字も入れられます')
        show_plot_info(t)
        print('grid({}, 0)です'.format(t))
grid = widgets.Grid(2, 1)で、グリッドを作成します。
with grid.output_to(t, 0)で、出力したいグリッドを選択して書き込みます。文字やグラフを書き込むことができます。
出力結果

output_to()関数を使わないでグリッドを表示
times = range(4)
grid = widgets.Grid(2, 2)
for t, (row, col) in zip(times, grid):
    print('もちろん文字も入れられます')
    show_plot_info(t)
    print('grid({}, {})です'.format(row, col))
gridはfor文の繰り返しオブジェクトに使うことができ、行列の順番で書き込めます。
出力結果

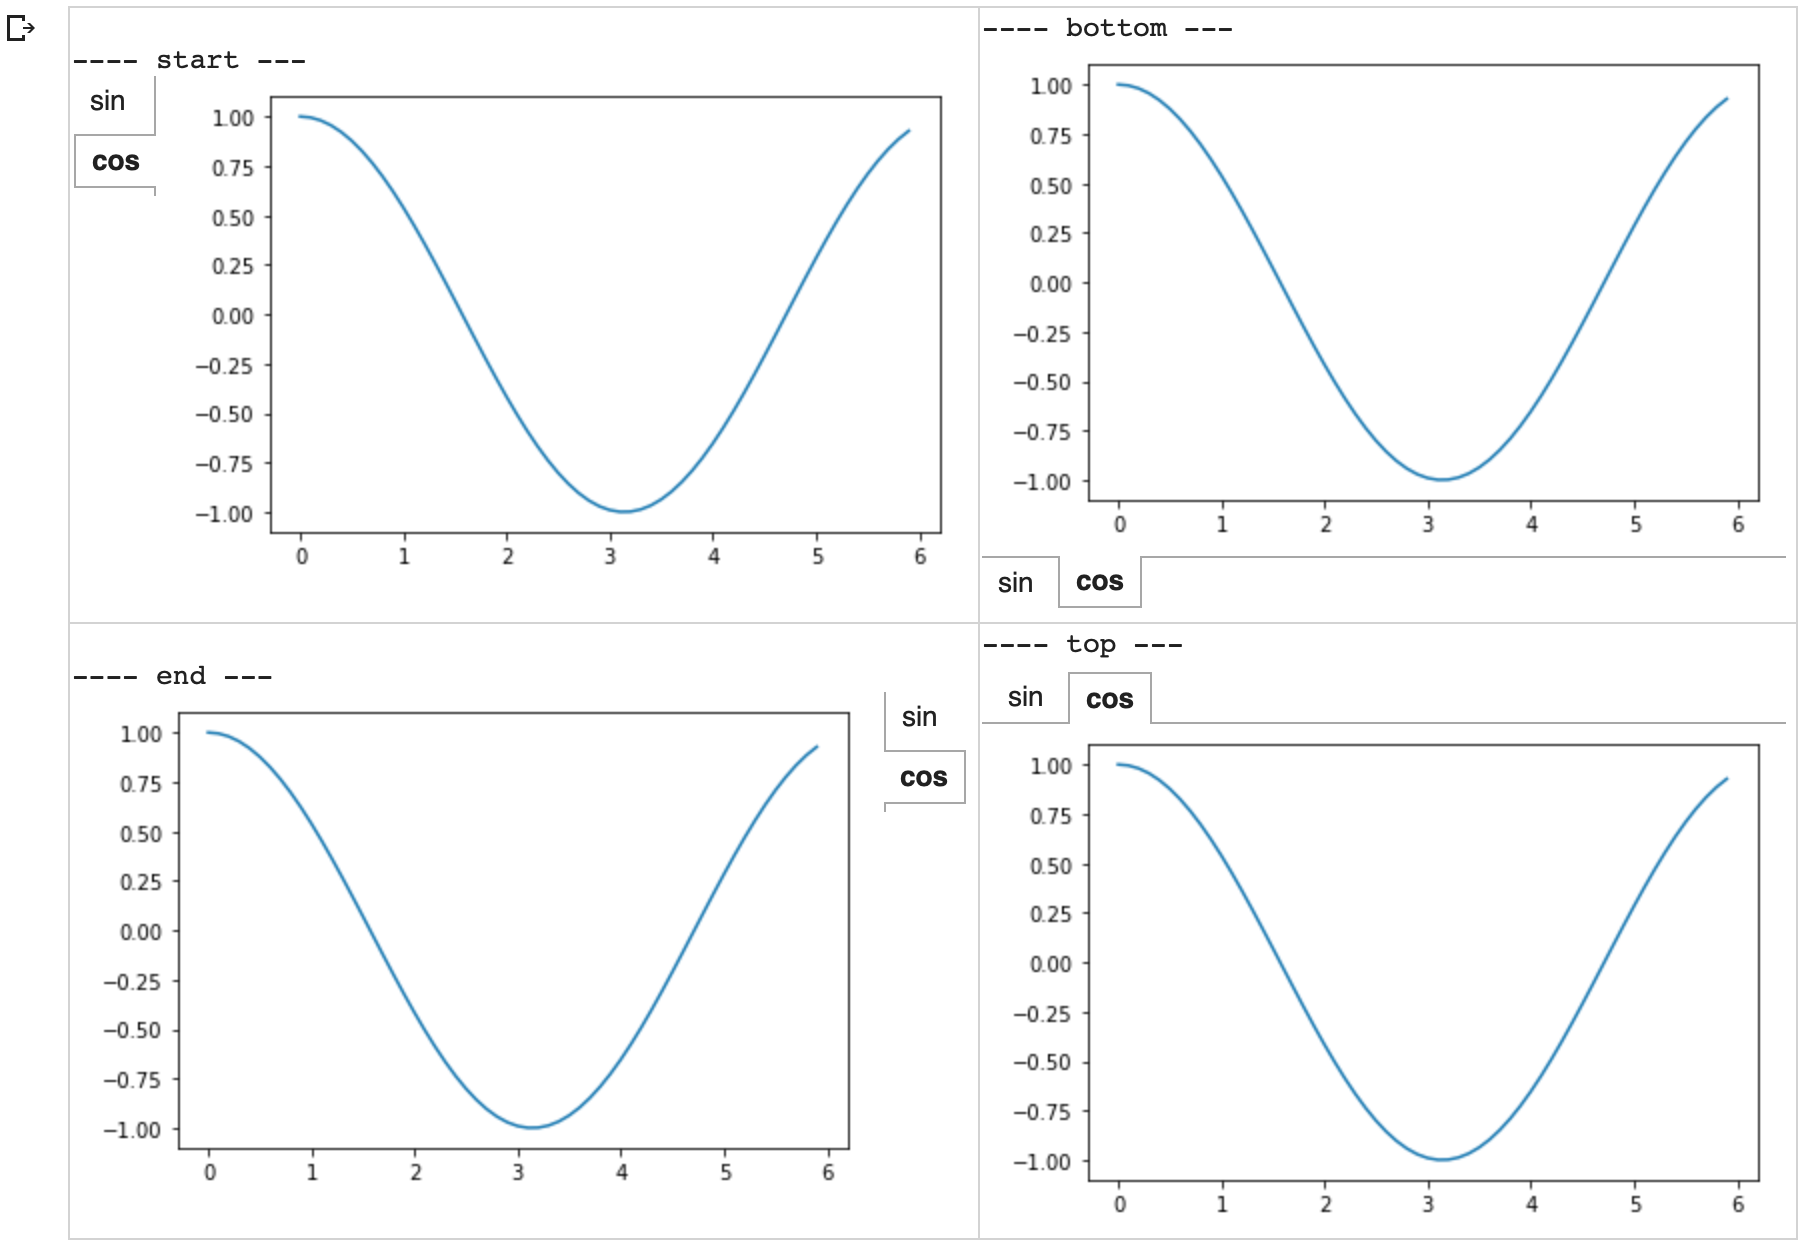
3. タブの配置の変え方
 def create_tab(location):
    tbs = widgets.TabBar(['sin', 'cos'], location=location)
    with tbs.output_to('sin'):
        fig = plt.figure()
        ax = fig.add_subplot(111)
        x = np.arange(0, 6, 0.1)
        y = np.sin(x)
        ax.plot(x, y)
        plt.show()
    with tbs.output_to('cos'):
        fig = plt.figure()
        ax = fig.add_subplot(111)
        x = np.arange(0, 6, 0.1)
        y = np.cos(x)
        ax.plot(x, y)
        plt.show()


positions = ['start', 'bottom', 'end', 'top']
grid = widgets.Grid(2, 2)
for position, _ in zip(positions, grid):
  print('---- {} ---'.format(position))
  create_tab(position)
tbs.output_to()関数のオプションのlocationで、タブの配置を選択できます。locationには、'start', 'bottom', 'end', 'top'を引数に持つことができ、それぞれ、左上、右下、右上、左上に配置されます。デフォルトは、location='top'です。
4. タブとグリッドの消し方
print('1番目 : ここはタブ内でもグリッド内でもないです')
tbs = widgets.TabBar(['tab1', 'tab2'])
grid = widgets.Grid(2, 2)
for num, _ in enumerate(tbs):
    print('ここはタブ内です')
    print('{}番目のタブです'.format(num))

print('2番目 : ここはタブ内でもグリッド内でもないです')
for row, col in grid:
    print('ここはグリッド内です')
    print('grid({}, {})'.format(row, col))

print('3番目 : ここはタブ内でもグリッド内でもないです')
print('10秒後にグリッドを消します', end=' '); time.sleep(10)
grid.remove(); print('消しました')
print('5秒後にタブも消します', end=' '); time.sleep(5)
tbs.remove(); print('消しました')
tbsという変数名でタブを作った場合、tbs.remove()でタブ内に書き込んだ文字やグラフ等を全て削除できます。同様に、gridという変数名でグリッドを作った場合、grid.remove()でグリッド内に書き込んだ文字やグラフ等を全て削除できます。
応用例(おもしろそうな使い道)
- アニメーション風に表示する例
- 表示タブを制御して表示
- グリッドにグラフを描いて消してを繰り返して表示
- 1つのグリッドの場合
- 2つのグリッド交互の場合
- タブとグリッドを組み合わせる例
1. アニメーション風に表示する例
表示タブを制御して表示
times = range(20)
tbs = widgets.TabBar([str(t) for t in times])
for t, _ in zip(times, tbs):
        show_plot_info(t)

# 順方向表示
print('順方向に表示します')
for _ in tbs:
    time.sleep(0.5)

# 逆方向表示
print('逆方向に表示します')
for t in reversed(times):
    with tbs.output_to(str(t)):
        time.sleep(0.5)
最初の4行で、タブにグラフを書き込みます。
そのできたタブを開いて、time.sleep(0.5)で0.5秒そのままにして次のタブを開くことを繰り返すことで、アニメーション風に表示できます。
逆方向の表示は、reversed(tbs)がエラーで使えなかったため、output_to()関数を使って表示タブを指定して開いています。
アニメーション風と書いている理由は、タブの開くタイミングやグラフの表示が遅れたりして、順番にタイミング良く表示することが難しいからです。
出力結果
グリッドにグラフを描いて消してを繰り返して表示
#### 1つのグリッドの場合
times = range(10)
grid = widgets.Grid(1, 1)
for t in times:
    with grid.output_to(0, 0):
        grid.clear_cell()
        show_plot_info(t)
        time.sleep(1)
grid.clear_cell()でグラフを消して、グリッドにグラフを描いてtime.sleep(1)で1秒そのままにして、grid.clear_cell()でグラフを消すことを繰り返すことで、アニメーション風に表示できます。
アニメーション風と書いている理由は、グラフの削除や表示が遅れたりして、順番にタイミング良く表示することが難しいからです。
2つのグリッド交互の場合
times = range(5)
grid = widgets.Grid(2, 1)
for t in times:
    for grid_num, _ in zip(range(2), grid):
        grid.clear_cell()
        show_plot_info_2gird(t, grid_num)
        time.sleep(1)
アニメーションで2つのグラフを表示するとき、2つのグラフが同時に変化すると変化を追うのが難しい場合もあるので(私だけかも)、グラフを交互に切り替えて表示するアニメーションを紹介します。グラフがかなりカクツクため、こちらのコードはあまり需要はなさそうです。そこで、タブとグリッドを組み合わせると少し改善できます。
2. タブとグリッドを組み合わせる例
times = range(5)
grid = widgets.Grid(2, 1)
tbs_1 = widgets.TabBar([str(t) for t in times])
tbs_2 = widgets.TabBar([str(t) for t in times])
tbss = [tbs_1, tbs_2]
for grid_num, (tbs, _) in enumerate(zip(tbss, grid)):
    for t in times:
        with tbs.output_to(str(t), select=True):
            show_plot_info_2gird(t, grid_num)

# グリッドを交互に動かす
print('グリッドを交互に移動してタブを動かします')
for t in times:
    for tbs, _ in zip(tbss, grid):
        with tbs.output_to(str(t), select=True):
            time.sleep(0.5)

# グリッド毎に動かす
print('グリッド毎にタブを動かします')
for tbs, _ in zip(tbss, grid):
    for t in times:
        with tbs.output_to(str(t), select=True):
            time.sleep(0.5)
グリッドを2つ用意して、タブ毎にグラフを書き込み、グリッドを切り替えながらタブを順番に開いています。
2つのグラフを交互に動かす場合は、グリッドにグラフを描いて消してを繰り返して表示する方法よりも少しグラフが滑らかに表示できているので、改善された気がします。
まとめ
このツールを使いこなして、Google Colabを見やすくしましょう。