はじめに
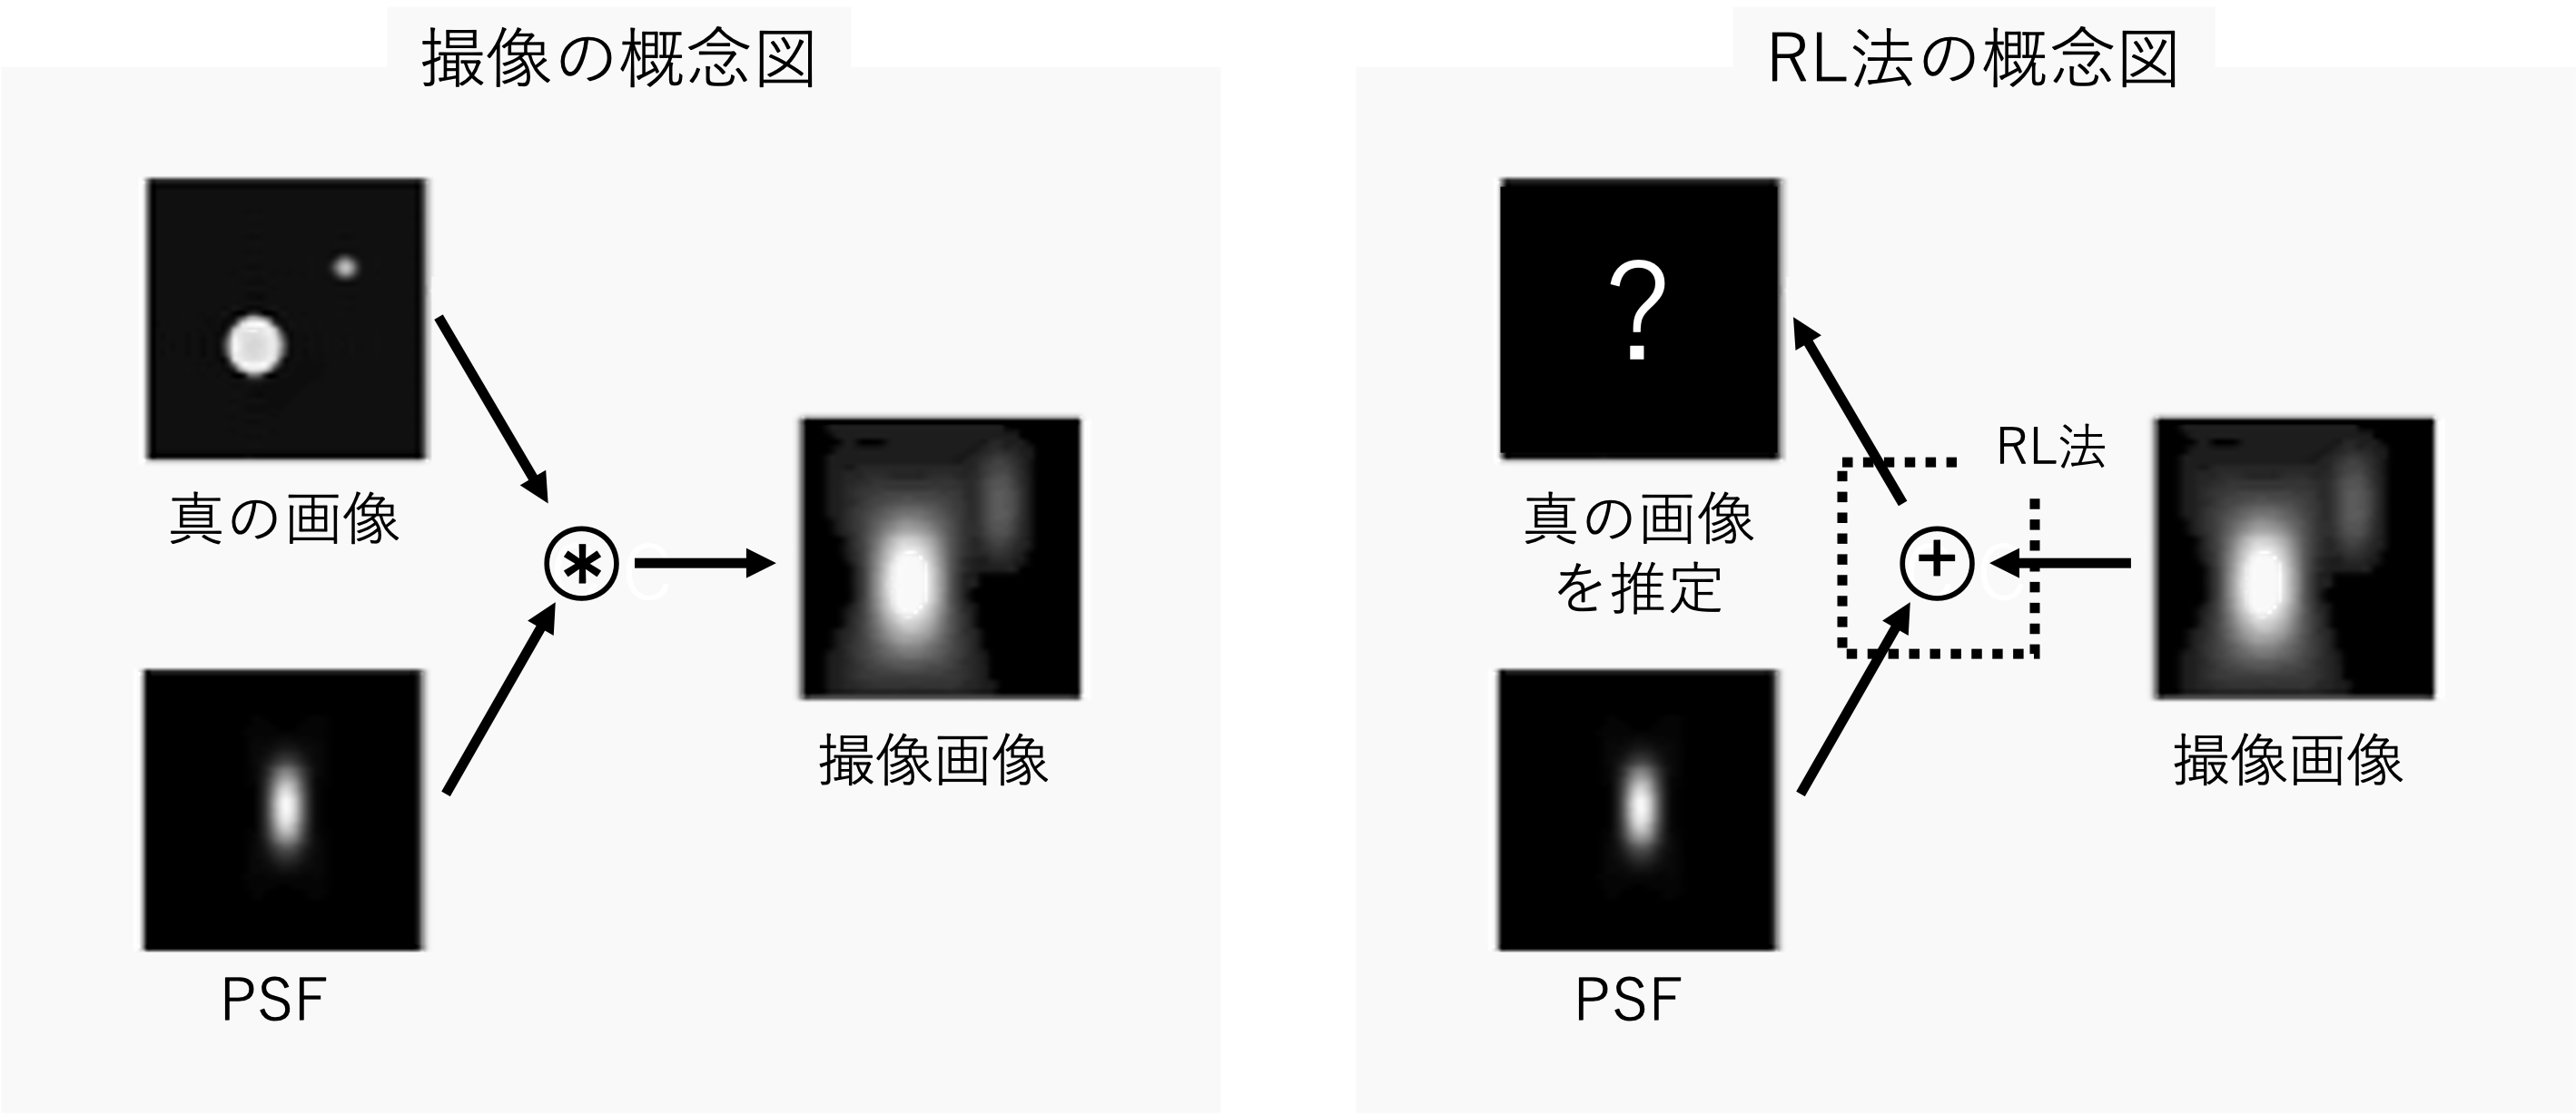
Richardson-Lucy deconvolution(以下、RL法)は、画像等を鮮明にする手法である。一般的な撮像観測では、観測装置の回折等により光源が拡がって撮像される。この拡がり具合は、点拡がり関数(Point Spread Function, 以下、PSF)で表される。RL法は既知のPSFと撮像画像から、真の画像を推定する手法である。
本シリーズの目標
実際の撮像観測では真の画像は知り得ないので、RL法により推定された真の画像は、本当に真の画像に近づいているか分からない。そこで、本シリーズでは、真の画像とPSFが完全にわかっていて、かつノイズが乗らない理想的な状況でのシミュレーションにより、RL法の特徴を理解する。
本シリーズは3部構成(前編:シミュレーションの実装、中編:結果の解析、後編:補足)で、気長に記事にしていく予定である。(お楽しみに!)
RL法とは
RL法は、既知のPSFと撮像画像を用いて真の画像を推定する手法である。真の画像の分布、既知のPSF、撮像画像の関係をベイズの定理を用いて関係づける。そして、ベイズ推定を繰り返し計算することにより真の画像を推定する。理論式は
 W_{i,r+1} = W_{i,r}\sum_k \frac{P_{i,k}H_k}{\sum_j P_{j,k}W_{j,r}}\
\quad r = 0,\ 1,\  2,\  \dots
と表される。$j,k$はピクセル座標とする。$W$は真の画像、$H$は撮像画像、$r$は反復回数とする。$P_{j,k}$はPSFで、$W_j$が$H_k$で観測される確率を$P(H_k|W_j)=P_{j,k}$とする。式の導出は、私の記事で恐縮ですが、Richardson-Lucy deconvolutionの理論式を導出しようを参照されたい。
解析
反復回数毎の差分画像の解析、その他の解析(合計、最小値、最大値、中央値と平均、分散、重心)からRL法の性質を解析する。
Google Colabで作成した本記事のコードは、こちらにあります。
準備
各種インポート
import numpy as np
import matplotlib.pyplot as plt
import matplotlib.colors as colors
import matplotlib.cm as cm
from scipy.stats import multivariate_normal
from scipy.signal import convolve
import cv2
実行時の各種バージョン
| Name | Version |
|---|---|
| numpy | 1.21.5 |
| matplotlib | 3.2.2 |
| scipy | 1.4.1 |
| opencv-python | 4.1.2.30 |
PSF作成用の関数
def get_psf(px, sigma):
    half_px = px // 2
    x, y = np.mgrid[-half_px:half_px+1:, -half_px:half_px+1:]
    pos = np.dstack((x, y))
    mean = np.array([0, 0])  # 分布の平均
    cov = np.array([[sigma**2, 0], [0, sigma**2]])  # 分布の分散共分散行列
    rv = multivariate_normal(mean, cov)
    psf = rv.pdf(pos)
    return psf
シミュレーションに使用するPSFは何でも良いが、今回は多変量正規分布に従うPSFで実装する。多変量正規分布にはSciPyのmultivariate_normalを使用する。
多変量正規分布の性質については、多変量正規分布の性質を図で解説するや多変量正規分布をPythonでplotして理解するを参照されたい。
RL法の関数(全ての反復回数のRL法の結果を返す関数)
RL法の理論式より、1つ前の反復回数の結果を用いて1つ後の反復回数の結果を得るため、scikit-imageのRL法のソースコードの一部を書き換え、本家の機能を損なわずにかつ一度のRL法で全ての反復回数の結果を取得するコードを作成する。
言葉だけでは分かりにくいので、変更部のイメージを次図で補足する。

例えば反復回数1, 2, 3の結果を得る場合、ソースコードそのままでは3回分コードを処理することになるが、ソースコードを変更することで、一度の処理で全ての反復回数の結果を効率的に取得できる。
scikit-imageのRL法のコードはVersion 0.19.1で一部変更されているため、ここでは執筆時点(2022/03/31)でのGoogle Colab対応のVersion 0.18.3とVersion 0.19.1の2つのコードを掲載する。なお、本記事ではGoogel Colabで実装するため、Version 0.18.3のRL法のコードを用いる。
def richardson_lucy(image, psf, iterations=50, clip=True, filter_epsilon=None):
    """Richardson-Lucy deconvolution.

    Parameters
    ----------
    image : ndarray
       Input degraded image (can be N dimensional).
    psf : ndarray
       The point spread function.
    iterations : int, optional
       Number of iterations. This parameter plays the role of
       regularisation.
    clip : boolean, optional
       True by default. If true, pixel value of the result above 1 or
       under -1 are thresholded for skimage pipeline compatibility.
    filter_epsilon: float, optional
       Value below which intermediate results become 0 to avoid division
       by small numbers.

    Returns
    -------
    im_deconv : ndarray
       The deconvolved image.

    Examples
    --------
    >>> from skimage import img_as_float, data, restoration
    >>> camera = img_as_float(data.camera())
    >>> from scipy.signal import convolve2d
    >>> psf = np.ones((5, 5)) / 25
    >>> camera = convolve2d(camera, psf, 'same')
    >>> camera += 0.1 * camera.std() * np.random.standard_normal(camera.shape)
    >>> deconvolved = restoration.richardson_lucy(camera, psf, 5)

    References
    ----------
    .. [1] https://en.wikipedia.org/wiki/Richardson%E2%80%93Lucy_deconvolution
    """
    float_type = np.promote_types(image.dtype, np.float32)
    image = image.astype(float_type, copy=False)
    psf = psf.astype(float_type, copy=False)
    im_deconv = np.full(image.shape, 0.5, dtype=float_type)
    psf_mirror = np.flip(psf)

    for _ in range(iterations):
        conv = convolve(im_deconv, psf, mode='same')
        if filter_epsilon:
            relative_blur = np.where(conv < filter_epsilon, 0, image / conv)
        else:
            relative_blur = image / conv
        im_deconv *= convolve(relative_blur, psf_mirror, mode='same')

    if clip:
        im_deconv[im_deconv > 1] = 1
        im_deconv[im_deconv < -1] = -1

    return im_deconv
def each_iter_richardson_lucy(image, psf, iterations=50, clip=True, filter_epsilon=None):
    float_type = np.promote_types(image.dtype, np.float32)
    image = image.astype(float_type, copy=False)
    psf = psf.astype(float_type, copy=False)
    im_deconv = np.full(image.shape, 0.5, dtype=float_type)
    psf_mirror = np.flip(psf)
    im_deconvs = np.empty([iterations+1, *image.shape], dtype=float_type)
    im_deconvs[0] = image

    for iter in range(1, iterations+1):
        conv = convolve(im_deconv, psf, mode="same")
        if filter_epsilon:
            relative_blur = np.where(conv < filter_epsilon, 0, image / conv)
        else:
            relative_blur = image / conv
        im_deconv *= convolve(relative_blur, psf_mirror, mode="same")
        im_deconv_copy = im_deconv.astype(float_type, copy=True)
        if clip:
            im_deconv_copy[im_deconv_copy > 1] = 1
            im_deconv_copy[im_deconv_copy < -1] = -1
        im_deconvs[iter] = im_deconv_copy

    return im_deconvs
scikit-image Version 0.19.1を使う場合
import warnings
from collections.abc import Iterable


new_float_type = {
    # preserved types
    np.float32().dtype.char: np.float32,
    np.float64().dtype.char: np.float64,
    np.complex64().dtype.char: np.complex64,
    np.complex128().dtype.char: np.complex128,
    # altered types
    np.float16().dtype.char: np.float32,
    'g': np.float64,      # np.float128 ; doesn't exist on windows
    'G': np.complex128,   # np.complex256 ; doesn't exist on windows
}


def _supported_float_type(input_dtype, allow_complex=False):
    """Return an appropriate floating-point dtype for a given dtype.
    float32, float64, complex64, complex128 are preserved.
    float16 is promoted to float32.
    complex256 is demoted to complex128.
    Other types are cast to float64.
    Parameters
    ----------
    input_dtype : np.dtype or Iterable of np.dtype
        The input dtype. If a sequence of multiple dtypes is provided, each
        dtype is first converted to a supported floating point type and the
        final dtype is then determined by applying `np.result_type` on the
        sequence of supported floating point types.
    allow_complex : bool, optional
        If False, raise a ValueError on complex-valued inputs.
    Returns
    -------
    float_type : dtype
        Floating-point dtype for the image.
    """
    if isinstance(input_dtype, Iterable) and not isinstance(input_dtype, str):
        return np.result_type(*(_supported_float_type(d) for d in input_dtype))
    input_dtype = np.dtype(input_dtype)
    if not allow_complex and input_dtype.kind == 'c':
        raise ValueError("complex valued input is not supported")
    return new_float_type.get(input_dtype.char, np.float64)


"""ここから
@deprecate_kwarg({'iterations': 'num_iter'}, removed_version="1.0",
                 deprecated_version="0.19")
ここまでの行はコードが複雑にまたがっていてコードを追うのを断念"""
def richardson_lucy(image, psf, num_iter=50, clip=True, filter_epsilon=None):
    """Richardson-Lucy deconvolution.
    Parameters
    ----------
    image : ndarray
       Input degraded image (can be N dimensional).
    psf : ndarray
       The point spread function.
    num_iter : int, optional
       Number of iterations. This parameter plays the role of
       regularisation.
    clip : boolean, optional
       True by default. If true, pixel value of the result above 1 or
       under -1 are thresholded for skimage pipeline compatibility.
    filter_epsilon: float, optional
       Value below which intermediate results become 0 to avoid division
       by small numbers.
    Returns
    -------
    im_deconv : ndarray
       The deconvolved image.
    Examples
    --------
    >>> from skimage import img_as_float, data, restoration
    >>> camera = img_as_float(data.camera())
    >>> from scipy.signal import convolve2d
    >>> psf = np.ones((5, 5)) / 25
    >>> camera = convolve2d(camera, psf, 'same')
    >>> rng = np.random.default_rng()
    >>> camera += 0.1 * camera.std() * rng.standard_normal(camera.shape)
    >>> deconvolved = restoration.richardson_lucy(camera, psf, 5)
    References
    ----------
    .. [1] https://en.wikipedia.org/wiki/Richardson%E2%80%93Lucy_deconvolution
    """
    float_type = _supported_float_type(image.dtype)
    image = image.astype(float_type, copy=False)
    psf = psf.astype(float_type, copy=False)
    im_deconv = np.full(image.shape, 0.5, dtype=float_type)
    psf_mirror = np.flip(psf)

    # Small regularization parameter used to avoid 0 divisions
    eps = 1e-12

    for _ in range(num_iter):
        conv = convolve(im_deconv, psf, mode='same') + eps
        if filter_epsilon:
            relative_blur = np.where(conv < filter_epsilon, 0, image / conv)
        else:
            relative_blur = image / conv
        im_deconv *= convolve(relative_blur, psf_mirror, mode='same')

    if clip:
        im_deconv[im_deconv > 1] = 1
        im_deconv[im_deconv < -1] = -1

    return im_deconv
import warnings
from collections.abc import Iterable


new_float_type = {
    # preserved types
    np.float32().dtype.char: np.float32,
    np.float64().dtype.char: np.float64,
    np.complex64().dtype.char: np.complex64,
    np.complex128().dtype.char: np.complex128,
    # altered types
    np.float16().dtype.char: np.float32,
    'g': np.float64,      # np.float128 ; doesn't exist on windows
    'G': np.complex128,   # np.complex256 ; doesn't exist on windows
}


def _supported_float_type(input_dtype, allow_complex=False):
    if isinstance(input_dtype, Iterable) and not isinstance(input_dtype, str):
        return np.result_type(*(_supported_float_type(d) for d in input_dtype))
    input_dtype = np.dtype(input_dtype)
    if not allow_complex and input_dtype.kind == 'c':
        raise ValueError("complex valued input is not supported")
    return new_float_type.get(input_dtype.char, np.float64)


"""ここから
@deprecate_kwarg({'iterations': 'num_iter'}, removed_version="1.0",
                 deprecated_version="0.19")
ここまでの行はコードが複雑にまたがっていてコードを追うのを断念"""
def each_iter_richardson_lucy(image, psf, num_iter=50, clip=True, filter_epsilon=None):
    float_type = _supported_float_type(image.dtype)
    image = image.astype(float_type, copy=False)
    psf = psf.astype(float_type, copy=False)
    im_deconv = np.full(image.shape, 0.5, dtype=float_type)
    psf_mirror = np.flip(psf)
    im_deconvs = np.empty([num_iter+1, *image.shape], dtype=float_type)
    im_deconvs[0] = image

    # Small regularization parameter used to avoid 0 divisions
    eps = 1e-12

    for iter in range(1, num_iter+1):
        conv = convolve(im_deconv, psf, mode="same")
        if filter_epsilon:
            relative_blur = np.where(conv < filter_epsilon, 0, image / conv)
        else:
            relative_blur = image / conv
        im_deconv *= convolve(relative_blur, psf_mirror, mode="same")
        im_deconv_copy = im_deconv.astype(float_type, copy=True)
        if clip:
            im_deconv_copy[im_deconv_copy > 1] = 1
            im_deconv_copy[im_deconv_copy < -1] = -1
        im_deconvs[iter] = im_deconv_copy

    return im_deconvs
コードの説明
解析用に作成したeach_iter_richardson_lucyの戻り値について説明する。
-
obtained_imgをa×b配列、iterations=nとすると、
rl_imgs = each_iter_richardson_lucy(obtained_img, psf, iterations)のrl_imgsは、(n+1)×a×bの3次元配列となる。 -
rl_imgs[0]には、obtained_img(撮像画像)が入る。 -
rl_imgs[1]には、richardson_lucy(obtained_img, psf, 1)とRL法の反復回数1回目の結果が入る。 -
rl_imgs[2]には、richardson_lucy(obtained_img, psf, 2)とRL法の反復回数1回目の結果が入る。 - 以下同様に、
rl_imgs[3], rl_imgs[4], ..., rl_imgs[n]まで、それぞれのRL法の反復回数の結果が入る。
差分画像の解析
差分画像の例
まず、psf_sigma=17の反復回数50回と反復回数51回の差分画像をグラフに表示する。
# 真の画像
true_px = 128
true_img = np.zeros([true_px, true_px])
true_img_xs = [44, 60, 49, 93, 40, 95, 48, 70, 45, 77]
true_img_ys = [77, 34, 77, 61, 57, 38, 89, 36, 30, 42]
for true_img_x, true_img_y in zip(true_img_xs, true_img_ys):
    true_img[true_img_y, true_img_x] = 0.1

# PSF
psf_px = 127
psf_sigma = 17
psf = get_psf(psf_px, psf_sigma)

# 真の画像をPSFで畳み込む(撮像画像)
obtained_img = convolve(true_img, psf, "same")

# RL法
iterations = 101
rl_imgs = each_iter_richardson_lucy(obtained_img, psf, iterations)

fig, (ax1, ax2, ax3, ax4, ax5, ax6) = plt.subplots(figsize=(21, 7), ncols=6)
cbar_min = 1e-5
cbar_max = 1e-2

# 真の画像
ax1.set_title("The true image\n({0}×{0} pixel)".format(true_px))
cbar1 = ax1.imshow(true_img, cmap=cm.CMRmap, vmin=0, vmax=0.1)
ax1.axis("off")
fig.colorbar(cbar1, ax=ax1, orientation="horizontal")

# PSF
ax2.set_title("PSF σ={0}\n({1}×{1} pixel)".format(psf_sigma, psf_px))
psf_display = np.where(psf < cbar_min, cbar_min, psf)
ax2.imshow(psf_display, cmap=cm.CMRmap,
           norm=colors.LogNorm(vmin=cbar_min, vmax=cbar_max))
ax2.axis("off")

# 撮像画像
ax3.set_title("The obtained image\n({0}×{0} pixel)".format(true_px))
obtained_img_display = np.where(obtained_img < cbar_min, cbar_min, obtained_img)
ax3.imshow(obtained_img_display, cmap=cm.CMRmap,
           norm=colors.LogNorm(vmin=cbar_min, vmax=cbar_max))
ax3.axis("off")

# RL法による生成画像(反復回数50回)
rl_img_50 = rl_imgs[50]
ax4.set_title("RL deconvolution\nimage iterations=50")
rl_img_50_display = np.where(rl_img_50 < cbar_min, cbar_min, rl_img_50)
ax4.imshow(rl_img_50_display, cmap=cm.CMRmap,
           norm=colors.LogNorm(vmin=cbar_min, vmax=cbar_max))
ax4.axis("off")

# RL法による生成画像(反復回数51回)
rl_img_51 = rl_imgs[51]
ax5.set_title("RL deconvolution\nimage iterations=51")
rl_img_51_display = np.where(rl_img_51 < cbar_min, cbar_min, rl_img_51)
cbar2 = ax5.imshow(rl_img_51_display, cmap=cm.CMRmap,
                   norm=colors.LogNorm(vmin=cbar_min, vmax=cbar_max))
ax5.axis("off")
fig.colorbar(cbar2, ax=[ax2, ax3, ax4, ax5], orientation="horizontal", aspect=80)

# 差分画像(反復回数51回 - 反復回数50回)
rl_diffs = np.diff(rl_imgs, axis=0)
ax6.set_title("RL deconvolution\ndifference iterations 51-50")
cbar3 = ax6.imshow(rl_diffs[50], cmap=cm.bwr, vmin=-4e-5, vmax=4e-5)
ax6.scatter(true_img_xs, true_img_ys, c="black", marker=".",
            label="true image point sources")
ax6.set_xticks([])
ax6.set_yticks([])
fig.colorbar(cbar3, ax=ax6, orientation="horizontal")
ax6.legend()

plt.show()
右図の差分画像より、真の画像の点源付近で値が正(赤)で、点源から少し離れたところで点源の拡がりの輪郭を取るように値が負(青)になっていることが分かる。
また、反復回数毎に画像の値の総量は変化しないので差分画像の合計は0となり、青の領域から値を奪って赤の領域の値を増加させていることが分かる。
この1枚だけでは反復回数毎の特徴について何とも言えないので、その他のpsf_sigmaと反復回数の差分画像も観ていく。
差分画像
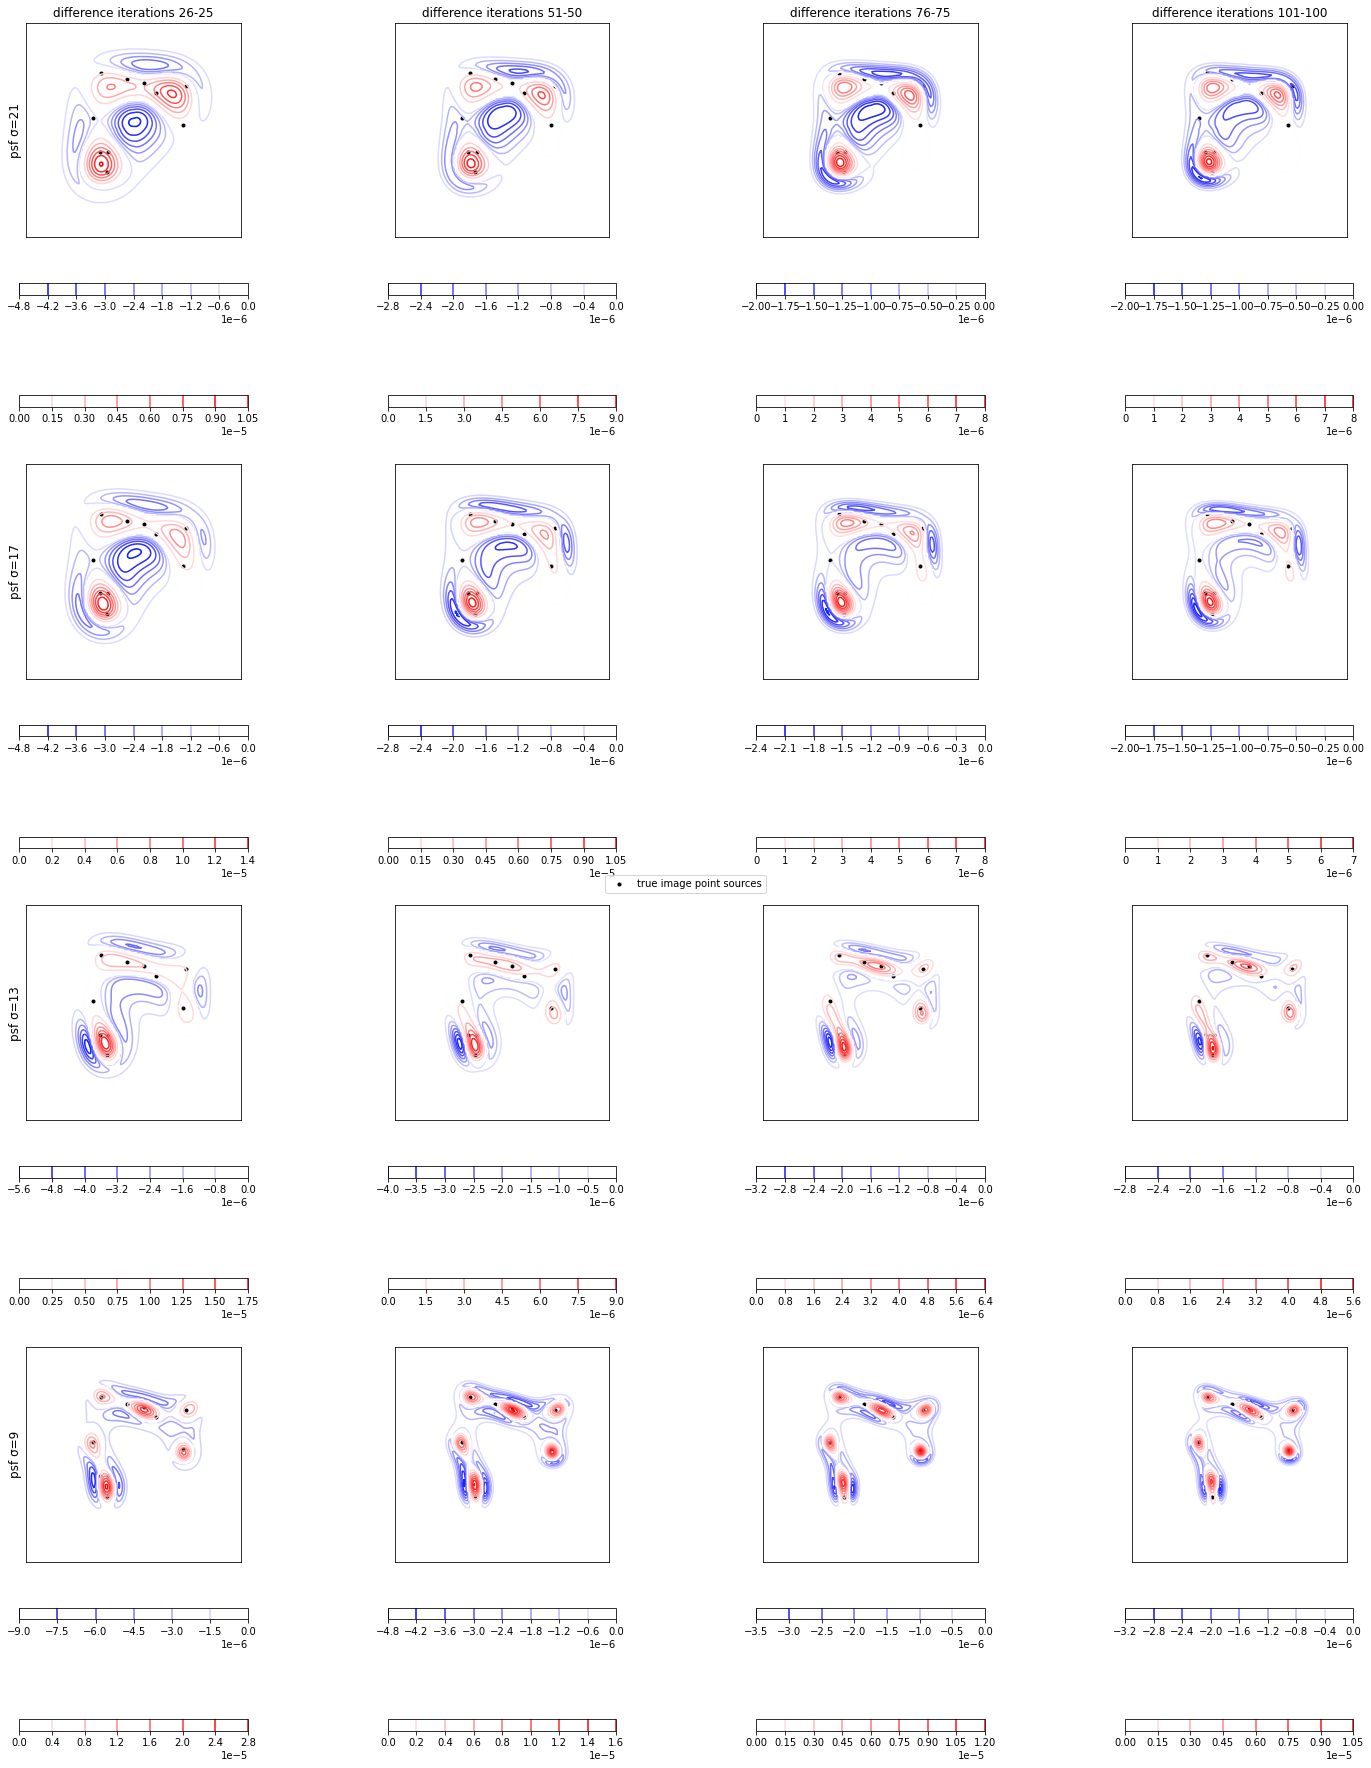
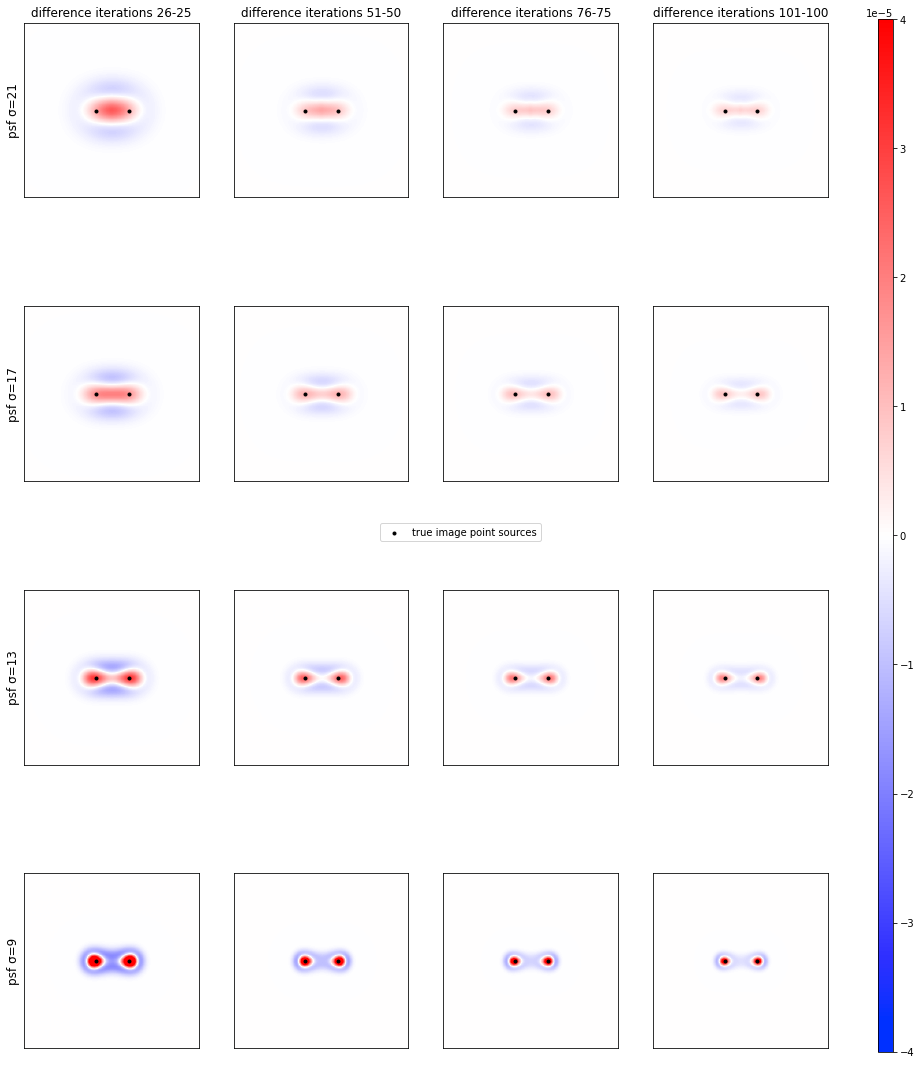
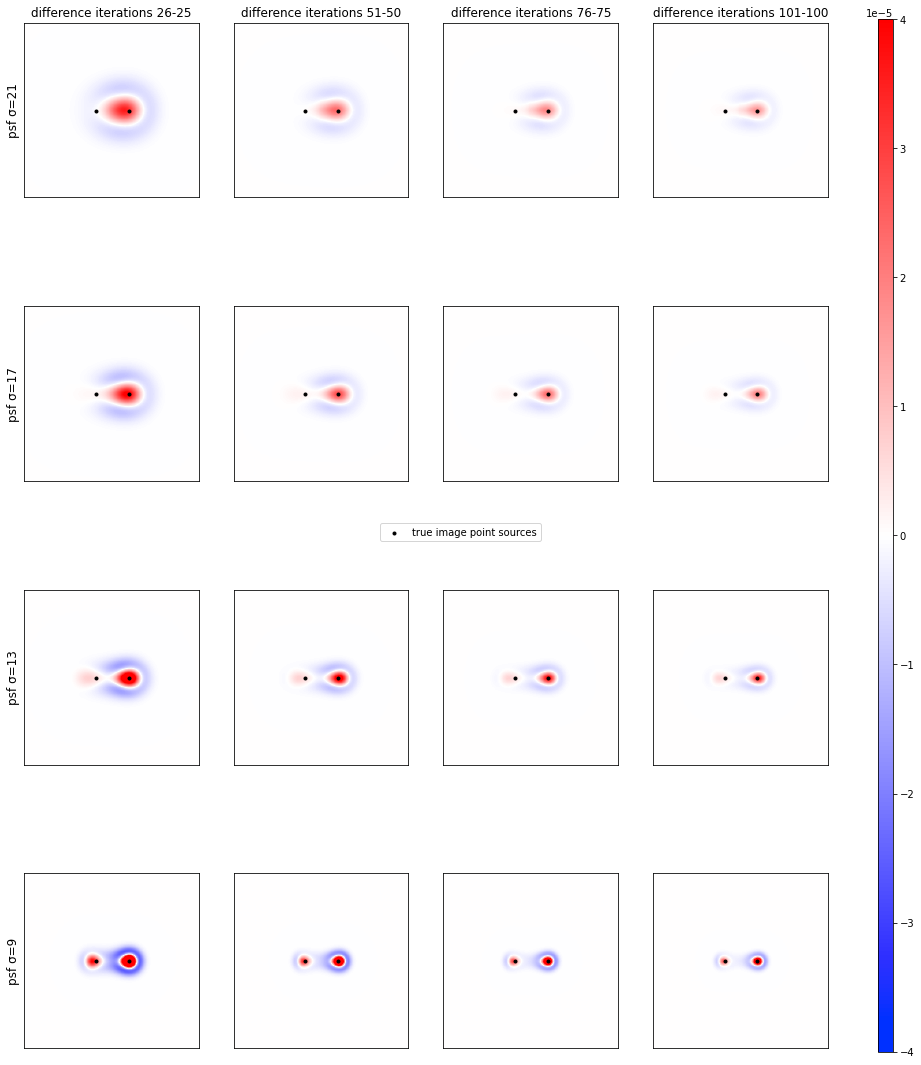
psf_sigma=21, 17, 13, 9の反復回数26-25, 51-50, 76-75, 101-100回の差分画像をグラフに表示する。
# 真の画像
true_px = 128
true_img = np.zeros([true_px, true_px])
true_img_xs = [44, 60, 49, 93, 40, 95, 48, 70, 45, 77]
true_img_ys = [77, 34, 77, 61, 57, 38, 89, 36, 30, 42]
for true_img_x, true_img_y in zip(true_img_xs, true_img_ys):
    true_img[true_img_y, true_img_x] = 0.1

psf_px = 127
psf_sigmas = [21, 17, 13, 9]
iterations = 101
diff_iters = [25, 50, 75, 100]

fig, axs = plt.subplots(4, 4, figsize=(18, 20))
cbar_min = -4e-5
cbar_max = 4e-5

for row, psf_sigma in enumerate(psf_sigmas):
    psf = get_psf(psf_px, psf_sigma)
    obtained_img = convolve(true_img, psf, "same")
    rl_imgs = each_iter_richardson_lucy(obtained_img, psf, iterations)
    rl_diffs = np.diff(rl_imgs, axis=0)
    for col, diff_iter in enumerate(diff_iters):
        rl_diff = rl_diffs[diff_iter]
        cbar = axs[row, col].imshow(rl_diff, cmap=cm.bwr, vmin=cbar_min, vmax=cbar_max)
        axs[row, col].scatter(true_img_xs, true_img_ys, c="black", marker=".",
                              label="true image point sources")

for ax, diff_iter_label in zip(axs[0, :], ["26-25", "51-50", "76-75", "101-100"]):
    ax.set_title(f"difference iterations {diff_iter_label}")
for ax, psf_sigma in zip(axs[:, 0], psf_sigmas):
    ax.set_ylabel(f"psf σ={psf_sigma}", size="large")
for ax in axs.flatten():
    ax.set_xticks([])
    ax.set_yticks([])
lines, labels = fig.axes[0].get_legend_handles_labels()
fig.legend(lines, labels, loc="center")
fig.colorbar(cbar, ax=axs, shrink=0.95, aspect=70)

plt.show()
出力結果

全てのpsf_sigmaにおいて、反復回数が大きくなるにつれて反復回数毎の全体的な変動が小さく(赤青が全体的に薄く)なり、変動している領域も縮小(赤青の部分も縮小)して点源に近づいていくことが分かる。
次は、差分画像の等高線を取ることで反復回数毎の変動の構造を観ていく。
差分画像の等高線
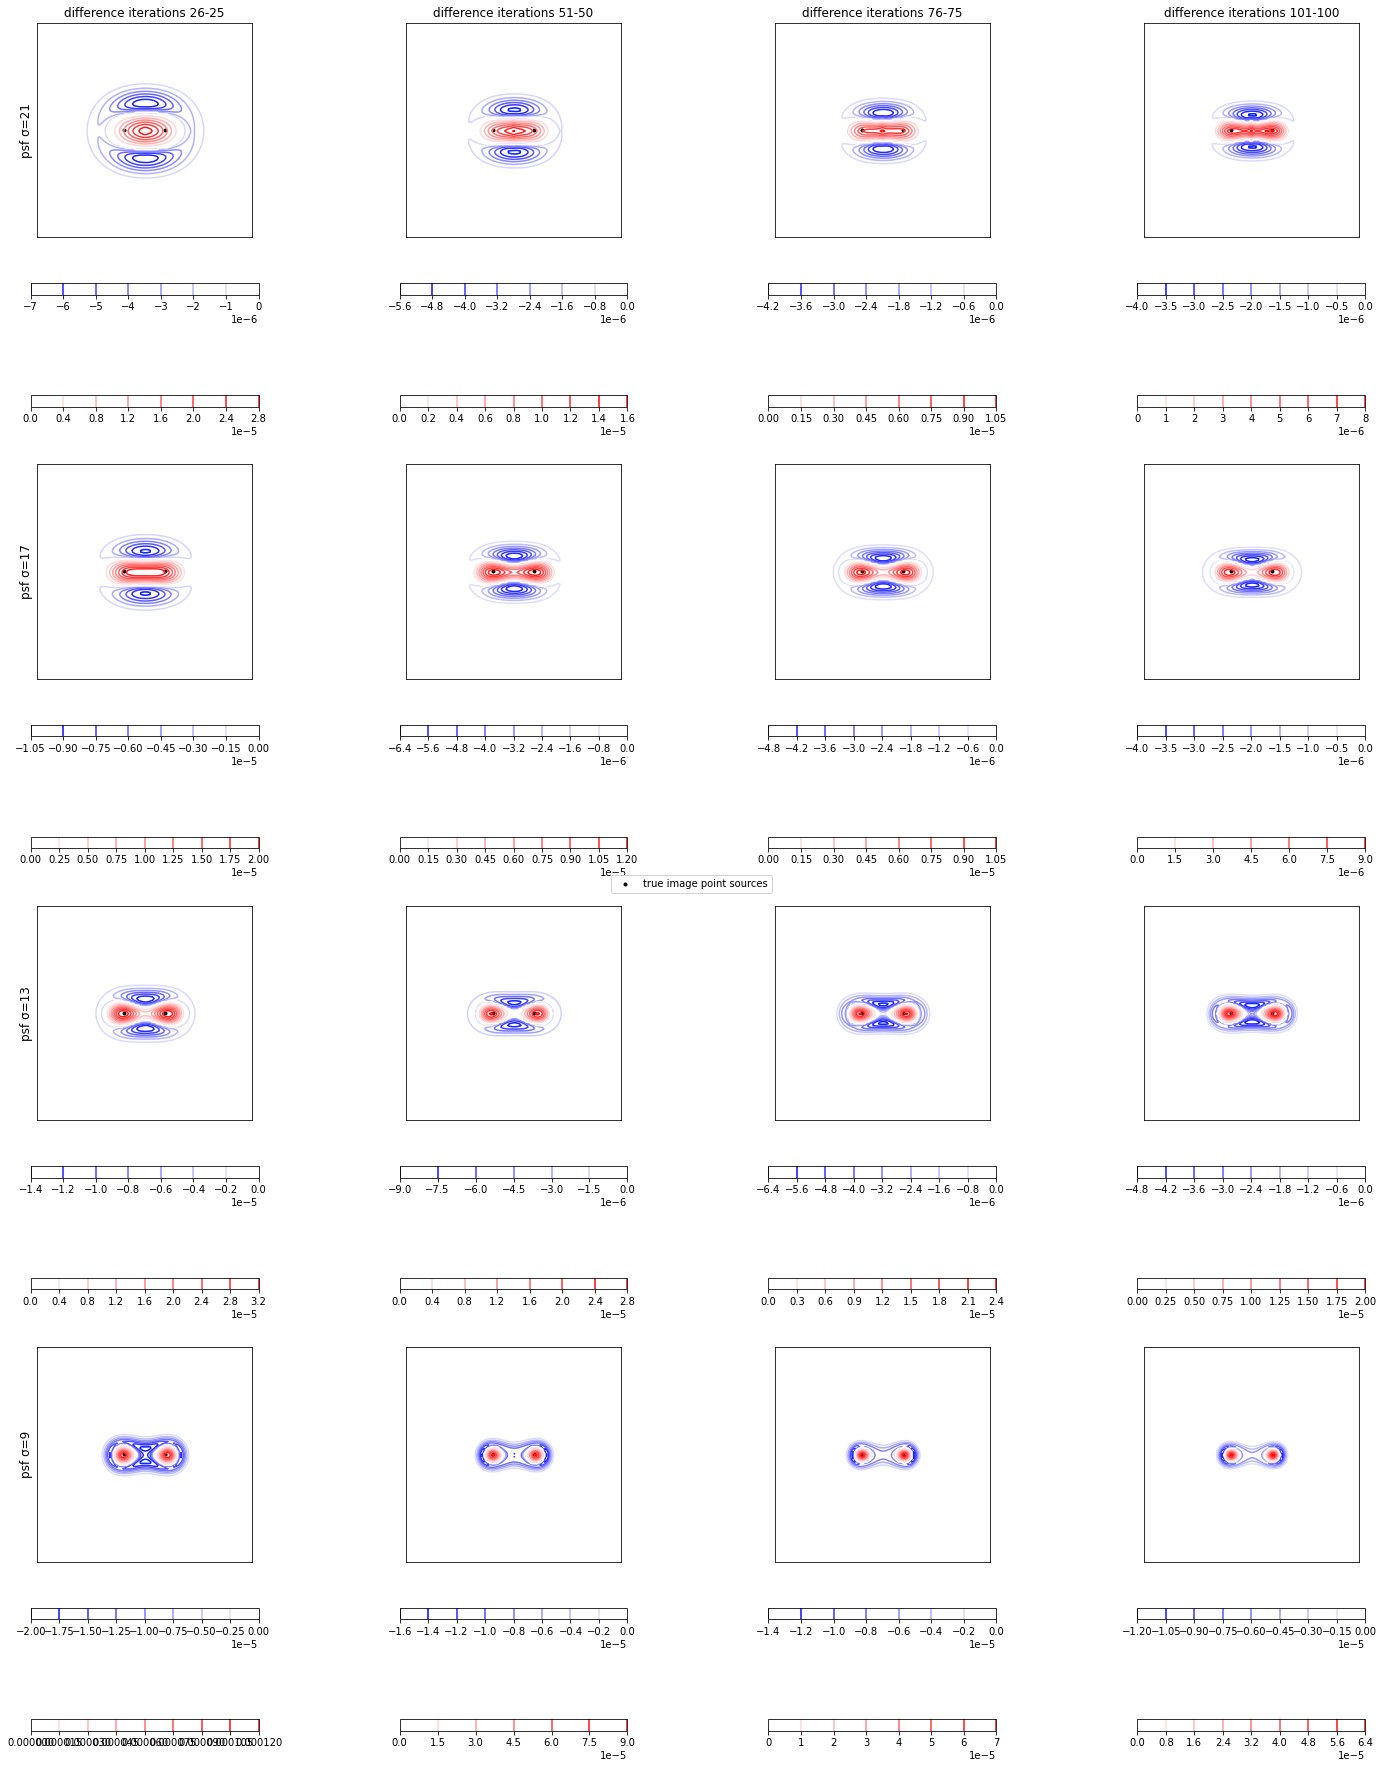
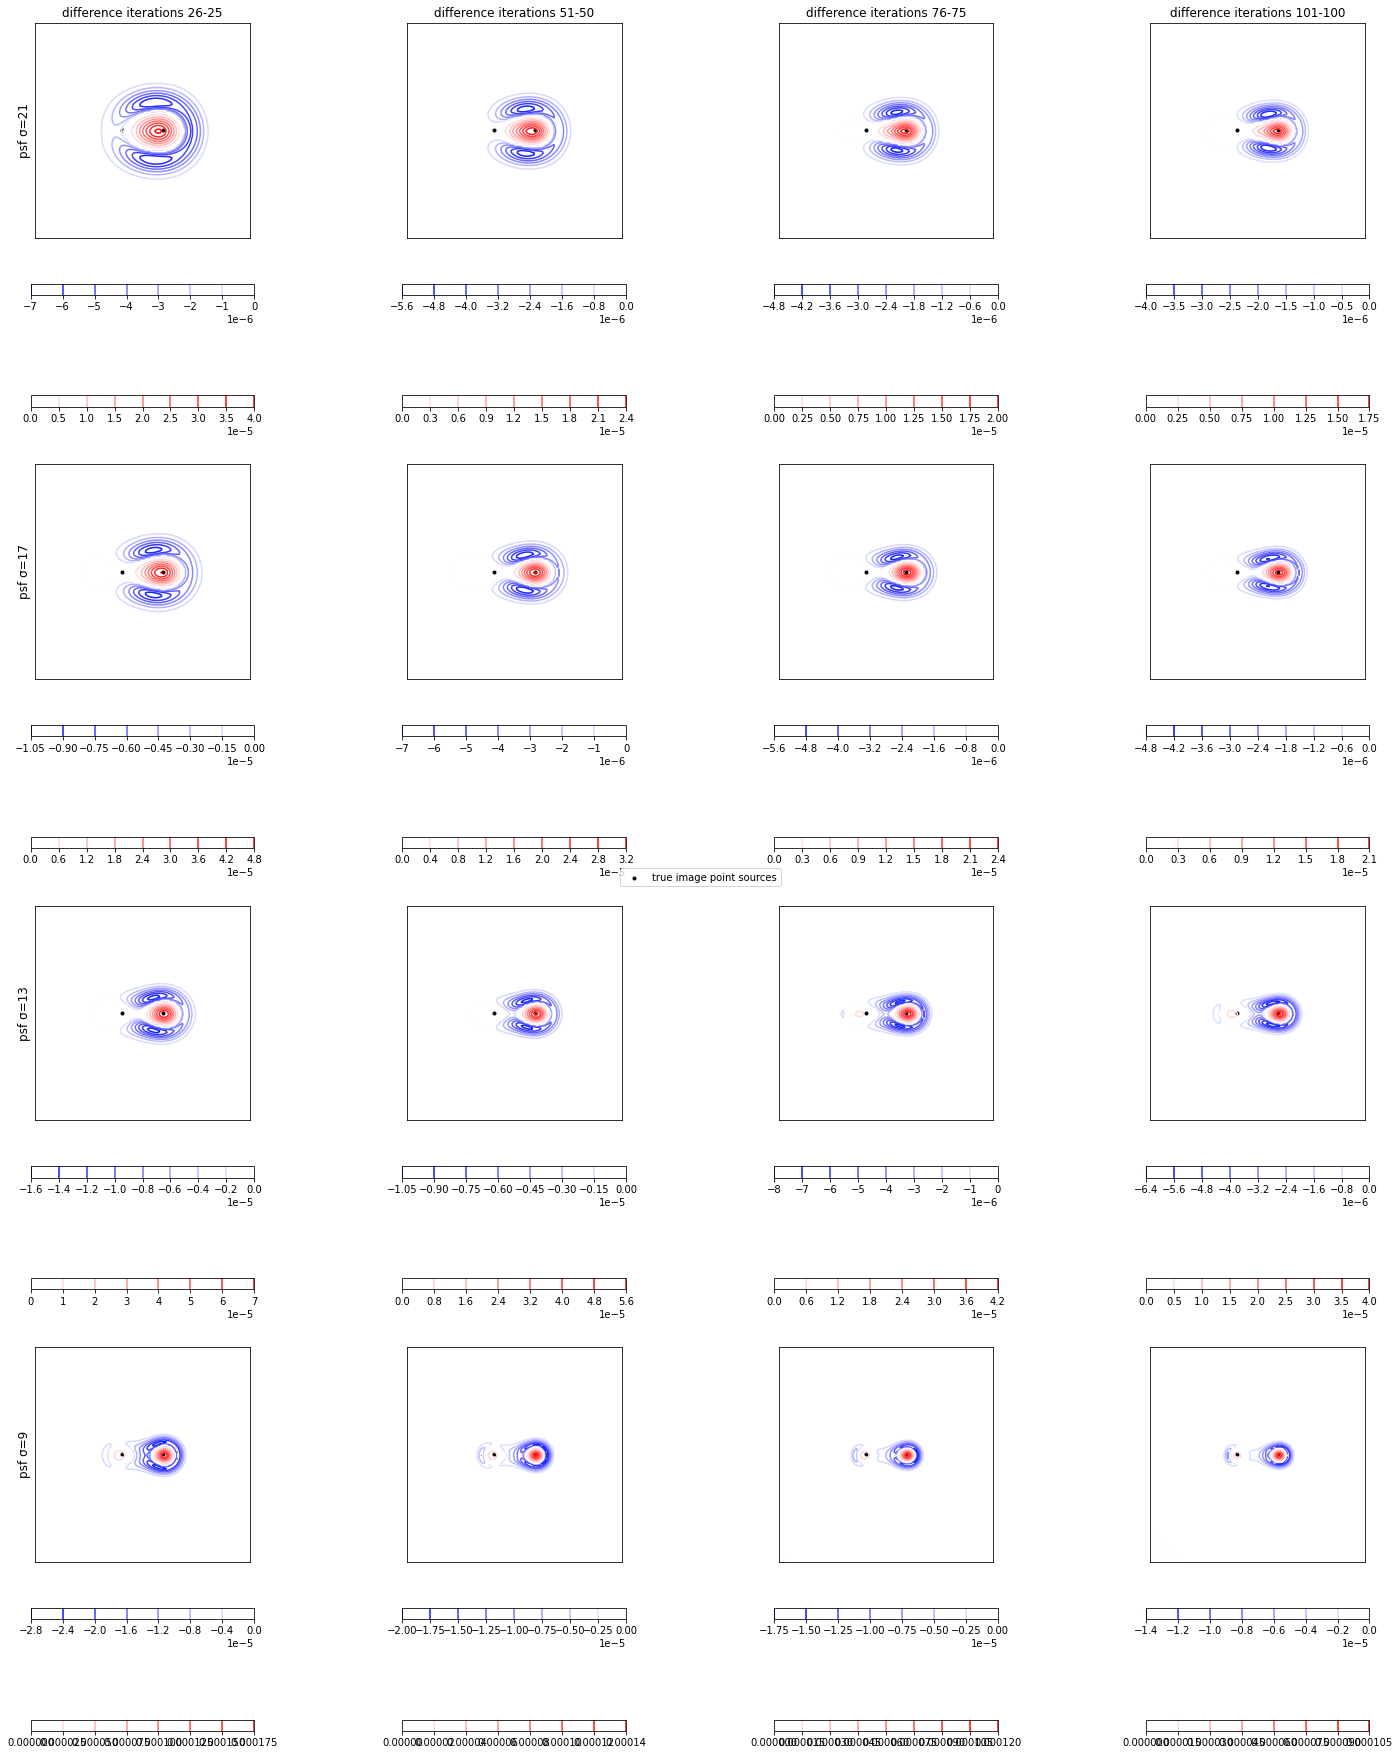
psf_sigma=21, 17, 13, 9の反復回数26-25, 51-50, 76-75, 101-100回の差分画像の等高線をグラフに表示する。
# 真の画像
true_px = 128
true_img = np.zeros([true_px, true_px])
true_img_xs = [44, 60, 49, 93, 40, 95, 48, 70, 45, 77]
true_img_ys = [77, 34, 77, 61, 57, 38, 89, 36, 30, 42]
for true_img_x, true_img_y in zip(true_img_xs, true_img_ys):
    true_img[true_img_y, true_img_x] = 0.1

psf_px = 127
psf_sigmas = [21, 17, 13, 9]
iterations = 101
diff_iters = [25, 50, 75, 100]

fig, axs = plt.subplots(4, 4, figsize=(22, 25))
cbar_min = -4e-5
cbar_max = 4e-5

for row, psf_sigma in enumerate(psf_sigmas):
    psf = get_psf(psf_px, psf_sigma)
    obtained_img = convolve(true_img, psf, "same")
    rl_imgs = each_iter_richardson_lucy(obtained_img, psf, iterations)
    rl_diffs = np.diff(rl_imgs, axis=0)
    for col, diff_iter in enumerate(diff_iters):
        rl_diff = rl_diffs[diff_iter]
        rl_diff_minus = np.where(rl_diff > 0, 0, rl_diff)
        rl_diff_minus_min = np.min(rl_diff_minus)
        rl_diff_plus = np.where(rl_diff < 0, 0, rl_diff)
        rl_diff_plus_max = np.max(rl_diff_plus)
        cbar_minus = axs[row, col].contour(rl_diff_minus, cmap=cm.bwr, origin="upper",
                                           vmin=rl_diff_minus_min, vmax=-rl_diff_minus_min)
        cbar_plus = axs[row, col].contour(rl_diff_plus, cmap=cm.bwr, origin="upper",
                                          vmin=-rl_diff_plus_max, vmax=rl_diff_plus_max)
        axs[row, col].scatter(true_img_xs, [true_px - true_img_y for true_img_y in true_img_ys],
                              c="black", marker=".", label="true image point sources")
        # カラーバー
        fig.colorbar(cbar_plus, ax=axs[row, col], shrink=0.5, orientation="horizontal")
        fig.colorbar(cbar_minus, ax=axs[row, col], shrink=0.5, orientation="horizontal")

for ax, diff_iter_label in zip(axs[0, :], ["26-25", "51-50", "76-75", "101-100"]):
    ax.set_title(f"difference iterations {diff_iter_label}")
for ax, psf_sigma in zip(axs[:, 0], psf_sigmas):
    ax.set_ylabel(f"psf σ={psf_sigma}", size="large")
for ax in axs.flatten():
    ax.set_xticks([])
    ax.set_yticks([])
    ax.set_aspect("equal", adjustable="box")
lines, labels = fig.axes[0].get_legend_handles_labels()
fig.legend(lines, labels, loc="center")

fig.tight_layout()
plt.show()
- 差分画像の正(赤)の値が大きい領域は、その周辺で負(青)の値も大きいことが分かる。
- 差分画像の負(青)の値の局所的ピークが、正(赤)の値の局所的ピークに近いことが分かる。
- 差分画像の負(青)の値は正(赤)の値に比べてのっぺりしていることが分かる。
次は、差分画像のヒストグラムを取ることで差分画像の構造をもう少し詳しく観ていく。
差分画像のヒストグラム
# 真の画像
true_px = 128
true_img = np.zeros([true_px, true_px])
true_img_xs = [44, 60, 49, 93, 40, 95, 48, 70, 45, 77]
true_img_ys = [77, 34, 77, 61, 57, 38, 89, 36, 30, 42]
for true_img_x, true_img_y in zip(true_img_xs, true_img_ys):
    true_img[true_img_y, true_img_x] = 0.1

psf_px = 127
psf_sigmas = [21, 17, 13, 9]
iterations = 101

fig, axs = plt.subplots(4, 4, figsize=(18, 18), sharex=True, sharey=True)
bin_size = np.linspace(-1e-5, 2.5e-5, 150)

for row, psf_sigma in enumerate(psf_sigmas):
    psf = get_psf(psf_px, psf_sigma)
    obtained_img = convolve(true_img, psf, "same")
    rl_imgs = each_iter_richardson_lucy(obtained_img, psf, iterations)
    rl_diffs = np.diff(rl_imgs, axis=0)
    _, _, _ = axs[row, 0].hist(rl_diffs[25].flatten(), bins=bin_size, log=True,
                               label=f"psf σ={psf_sigma},\ndifference iterations 26-25")
    _, _, _ = axs[row, 1].hist(rl_diffs[50].flatten(), bins=bin_size, log=True,
                               label=f"psf σ={psf_sigma},\ndifference iterations 51-50")
    _, _, _ = axs[row, 2].hist(rl_diffs[75].flatten(), bins=bin_size, log=True,
                               label=f"psf σ={psf_sigma},\ndifference iterations 76-75")
    _, _, _ = axs[row, 3].hist(rl_diffs[100].flatten(), bins=bin_size, log=True,
                               label=f"psf σ={psf_sigma},\ndifference iterations 101-100")

for ax in axs[3, :]:
    ax.set_xlabel("value")
for ax in axs[:, 0]:
    ax.set_ylabel("counts")
for ax in axs.flatten():
    ax.legend()

plt.show()
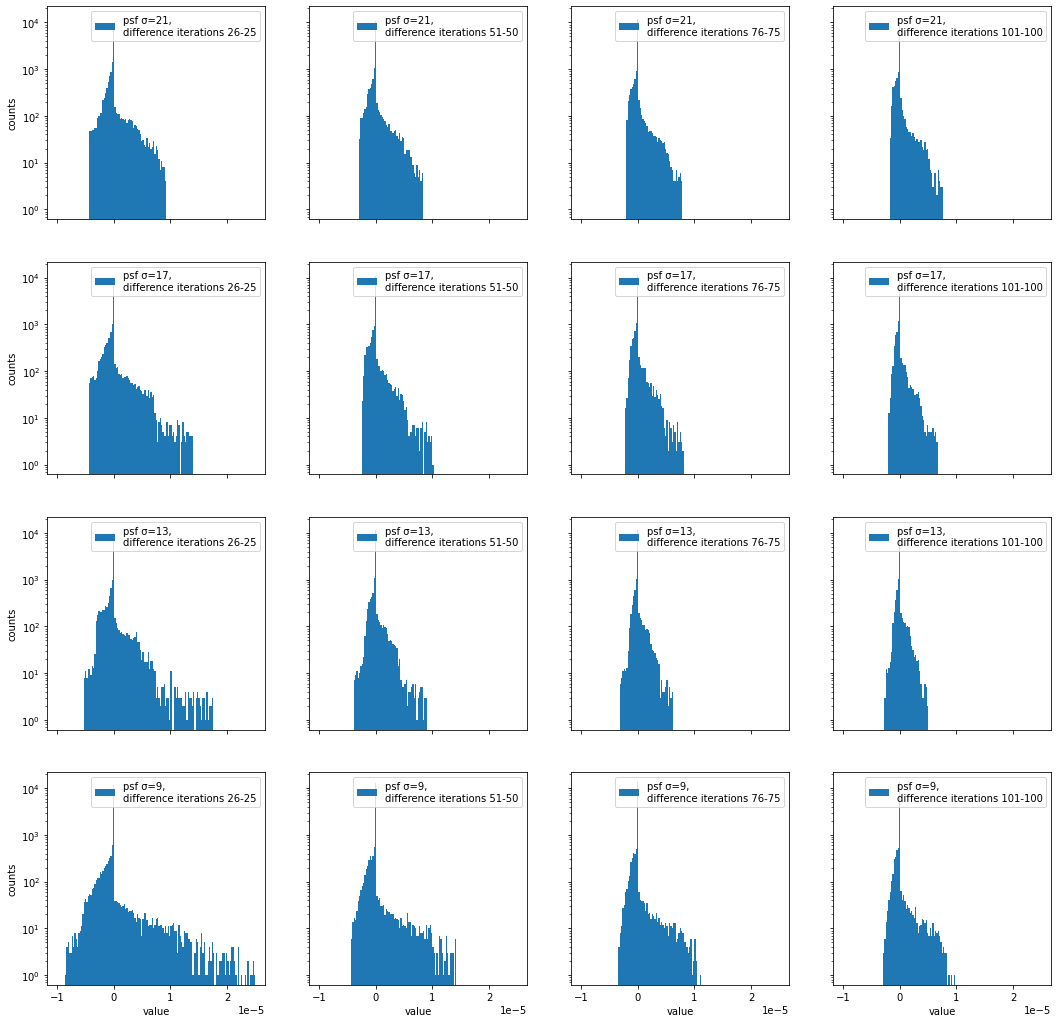
- 0付近のビンが一番カウント数が大きいことが分かる。(ほとんどのピクセルが反復回数毎にほとんど変化していないことを意味する。)
- 0付近から最小値・最大値のビンにかけて、ほぼ単調にカウント数が減少していることが分かる。
- 反復回数が大きくなるにつれて、最小値・最大値が0に近づいていくことが分かる。
- 正の値の方が負の値より拡がった分布を持つことが分かる。
次は、差分画像が収束することを確かめるため、差分画像の絶対値の合計を観ていく。
差分画像の絶対値の合計
# 真の画像
true_px = 128
true_img = np.zeros([true_px, true_px])
true_img_xs = [44, 60, 49, 93, 40, 95, 48, 70, 45, 77]
true_img_ys = [77, 34, 77, 61, 57, 38, 89, 36, 30, 42]
for true_img_x, true_img_y in zip(true_img_xs, true_img_ys):
    true_img[true_img_y, true_img_x] = 0.1

psf_px = 127
psf_sigmas = [21, 17, 13, 9]
iterations = 101
fig, ax = plt.subplots(1, 1, figsize=(5, 5))

for psf_sigma in psf_sigmas:
    psf = get_psf(psf_px, psf_sigma)
    obtained_img = convolve(true_img, psf, "same")
    rl_imgs = each_iter_richardson_lucy(obtained_img, psf, iterations)
    rl_diffs = np.diff(rl_imgs, axis=0)
    rl_diffs_abs = np.abs(rl_diffs)  # 差分画像の絶対値
    rl_diffs_abs_sum = np.sum(rl_diffs_abs, axis=(1,2))  # 差分画像の絶対値の合計
    ax.plot(rl_diffs_abs_sum, label=f"psf σ={psf_sigma}")
ax.set_yscale("log")
ax.set_xlabel("difference iterations n+1 - n")
ax.set_ylabel("abs sum value")
ax.legend()
plt.show()
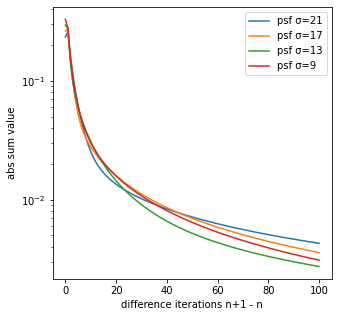
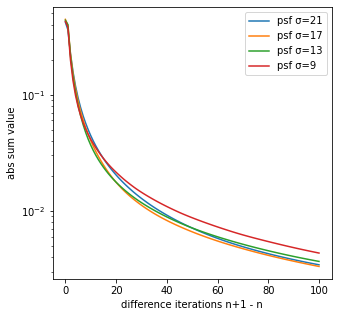
差分画像の絶対値の合計が0に近づくことから、RL法の反復回数毎の生成画像は収束すると考えられる。
次は、差分画像の正のカウント数を観ていく。
差分画像の正のカウント数
# 真の画像
true_px = 128
true_img = np.zeros([true_px, true_px])
true_img_xs = [44, 60, 49, 93, 40, 95, 48, 70, 45, 77]
true_img_ys = [77, 34, 77, 61, 57, 38, 89, 36, 30, 42]
for true_img_x, true_img_y in zip(true_img_xs, true_img_ys):
    true_img[true_img_y, true_img_x] = 0.1

psf_px = 127
psf_sigmas = [21, 17, 13, 9]
iterations = 101
fig, ax = plt.subplots(1, 1, figsize=(5, 5))

for psf_sigma in psf_sigmas:
    psf = get_psf(psf_px, psf_sigma)
    obtained_img = convolve(true_img, psf, "same")
    rl_imgs = each_iter_richardson_lucy(obtained_img, psf, iterations)
    rl_diffs = np.diff(rl_imgs, axis=0)
    plus_val = np.count_nonzero(rl_diffs > 0, axis=(1,2))  # 差分画像の正のカウント数
    ax.plot(plus_val, label=f"psf σ={psf_sigma}")
ax.set_xlabel("difference iterations n+1 - n")
ax.set_ylabel("plus counts")
ax.legend()
plt.show()
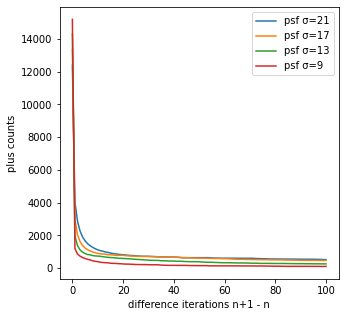
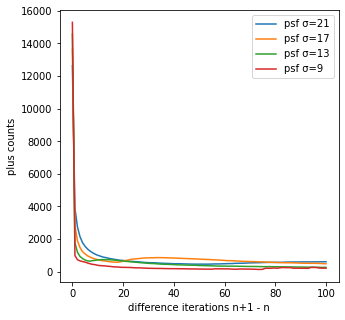
- 反復回数が大きくなるにつれて、正のカウント数も小さくなることが分かる。
-
psf_sigmaが小さいほど正のカウント数が小さくなることが分かる。
補足すると、今回の真の画像は10個の点源なので、反復回数毎に理想的にはその点源のみが常に増加してほしいところではあるが、真の画像を推定するときはそこまでの精度はなく他のピクセルでも増加が起こる。
そのため、psf_sigmaが小さく、反復回数が大きいほど真の画像に近づくため、反復回数毎の正のカウント数が小さくなり真の画像の10個に近づいていく。
次は、差分画像の正負のカウント数の比を観ていく。
差分画像の正負のカウント数の比
# 真の画像
true_px = 128
true_img = np.zeros([true_px, true_px])
true_img_xs = [44, 60, 49, 93, 40, 95, 48, 70, 45, 77]
true_img_ys = [77, 34, 77, 61, 57, 38, 89, 36, 30, 42]
for true_img_x, true_img_y in zip(true_img_xs, true_img_ys):
    true_img[true_img_y, true_img_x] = 0.1

psf_px = 127
psf_sigmas = [21, 17, 13, 9]
iterations = 101
fig, ax = plt.subplots(1, 1, figsize=(5, 5))

for psf_sigma in psf_sigmas:
    psf = get_psf(psf_px, psf_sigma)
    obtained_img = convolve(true_img, psf, "same")
    rl_imgs = each_iter_richardson_lucy(obtained_img, psf, iterations)
    rl_diffs = np.diff(rl_imgs, axis=0)
    minus_val = np.count_nonzero(rl_diffs < 0, axis=(1,2))  # 負のカウント数
    plus_val = np.count_nonzero(rl_diffs > 0, axis=(1,2))  # 正のカウント数
    ratio = minus_val / plus_val
    ax.plot(ratio, label=f"psf σ={psf_sigma}")
ax.set_xlabel("difference iterations n+1 - n")
ax.set_ylabel("ratio (minus / plus counts)")
ax.legend()
plt.show()
出力結果

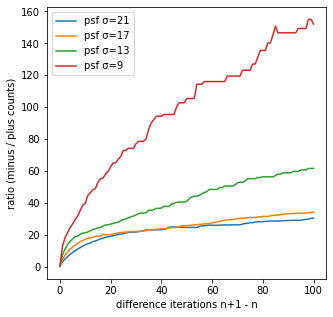
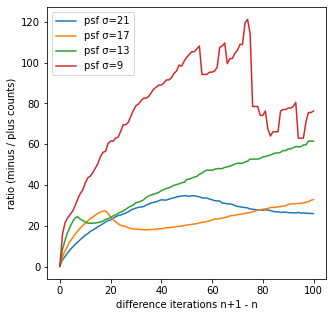
縦軸のratio (minus / plus counts)は、正の値の1個につき、負の値がいくつ存在するかを表している。
psf_sigma=9の反復回数101-100回の差分画像では、正の値が1個当たり、負の値が25個程度存在することが分かる。
つまり、反復回数101-100回のとき、周りの25個程度の値が減少することで、1個の値を増加させていること意味しており、減少しているピクセルに比べて増加しているピクセルは少ないものの、増加量は大きいことが分かる。
その他の解析
合計
# 真の画像
true_px = 128
true_img = np.zeros([true_px, true_px])
true_img_xs = [44, 60, 49, 93, 40, 95, 48, 70, 45, 77]
true_img_ys = [77, 34, 77, 61, 57, 38, 89, 36, 30, 42]
for true_img_x, true_img_y in zip(true_img_xs, true_img_ys):
    true_img[true_img_y, true_img_x] = 0.1

psf_px = 127
psf_sigams = [21, 17, 13, 9]
iterations = 100
fig, ax = plt.subplots(1, 1, figsize=(5, 5))

for psf_sigma in psf_sigams:
    psf = get_psf(psf_px, psf_sigma)
    obtained_img = convolve(true_img, psf, "same")
    rl_imgs = each_iter_richardson_lucy(obtained_img, psf, iterations)
    rl_sums = np.sum(rl_imgs, axis=(1,2))  # 反復回数毎の合計
    print(f"合計 psf σ={psf_sigma} 最大値-最小値", np.max(rl_sums)-np.min(rl_sums), "value")
    ax.plot(rl_sums, label=f"psf σ={psf_sigma}")
ax.set_xlabel("iterations")
ax.set_ylabel("sum value")
ax.legend()
plt.show()
# print文の出力結果
# 合計 psf σ=21 最大値-最小値 3.3306690738754696e-16 value
# 合計 psf σ=17 最大値-最小値 3.3306690738754696e-16 value
# 合計 psf σ=13 最大値-最小値 4.440892098500626e-16 value
# 合計 psf σ=9 最大値-最小値 4.440892098500626e-16 value
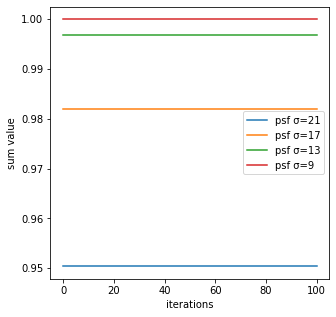
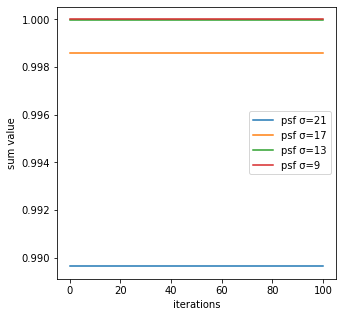
反復回数毎のRL法による生成画像の合計は、ほとんど変動していないことが分かる。
また、今回はture_imgの合計を1と設定しているが、psf_sigmaが大きいほど合計が1より小さく一部欠損していることが分かる。その理由としては、畳み込みによってobtained_imgを作るが、psf_sigmaが大きいほど画像の縁の部分がはみ出てしまうからである。
最小値
# 真の画像
true_px = 128
true_img = np.zeros([true_px, true_px])
true_img_xs = [44, 60, 49, 93, 40, 95, 48, 70, 45, 77]
true_img_ys = [77, 34, 77, 61, 57, 38, 89, 36, 30, 42]
for true_img_x, true_img_y in zip(true_img_xs, true_img_ys):
    true_img[true_img_y, true_img_x] = 0.1

psf_px = 127
psf_sigams = [21, 17, 13, 9]
iterations = 100
fig, ax = plt.subplots(1, 1, figsize=(5, 5))

for psf_sigma in psf_sigams:
    psf = get_psf(psf_px, psf_sigma)
    obtained_img = convolve(true_img, psf, "same")
    rl_imgs = each_iter_richardson_lucy(obtained_img, psf, iterations)
    rl_mins = np.min(rl_imgs, axis=(1,2))  # 反復回数毎の最小値
    ax.plot(rl_mins, label=f"psf σ={psf_sigma}")
ax.set_yscale("log")
ax.set_xlabel("iterations")
ax.set_ylabel("min value")
ax.legend()
plt.show()
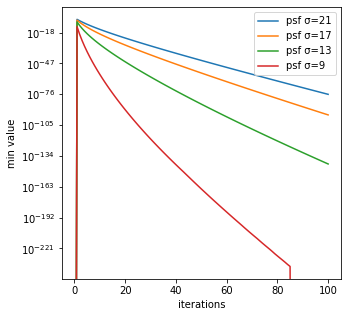
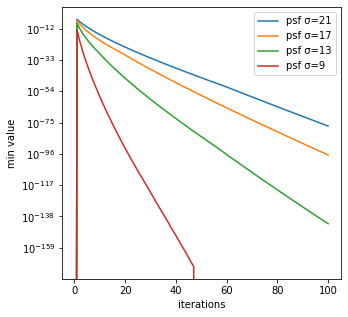
反復回数毎のRL法による生成画像の最小値は、psf_sigmaが小さいほど大きいことが分かる。
$10^{-200}$のようにほとんど0に近い値の最小値を取ることが分かる。ところで、RL法のコード内では1つ前の反復回数の値を分母に使い次の反復回数を結果を計算するため、このような非常に小さい値で割るとゼロ除算のエラーが起こる場合がある。それを回避するために、scikit-imageのrestoration.richardson_lucyは、Version 0.19.1でAdd small regularization to avoid zero-division in richardson_lucy (gh-5976))と説明の上、コードが改善されている。本記事は、執筆時点(2022/03/31)でのGoogle Colab対応のVersion 0.18.3に従ってコードを作成しているため、このような非常に小さい値が出ている。
最大値
# 真の画像
true_px = 128
true_img = np.zeros([true_px, true_px])
true_img_xs = [44, 60, 49, 93, 40, 95, 48, 70, 45, 77]
true_img_ys = [77, 34, 77, 61, 57, 38, 89, 36, 30, 42]
for true_img_x, true_img_y in zip(true_img_xs, true_img_ys):
    true_img[true_img_y, true_img_x] = 0.1

psf_px = 127
psf_sigams = [21, 17, 13, 9]
iterations = 100
fig, ax = plt.subplots(1, 1, figsize=(5, 5))

for psf_sigma in psf_sigams:
    psf = get_psf(psf_px, psf_sigma)
    obtained_img = convolve(true_img, psf, "same")
    rl_imgs = each_iter_richardson_lucy(obtained_img, psf, iterations)
    rl_maxs = np.max(rl_imgs, axis=(1,2))  # 反復回数毎の最大値
    ax.plot(rl_maxs, label=f"psf σ={psf_sigma}")
ax.set_ylim(bottom=0)
ax.set_xlabel("iterations")
ax.set_ylabel("max value")
ax.legend()
plt.show()
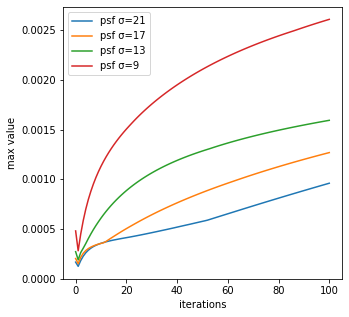
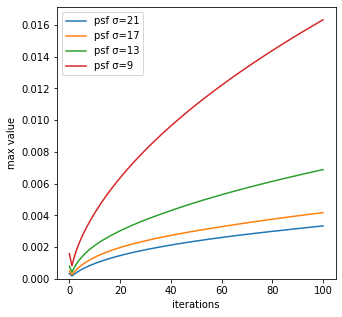
反復回数毎のRL法による生成画像の最大値は、psf_sigmaが小さいほど大きく変化していることが分かる。
最大値の変化率は、obtained_img(反復回数0回)と反復回数1回で1度小さくなっていることが分かる。実はscikit-imageのRL法のコードは、漸化式の始まりである反復回数0回に使っている画像はobtained_imgではないのである。
RL法のソースコードをよく眺めると
im_deconv = np.full(image.shape, 0.5, dtype=float_type)
という1行に気づくと思う。これが反復回数0回に使っている画像である。np.fullは全ての値を同じ値を入れるので、全ての値に0.5を入れたものを反復回数0回の画像としている。一方、今回each_iter_richardson_lucyでは、obtained_imgを反復回数0回と定義したため、グラフが不連続的となっている。
個人的にはobtained_imgが真の画像に比較的近いはずであり、反復回数0回の画像に相応しい気がするが、おそらくローカル・ミニマムを避けるため全て同じ値を入れたフラットな画像を使用していると考えられる。
ここで、ある読者はこう思う気がする。全てを同じ値を入れるのは理解できたが、全て0.5を入れるとobtained_imgとピクセル値の合計が合わないので計算が合わなくなるのではないだろうか。これについて問題はないことを数式で簡単に説明する。
RLの理論式は
 W_{i,r+1} = W_{i,r}\sum_k \frac{P_{i,k}H_k}{\sum_j P_{j,k}W_{j,r}}\
\quad r = 0,\ 1,\  2,\  \dots
と表され、反復回数1回目の結果は$r=0$を代入して
W_{i,1} = W_{i,0}\sum_k \frac{P_{i,k}H_k}{\sum_j P_{j,k}W_{j,0}}
となる。
ここで、反復回数0回の画像と撮像画像の間に$W_0=H$が成り立つとき、任意の$a$倍の$W_0^{\prime}$である$W_0^{\prime}=aW_0\ (a>0)$では、$A = \frac{1}{a}$とおくと
\begin{align}
W_{i,1} = W_{i,0}\sum_k \frac{P_{i,k}H_k}{\sum_j P_{j,k}W_{j,0}} &= AW^{\prime}_{i,0}\sum_k\frac{P_{i,k}H_k}{\sum_j P_{j,k}AW^{\prime}_{j,0}}\\
&= AW^{\prime}_{i,0}\sum_k \frac{P_{i,k}H_k}{A\sum_j P_{j,k}W^{\prime}_{j,0}}\\
&= W^{\prime}_{i,0}\sum_k \frac{P_{i,k}H_k}{\sum_j P_{j,k}W^{\prime}_{j,0}}
\end{align}
となる。つまり、$A$に依らないため反復回数0回(${W_0}$)に使う画像の合計は任意のもので良い。
中央値と平均
# 真の画像
true_px = 128
true_img = np.zeros([true_px, true_px])
true_img_xs = [44, 60, 49, 93, 40, 95, 48, 70, 45, 77]
true_img_ys = [77, 34, 77, 61, 57, 38, 89, 36, 30, 42]
for true_img_x, true_img_y in zip(true_img_xs, true_img_ys):
    true_img[true_img_y, true_img_x] = 0.1

psf_px = 127
psf_sigams = [21, 17, 13, 9]
iterations = 100
fig, ax = plt.subplots(1, 1, figsize=(5, 5))

for psf_sigma in psf_sigams:
    psf = get_psf(psf_px, psf_sigma)
    obtained_img = convolve(true_img, psf, "same")
    rl_imgs = each_iter_richardson_lucy(obtained_img, psf, iterations)
    rl_medians = np.median(rl_imgs, axis=(1,2))  # 反復回数毎の中央値
    rl_averages = np.average(rl_imgs, axis=(1,2)) # 反復回数毎の平均
    ax.plot(rl_medians, label=f"psf σ={psf_sigma} median")
    ax.plot(rl_averages, linestyle="--", label=f"psf σ={psf_sigma} average")
ax.set_yscale("log")
ax.set_xlabel("iterations")
ax.set_ylabel("median value")
ax.legend()
plt.show()
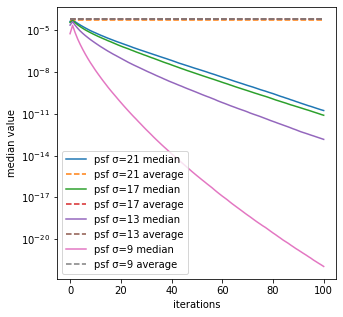
反復回数毎のRL法による生成画像の中央値は、psf_sigmaが小さく反復回数が大きいほど、小さいことが分かる。
また、RL法による生成画像の平均に比べて中央値が小さいことが分かる。
このことから、psf_sigmaが小さく反復回数が大きいほど、画像の大部分の値が小さく一部の値が大きくなっていることが分かる。
分散
# 真の画像
true_px = 128
true_img = np.zeros([true_px, true_px])
true_img_xs = [44, 60, 49, 93, 40, 95, 48, 70, 45, 77]
true_img_ys = [77, 34, 77, 61, 57, 38, 89, 36, 30, 42]
for true_img_x, true_img_y in zip(true_img_xs, true_img_ys):
    true_img[true_img_y, true_img_x] = 0.1

psf_px = 127
psf_sigams = [21, 17, 13, 9]
iterations = 100
fig, ax = plt.subplots(1, 1, figsize=(5, 5))

for psf_sigma in psf_sigams:
    psf = get_psf(psf_px, psf_sigma)
    obtained_img = convolve(true_img, psf, "same")
    rl_imgs = each_iter_richardson_lucy(obtained_img, psf, iterations)
    rl_vars = np.var(rl_imgs, axis=(1,2))  # 反復回数毎の分散
    ax.plot(rl_vars, label=f"psf σ={psf_sigma}")
ax.set_ylim(bottom=0)
ax.set_xlabel("iterations")
ax.set_ylabel("var value")
ax.legend()
plt.show()
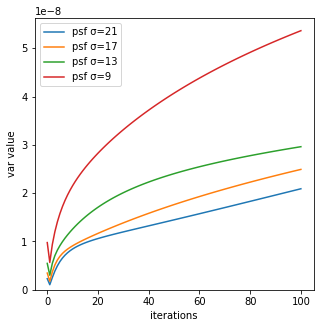
反復回数毎のRL法による生成画像の分散は、psf_sigmaが小さく反復回数が大きいほど、画像の値のばらつきが激しいことが分かる。
重心
def get_gravity(image):
    M = cv2.moments(image)
    gravity_x = M["m10"] / M["m00"]
    gravity_y = M["m01"] / M["m00"]
    return gravity_x, gravity_y

# 真の画像
true_px = 128
true_img = np.zeros([true_px, true_px])
true_img_xs = [44, 60, 49, 93, 40, 95, 48, 70, 45, 77]
true_img_ys = [77, 34, 77, 61, 57, 38, 89, 36, 30, 42]
for true_img_x, true_img_y in zip(true_img_xs, true_img_ys):
    true_img[true_img_y, true_img_x] = 0.1

psf_px = 127
psf_sigams = [21, 17, 13, 9]
iterations = 100
fig, (ax1, ax2) = plt.subplots(1, 2, figsize=(10, 5))

# 真の画像と真の画像の重心
ax1.set_title("The true image\n({0}×{0} pixel)".format(true_px))
cbar1 = ax1.imshow(true_img, cmap=cm.CMRmap, vmin=0, vmax=0.1)
true_gravity_xs, true_gravity_ys = get_gravity(true_img)
ax1.scatter(true_gravity_xs, true_gravity_ys, s=400, c="white", marker="*",
            label="true image gravity")
ax1.set_xlabel("x pixel")
ax1.set_ylabel("y pixel")
ax1.legend()
fig.colorbar(cbar1, ax=ax1)

# 真の画像の重心(2つ目のグラフ用)
ax2.scatter(true_gravity_xs, true_gravity_ys, s=900, c="silver", marker="*",
            label="true image")

for psf_sigma in psf_sigams:
    psf = get_psf(psf_px, psf_sigma)
    obtained_img = convolve(true_img, psf, "same")
    rl_imgs = each_iter_richardson_lucy(obtained_img, psf, iterations)
    rl_gravity_xs = np.empty(iterations+1)
    rl_gravity_ys = np.empty(iterations+1)
    for iter, rl_img in enumerate(rl_imgs):
        rl_gravity_xs[iter], rl_gravity_ys[iter] = get_gravity(rl_img)
    ax2.scatter(rl_gravity_xs[0], rl_gravity_ys[0], s=100, marker="X",
                label=f"psf σ={psf_sigma} iter 0")
    cbar2 = ax2.scatter(rl_gravity_xs, rl_gravity_ys, s=10,
                        c=np.arange(iterations+1), cmap=cm.jet, marker="o")
    ax2.plot(rl_gravity_xs, rl_gravity_ys, lw=0.5, label=f"psf σ={psf_sigma}")
ax2.invert_yaxis()
ax2.set_xlabel("x pixel")
ax2.set_ylabel("y pixel")
ax2.legend(title="gravity")
fig.colorbar(cbar2, ax=ax2, label="iterations")
fig.tight_layout()
plt.show()
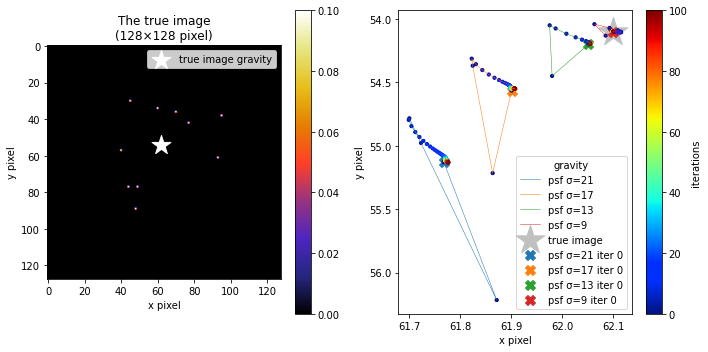
反復回数毎のRL法による生成画像の重心の変動は、psf_sigmaが大きいほど大きいことが分かる。
ただし、重心の変動は最大で2 pixelほどであまり大きく変化していないことから、RL法は上手く真の画像を推定できていると思われる。
というのも、真の画像の重心と畳み込み処理をした後の撮像画像の重心そのものは変わらないからである。図を使って1次元の畳み込みの重心をプロットして補足すると、

となる。上図のように、重心が変化しないのは単にPSFで畳み込まれるので、真の画像の個々の要素に分解したそれぞれの重心は真の画像の信号と同じ座標である。その逆畳み込みであるRL法も、分布が真の画像に近づくだけであるならば重心は変化しないはずであり、今回のシミュレーションでもそれが2 pixel程度しか変化していないことが分かる。このことから、RL法は確かに逆畳み込みができていて、上手く真の画像を推定できていると思われる。
他のサンプルでの解析結果
真の画像が点源の場合と偏りのある点源の場合の2つの解析結果を観ていく。なお、実装コードは記事に掲載すると分量が多くなるため、Google Colabにこちら掲載する。
点源の場合
点源の場合
# 真の画像
true_px = 128
true_img = np.zeros([true_px, true_px])
true_img_xs = [52, 76]
true_img_ys = [64, 64]
true_img[true_img_ys[0], true_img_xs[0]] = 0.5
true_img[true_img_ys[1], true_img_xs[1]] = 0.5
差分画像の例
差分画像
差分画像の等高線
差分画像のヒストグラム
差分画像の絶対値の合計
差分画像の正のカウント数
差分画像の正負のカウント数の比
合計
合計 psf σ=21 最大値-最小値 4.440892098500626e-16 value
合計 psf σ=17 最大値-最小値 3.3306690738754696e-16 value
合計 psf σ=13 最大値-最小値 4.440892098500626e-16 value
合計 psf σ=9 最大値-最小値 5.551115123125783e-16 value
最小値
最大値
中央値と平均
重心
偏りのある点源の場合
偏りのある点源の場合
# 真の画像
true_px = 128
true_img = np.zeros([true_px, true_px])
true_img_xs = [52, 76]
true_img_ys = [64, 64]
true_img[true_img_ys[0], true_img_xs[0]] = 0.2
true_img[true_img_ys[1], true_img_xs[1]] = 0.8
差分画像の例
差分画像
差分画像の等高線
差分画像のヒストグラム
差分画像の絶対値の合計
差分画像の正のカウント数
差分画像の正負のカウント数の比
差分画像の正負のカウント数の比が単調に増加していないのは、反復回数が小さい場合は2つの点源を見分けられていないためであると考えられる。つまり、ある反復回数のとき2つの点源を見分けられ、その結果として差分画像の正のカウント数が増えるため正負のカウント数の比が減少していると考えられる。
合計
合計 psf σ=21 最大値-最小値 4.440892098500626e-16 value
合計 psf σ=17 最大値-最小値 3.3306690738754696e-16 value
合計 psf σ=13 最大値-最小値 5.551115123125783e-16 value
合計 psf σ=9 最大値-最小値 4.440892098500626e-16 value
最小値
最大値
中央値と平均
分散
重心
まとめ
真の画像とPSFが完全にわかっていて、かつノイズが乗らない理想的な状況でのシミュレーションの解析結果から、わかったことや考えらることを以下にまとめる。
- RL法の差分画像の全体的な解析から、反復回数が小さいときは急激に画像が変化していることがわかった。
- RL法の差分画像の等高線から、反復回数毎に急激に増加している領域の周辺に急激に減少している領域があることがわかった。
- RL法の差分画像の等高線から、増加している領域に比べて減少している領域がのっぺりしていることがわかった。
- RL法の差分画像の絶対値の合計が0に近づくことから、RL法の反復回数毎の生成画像は収束すると考えられる。
- RL法の反復回数毎の生成画像の合計はほとんど一定であることがわかった。
- RL法のの反復回数毎の生成画像の重心はほとんど一定であることがわかった。
後編ではRL法の補足事項を記事にする予定である。
参考文献
- Richardson, William Hadley. 1972, JOSA, 62, 55–59
- Lucy, L. B. 1974, Astronomical Journal, 79, 745–754

