
From 3 Hours to 5 Seconds: How I Stopped Hand-Fixing Slides in Inkscape
Introduction
I develop a self-made Python prediction system (V5py / V58py) that calculates prediction scores for horse races, and I publish the weekly results as videos on my YouTube channel, "71-Year-Old Retired Old Man's Horse Racing Gazette" (71才隠居ジジィの競馬新聞).
In my previous article, "How I Cut Slide Production for YouTube Videos from 20 Hours to 3 Hours," I wrote about how スライド画像加工.py (Slide Image Processor), which converts xlsx prediction tables directly into SVG slides, cut the slide-production time for one video from 20 hours down to 3 hours.
This article is the sequel. Those 3 hours still included time for "generate everything automatically, then open Inkscape and manually touch up a few slides." This is the story of how I got that touch-up work down to zero — from 3 hours to 1.5 hours, and finally to 5 seconds — covering development from mid-to-late July 2026.
Tools Built This Time
| Tool | Role |
|---|---|
batch_slide_auto.py |
Imports スライド画像加工.py unmodified and runs steps ①–④ plus automatic text insertion in a single non-interactive batch pass |
json_to_text.py |
Converts Claude.ai conversation exports (JSON) into text with Japanese translations attached — used to organize source material for development records like this article |
The main script, スライド画像加工.py itself, also went through more than 30 changes, big and small, from No.25 through No.60 during this period.
Starting Point: Slides That "Worked, But Only If You Fixed Them in Inkscape"
By the end of the previous article, I had a working system that automatically composited xlsx tables onto SVG slides. But once I actually ran it week after week, a few "technically works, but subtly off" issues remained:
- 馬柱5走 (5-Race Chart): for races with unusually few or many past-race entries, the table would overlap the character illustration, or stretch/shrink unnaturally.
- 推しレース表 (Featured-Race Table): the small "top 5 picks" table would end up positioned awkwardly relative to the main table and the character illustration.
- 予想表 (Prediction Table): the three tables (rankings, score breakdown, betting suggestions) had inconsistent heights, which I kept having to line up by hand in Inkscape every time.
My client's (Yuji's) request was consistent throughout:
"What I want is slides that don't need any fixing in Inkscape once they're generated."
Below are the three design shifts I made to achieve "no fixing in Inkscape," followed by an extension of that idea — the marker-based approach — that went a step further.
① 馬柱5走 (5-Race Chart): From Hardcoded Placements to "Measured Lookup + Non-Distorting Fallback"
The position and height of the table differ completely depending on the number of past races (N). At first, I only measured and registered manually-adjusted values from Inkscape for N=2 through 4.
_BASYU_PLACEMENT = {
    1: {"x": 77, "y": 382, "height": 298},
    2: {"x": 86, "y": 203, "height": 511},
    3: {"x": 95, "y": 160, "height": 571},
    4: {"x": 88, "y": 150, "height": 562},
    5: {"x": 86, "y": 135, "height": 562},
}
Since the relationship between past-race count and position/height wasn't a clean linear formula, I used this measured lookup-table approach instead of a proportional calculation. The problem was what to do as a fallback for any N that wasn't registered. My first attempt applied a uniform average height across the registered values, but this unnaturally stretched N with little content (like a single past race) while squashing N with a lot of content — a vertical distortion.
"Switching to the code-based fallback shifted the table's position and shape on more than half the slides."
The fix required a change in thinking. Just like width, height should also stay at its native 100% scale (no distortion) — only the position should shift so the table's vertical center aligns with the character illustration's vertical center. What needed to match wasn't "visual size," but a shared centerline. In the end, I formally registered measured values for N=1 and N=5 into the lookup table as well, and the fallback now exists purely as insurance for whenever N=6 or higher eventually shows up.
② 推しレース表 (Featured-Race Table): From "Anchored to the Character" to "Positioned Relative to the Actually-Rendered Table"
The placement of the small "top 5 picks" excerpt table was originally designed as "centered directly above the character illustration, within the character's width." This drew a pointed critique:
"There are multiple elements placed on the slide, each with their own position — why would you design this without considering the balance between them?"
The slide contains three elements — the large table, the small table, and the character — yet the small table's position was determined by looking only at the character. Naturally, this broke its relationship with the large table. After the fix, the design uses the actual rendered width of the large table (main_w, now returned as a value) and centers the small table within the full space from "the large table's actual right edge" to "the canvas's right edge."
main_w, _main_h = _place_part_svg(
    root, main_path, _V10_START_X, _V10_START_Y,
    left_box_w, left_box_h, scale, target_scale=_V10_MAIN_TARGET_SCALE,
    scale_x_mult=main_scale_x_mult, scale_y_mult=main_scale_y_mult,
    fill_box_width=main_fill_box_width)

if top5_path is not None:
    top_zone_x = _V10_START_X + main_w + _V10_GAP
    top_box_w = canvas_w - top_zone_x
    top_box_h = bbox["y"] - _V10_GAP - _V10_START_Y
    _place_part_svg(root, top5_path, top_zone_x, _V10_START_Y,
                     top_box_w, top_box_h, scale, target_scale=1.0, center_x=True,
                     center_bias=_OSHI_TOP5_CENTER_BIAS, ...)
Rather than hardcoded coordinates, calculating one element's placement from the measured values of a neighboring element — this turned out to be the way to build layouts that don't break every time the underlying data changes.
③ 予想表 (Prediction Table): The Answer — "Only Width Needs to Match" — After Two Failed Attempts
The three tables (rankings, score breakdown, betting suggestions) have different row counts, so simply stacking them naively makes their vertical lengths look inconsistent. This part took two failed implementations to get right.
Attempt 1: Scale each table's height to fit its slot while preserving aspect ratio. Heights matched, but as a side effect, widths ended up inconsistent. Trying to force that by stretching horizontal and vertical directions at different rates caused the actual text inside the tables to stretch or squash horizontally.
"I don't care about the numbers — I just want slides that actually work."
Attempt 2: Changed approach — adjust row heights before generation to force all three tables to the same total height. This time, the table with fewer rows (betting suggestions) got compressed down to 23px rows, looking cramped.
"That's unacceptable."
The third attempt finally settled it. I completely removed the forced height-matching. Each table is now generated at its natural height for its natural row count, and only the width is unified across all three tables via column-padding adjustment (width_scale). For final placement, the exact same final_scale is applied to all three tables — because applying a different scale per table would make the text size look inconsistent between them.
# Use whichever of the three tables is naturally widest as the shared target width
target_w_native = max(w for w, h in naturals)

for (name, limit), (w_nat, h_nat) in zip(table_defs, naturals):
    width_scale_i = target_w_native / w_nat
    # width_scale only adjusts column padding. font_size is untouched, so text never distorts.

final_scale = box_w_px / target_w_native
# Apply the same final_scale to all three tables.
# Only if something overflows do we shrink final_scale itself further, by the same ratio across all three.
Both failed attempts tried to "match the heights" — but the thing that actually needed matching, from the start, was only the width.
The lesson shared by ① and ③ is that forcing visual pixel values to match and preserving content integrity (aspect ratio, font size) are sometimes mutually exclusive. ② taught the opposite lesson: placement should always be calculated from the measured values of other elements, not fixed assumptions.
④ ID-Independent Marker Approach — From Titles to External Data and Aggregate Statistics
Even after the three layout issues were resolved, one manual task remained: retyping the titles on slides ①–④ by hand in Inkscape every time, while checking the xlsx data.
My first idea was to hardcode and rewrite the ID of the <text> element inside the SVG, but that would break the moment the background SVG got redesigned in the future, since IDs would change. So instead I adopted an approach where a dedicated marker string is pre-embedded in the background SVG, and the code searches for and replaces that marker.
_TITLE_PLACEHOLDER_MARKER = "★表題自動挿入エリア★"

def _replace_title_text(svg_path, new_title):
    """
    Scans <text> elements in svg_path and rewrites the one identified
    as the title with new_title. Detection happens in two stages:
      1. Marker approach: find the element whose <tspan> (or <text>
         itself if no tspan) content exactly matches
         _TITLE_PLACEHOLDER_MARKER, and prioritize it.
      2. If not found, fall back to the legacy date-pattern approach
         (for backward compatibility with background SVGs still in
         the old format).
    Because this doesn't depend on IDs, it keeps working even if the
    background SVG is redesigned in the future, as long as the marker
    string is present.
    """
    bak_path = _backup_before_edit(svg_path)
    tree = etree.parse(svg_path)
    root = tree.getroot()

    text_els = list(root.iter("{%s}text" % SVG_NS))

    for text_el in text_els:
        tspans = text_el.findall("{%s}tspan" % SVG_NS)
        target = tspans[0] if tspans else text_el
        content = (target.text or "").strip()
        if content == _TITLE_PLACEHOLDER_MARKER:
            target.text = new_title
            tree.write(svg_path, xml_declaration=True, encoding="utf-8", standalone=False)
            return True, bak_path
    # ...fallback handling omitted
The design of always taking an automatic backup before rewriting (saved as originalname_bak_YYYYMMDDHHMMSS.svg) carries over directly from the "confirm before overwriting a same-named file" approach introduced in the previous article.
What made this marker approach work so well was that it extended cleanly beyond just titles. On July 22–23, when I automated the two remaining manual tasks — filling in the event date and venue on the opening slide, and filling in the hit-rate statistics on the results-verification slide — both reused the exact same "find the dedicated marker and replace it" design.
For fetching the opening slide's venue information (scraping publicly available race calendar data), I produced three implementations in a row that missed the mark: brute-force regex, a wrong character-encoding specification, a mistaken guess at a CSS class name. Each time I implemented based on "this is probably it," only to have it bounce back during actual testing as garbled text or zero hits.
"Stop guessing. Whatever you can verify, verify it up front."
It was only after being shown the actual HTML source from a real browser that this finally got resolved. The venue name turned out to be wrapped in a dedicated tag, <span class="JyoName">, and complex prefix-matching logic had never been necessary in the first place. The same pattern that kept repeating in ①–③ — "move forward on a guess, get proven wrong later" — replayed itself in a different form, this time in the context of fetching data from an external site.
The hit-rate statistics on the results-verification slide were also resolved without relying on Inkscape element IDs (which change every time you save) — instead, by introducing a new dedicated marker, ★結果照合TOP5自動挿入エリア★. The mechanism originally built for a single title location ended up paying off further and further as its scope expanded to externally-fetched data and xlsx aggregate values.
[6][7] Complete — The Day the "Fix It By Hand" Menu Items Disappeared
With these two features implemented on July 22–23, the menu screen finally looked like this:
==================================================
 スライド画像加工.py
 v3.54 No.60
 Working folder: /home/yuji/競馬予想システム/10_video/スライド加工
==================================================
--------------------------------------------------
  [1] Prediction Table
  [2] Featured-Race Table
  [3] Results Verification Table
  [4] 5-Race Chart
  [5] Text Fix (Auto Title Insertion)
  [6] Opening Text Fix
  [7] Results Verification Text Fix
  [8] All (Run 1–4 in Sequence)
  [9] Exit
Select a number and press Enter:
Here's [6] and [7] actually running.
[6] Opening Text Fix


Select a number and press Enter: 6
--- Running Opening Text Fix ---
Background SVG (opening) candidates (newest first):
  [1] 基本オープニングスライドV1.svg
Select a number and press Enter (blank = [1]): 1
Enter target date (YYYYMMDD, Enter = today 20260723) > 20260719
🌐 Fetching event calendar...
✅ Venue: Fukushima / Kokura / Hakodate
✅ Write complete: 2026年 7月19日(日)福島 小倉 函館
📁 Saved to: .../20260719_オープニングスライド.svg
--- Opening Text Fix complete ---


The tool fetches the publicly available race calendar data and pulls the venue name from the <span class="JyoName"> tag. It's written into the blank fields of the base template using the same marker approach as the title ([5]).
[7] Results Verification Text Fix


Select a number and press Enter: 7
--- Running Results Verification Text Fix ---
③ Results Verification Table source xlsx candidates (newest first):
  [1] osushi_kekka_hikaku_20260719.xlsx
  [2] osushi_kekka_hikaku_20260718.xlsx
Select a number and press Enter (blank = [1]): 1
✅ Featured-Race TOP5 stats rewritten:
   Featured races: 5 total, 2 place-hit, hit rate 40%
   1st pick: 1 place-hit, hit rate 0%
   2nd pick: 1 place-hit, hit rate 0%
   3rd pick: 1 place-hit, hit rate 20%
   All races: 35 total, 13 place-hit, hit rate 37.1%
--- Results Verification Text Fix complete ---
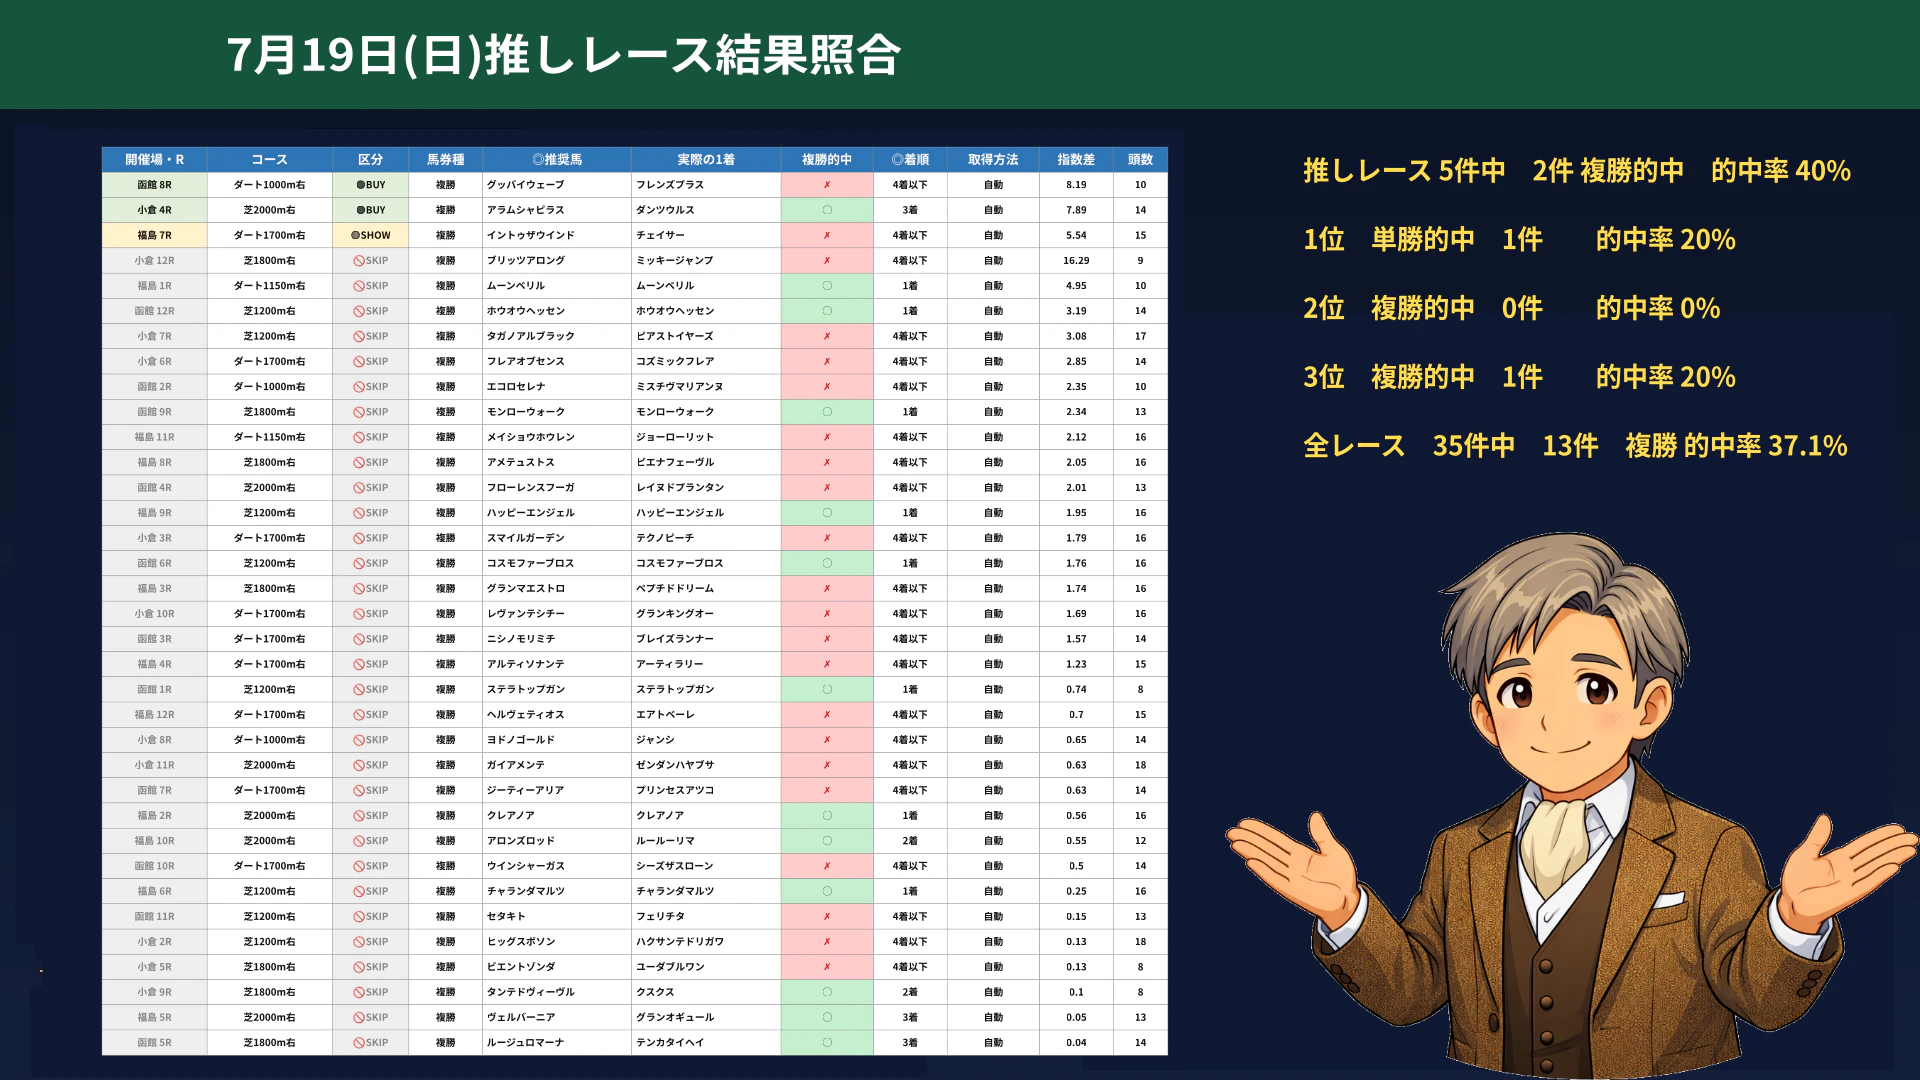

The TOP5 hit rate calculated from the xlsx is written directly into the position marked by ★結果照合TOP5自動挿入エリア★. The mechanism built for a single title location kept paying off further as its scope grew to cover externally-fetched data and xlsx aggregate values.
With this, all text across ①–④, the opening slide, and the results-verification slide now fills in automatically, and not a single manual "fix it by hand" step remains anywhere in producing one video's worth of slides.
Conclusion: The Numbers, and the Lessons That Don't Show Up as Numbers
Building on the "20 hours → 3 hours" from the previous article, this round shrank things further.
20 hours → 3 hours → 1.5 hours → 5 seconds
I confirmed the 1.5-hour figure (including manual touch-ups) in mid-July, and thanks to batch_slide_auto.py and the series of layout fixes described above, I eventually reached 5 seconds with zero manual touch-up required.
There were also a few takeaways that don't show up in the numbers:
- Forcing visual values to match in pixels and preserving content integrity (aspect ratio, font size) are sometimes mutually exclusive. Forcing a match always distorts something else. The right move is to pick a single axis to align on first.
- Placement should always be calculated from the measured values of other elements. Hardcoded coordinates only happen to work for the current data.
- Never move forward on "this is probably right." Skipping the step of rendering and actually looking at the result always costs more later. This held true whether it was my own layout calculations or fetching data from an external site.
- ID-dependent mechanisms eventually break. Switching to marker strings — meaningful landmarks — let the approach extend beyond just titles, and made it far more resilient to future redesigns of the background SVG.
As usual with solo development, solving one problem reveals the next one. I'm already working on material for the next round of automation.