環境
- Python 3.12.1
- bokeh 3.0.3
やりたいこと
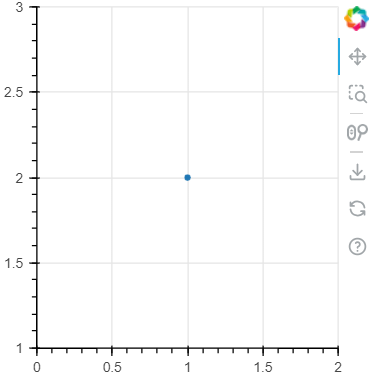
bokehを使って、(x,y)=(1,2)の場所に点と文字列を表示したいです。
以下のPythonファイルを実行しました。
sample.py
from bokeh.io import output_file, save
from bokeh.plotting import figure

fig = figure(width=300, height=300)
fig.circle(x=1, y=2)
fig.text(x=1, y=2, text="foo")

output_file("output.html")
save(fig)
何が起きたか
output.htmlをブラウザで開くと、(x,y)=(1,2)の場所に点は表示されましたが、文字列fooは表示されませんでした。
原因と解決策
上記のPythonファイルを、bokeh 3.3.4(2024/03/14時点で最新バージョン)を利用して実行すると、以下のエラーメッセージが出力されました。
$ python sample.py
ERROR:bokeh.core.validation.check:E-1001 (BAD_COLUMN_NAME): Glyph refers to nonexistent column name. This could either be due to a misspelling or typo, or due to an expected column being missing. : text='foo' [no close matches] {renderer: GlyphRenderer(id='p1048', ...)}
fooという列を探そうとしたけど見つからなかったので、グラフに文字列fooは表示されなかったようです。
text関数のtext引数に、文字列ではなくlistを渡せば、グラフに文字列fooは表示されました。
# fig.text(x=1, y=2, text="foo")
fig.text(x=1, y=2, text=["foo"])
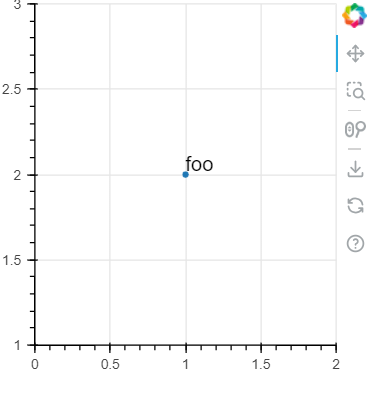
引数x, yにはlist型の値を渡さなくても問題ないようです。
ちなみに、text()関数のリファレンスを確認しましたが、text引数の値が文字列のときとlistのときで、どう挙動が変わるのかは記載されていませんでした。
text (StringSpec, optional) – The text values to render. (default: Field(field=’text’, transform=Unspecified, units=Unspecified))