PHPアプリのボトルネックをXdebugとqcachegrindを使って簡単に見つける方法です。
ボトルネックを見つけるための準備
peclなどを使ってXdebugをインストール、有効にしましょう。
pecl install xdebug
/etc/php.d/15-xdebug.ini
extension=xdebug.so
xdebug.profiler_enable = 1
xdebug.profiler_output_dir = /tmp
php-fpmやApacheをリロードしましょう。
あとは調査したURLにアクセスすれば/tmp以下にプロファイルデータが作成されます。
プロファイルデータ閲覧
プロファイルデータを閲覧するために qcachegrind をインストールしましょう。
Macの場合を想定
brew install graphviz qt qcachegrind
qcachegrindを起動
このコマンドで起動します。
qcachegrind
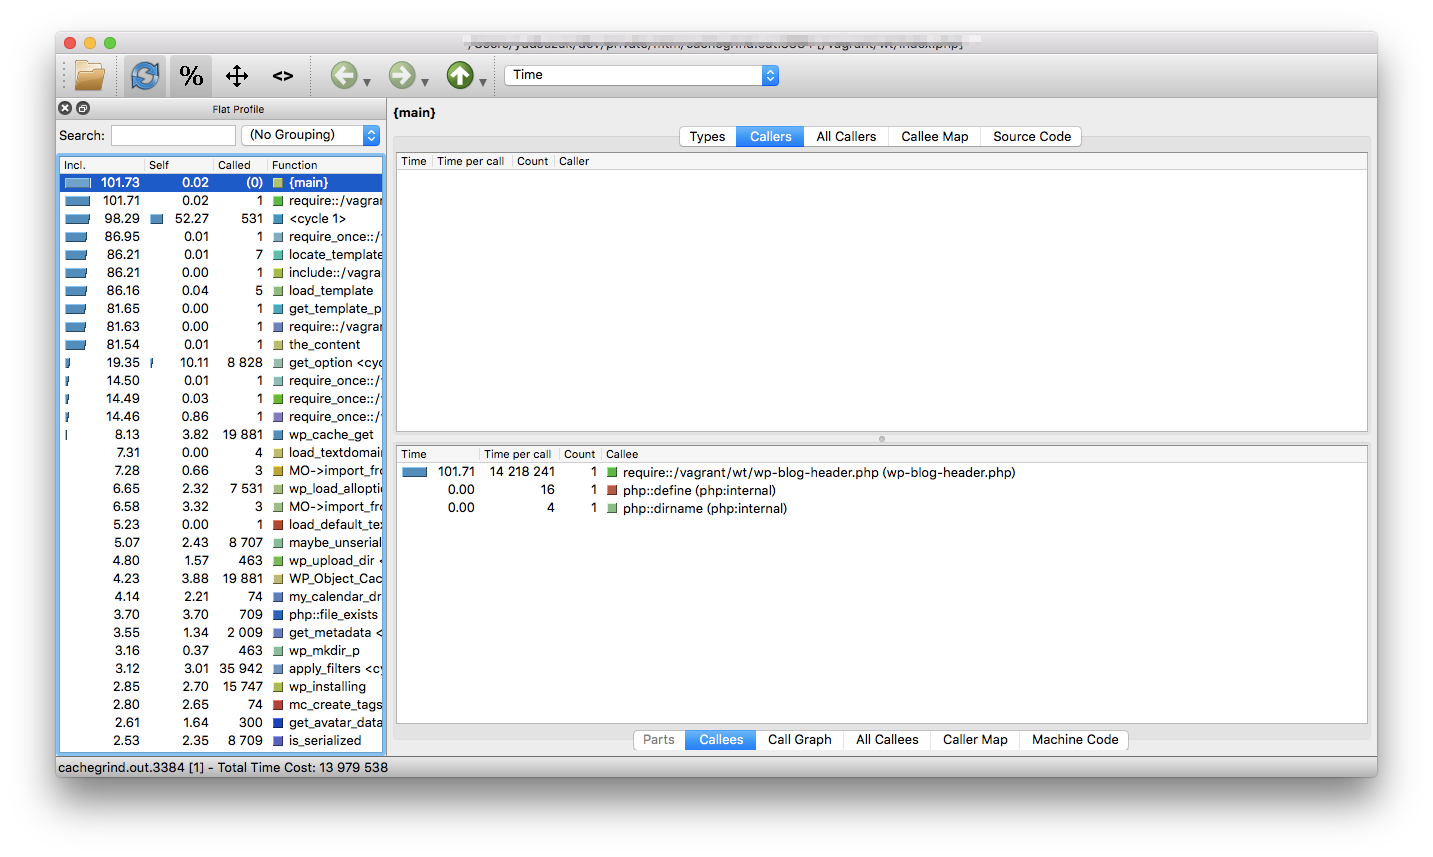
先ほど作成したプロファイルデータをインポートするとプロファイルが表示されます。
これで簡単にボトルネックが発見できますね!
使い終わったら
/etc/php.d/15-xdebug.ini
;xdebug.profiler_enable = 1
;xdebug.profiler_output_dir = /tmp
設定をコメントアウトしてリロードしましょう。
プロファイルデータのサイズはものすごく大きいので放っておくと大変なことになります。