はじめに
このシリーズでは、IBM CloudのBere Metal Servers for VPC上に構成されたVMware vSphereの環境をZabbixで監視する方法について複数の記事に分けて紹介しています。
- IBM CloudのBare Metal Servers for VPC上に構成されたVMware vSphere環境をZabbixで監視する(環境構築編)
- IBM CloudのBare Metal Servers for VPC上に構成されたVMware vSphere環境をZabbixで監視する(テンプレート編)
- IBM CloudのBare Metal Servers for VPC上に構成されたVMware vSphere環境をZabbixで監視する(SNMP Trap編) -> この記事
- IBM CloudのBare Metal Servers for VPC上に構成されたVMware vSphere環境をZabbixで監視する(SSHチェック編)
この記事では、ZabbixでのSNMP Trap監視における設定方法や監視項目について書いていきます。
前置き
前回までの記事の続きとなります。今回はSNMP TrapをESXiやvCenter Server Applianceから受信し、Zabbix上で取得できるデータを確認します。監視対象の環境は以下の通りです。

SNMP Trap監視
ESXiやvCenterから発出されるSNMP Trapによる監視を検討していきます。SNMP(Simple Network Management Protocol)は様々なデバイスを遠隔からネットワーク経由で監視するためのプロトコルです。SNMP Trapは監視対象の機器(SNMPエージェント)から発出される通知で、機器に問題が発生していることをSNMPマネージャーに能動的に知らせることが可能です。そのため、テンプレートの適用だけではカバーできない監視項目についても対応できる可能性があるため、監視メトリックを確認していきたいと思います。
SNMP環境の監視を実施するにはZabbixでnet-snmpモジュールが有効化されている必要があります。net-snmpをサーバーにインストールし、Zabbixをコンパイルする際に--with-net-snmpオプションを付与してください。
SNMP Trapの受信設定
SNMP TrapをZabbixで監視できるようにするために、まずSNMPTTを設定し、受信したTrapをログファイルに保存します。そのファイルをZabbixが読み込めるようにZabbix Serverの設定変更を実施します。設定手順については下記の公式ドキュメントに記載されています。
複雑な構造ですが、考え方やSNMPTTの設定については下記の記事が参考になります。
vyos から SNMP trap を上げ、snmptrapd が受信すると /usr/share/snmptt/snmptthandler-embedded コマンドを発行し /var/spool/snmptt/ 配下にキューとしてファイルを保存します。すると snmptt サービスがキューから trap 情報を取り出し、/var/log/snmptrap/snmptrap.log へ保存し、Zabbix はそのファイルを監視しているため新規のログ書き込みを検知し、監視データとして取り込みます。
SNMPTTの設定
snmptrapdがSNMPTTを使用するように設定を行います。
SNMP Trapを受信した際に、SNMPTTがログファイルにデータを保存します。また、Zabbix側でそのファイルを読み込むように設定を行います。
上記の記事の通り、必要なパッケージをインストールし、ログファイルを保管するディレクトリを作成します。
$ dnf -y install perl epel-release net-snmp-utils net-snmp-perl
$ dnf install 'dnf-command(config-manager)'
$ dnf config-manager --set-enabled powertools
$ dnf -y install https://dl.fedoraproject.org/pub/epel/7/x86_64/Packages/s/snmptt-1.4.2-1.el7.noarch.rpm
$ mkdir /var/log/snmptrap
$ chown -R snmptt:snmptt /var/log/snmptrap/
次に、MIBファイルの配置先を設定します。net-snmpから提供されているMIBは/usr/share/snmp/mibsに格納されていますが、標準的な機器のMIBファイルのみが格納されています。そのため、ベンダーが提供するMIBファイルを配置し、その配置先であるディレクトリを記載する必要があります。snmptrapdは、適切なMIBファイルを読み込むことでSNMP Trapを意味のある言葉として認識することができるようになります。
/etc/sysconfig/snmptrapdの最終行に以下を追記し、MIBファイルが配置されるディレクトリを設定します。
OPTIONS="-On -Lsd -p /var/run/snmptrapd.pid -M /usr/share/snmp/mibs:/usr/share/snmp/venders -m all"
ちなみに、VMware製品のMIBファイルはこちらから入手できます。フォルダの中にあるnotifications.txtファイルには、MIBの構成や使用方法、通知項目などが記載されていますので、一読してください。ダウンロードして、/usr/share/snmp/vendersに格納しておきます。
また、snmptrapdがTrapを受信した際にsnmptthandler-embeddedを実行するように設定することで、パフォーマンスを最大化できます。/etc/snmp/snmptrapd.confを開き、以下のように追記します。
authCommunity log,execute,net public
perl do "/usr/share/snmptt/snmptthandler-embedded"
設定が完了したらsnmptrapdサービスを自動起動に設定し、起動します。
$ systemctl enable --now snmptrapd
次に、SNMPTTの設定を実施します。/etc/snmp/snmptt.iniを編集し、書き込む先のTrapファイルを設定します。
# Set to either 'standalone' or 'daemon'
# standalone: snmptt called from snmptrapd.conf
# daemon: snmptrapd.conf calls snmptthandler
# Ignored by Windows.  See documentation
mode = daemon

# The date format for $x in strftime() format.  If not defined, defaults
# to %a %b %e %Y.
date_format = %Y/%m/%d

# The time format for $X in strftime() format.  If not defined, defaults
# to %H:%M:%S.
time_format = %H:%M:%S

# The date time format in strftime() format for the date/time when logging
# to standard output, snmptt log files (log_file) and the unknown log file
# (unknown_trap_log_file).  Defaults to localtime().  For SQL, see
# date_time_format_sql.
# Example:  %a %b %e %Y %H:%M:%S
date_time_format = %Y/%m/%d %H:%M:%S

# Log file location.  The COMPLETE path and filename.  Ex: '/var/log/snmptt/snmptt.log'
log_file = /var/log/snmptrap/snmptrap.log

# Set to 1 to enable logging of *TRAPS* to syslog.  If you do not have the Sys::Syslog
# module then disable this.  Windows users should disable this.
syslog_enable = 0

# Set to 1 to enable logging of *SNMPTT system errors* to syslog.  If you do not have the
# Sys::Syslog module then disable this.  Windows users should disable this.
syslog_system_enable = 0
保存したTrapをZabbixが認識できるようにTrapをフォーマットします。/etc/snmp/snmptt.confをバックアップし、下記の2行のみに変更します。
EVENT general .* "General event" Normal
FORMAT ZBXTRAP $aA $*
snmptt サービスを自動起動に設定し、起動します。
$ systemctl enable --now snmptt
これでSNMPTTサービスがTrapをログファイルに保存することができるようになりました。
Zabbix Serverの設定ファイルの変更
続いて、Zabbix ServerでSNMP Trapを読み込むために、SNMP Trapperを起動し、Trapが保存されているファイルを指定します。Zabbix Serverの設定ファイル/usr/local/etc/zabbix_server.confを開き、下記のように変更します。
### Option: SNMPTrapperFile
#	Temporary file used for passing data from SNMP trap daemon to the server.
#	Must be the same as in zabbix_trap_receiver.pl or SNMPTT configuration file.
#
# Mandatory: no
# Default:
SNMPTrapperFile=/var/log/snmptrap/snmptrap.log

### Option: StartSNMPTrapper
#	If 1, SNMP trapper process is started.
#
# Mandatory: no
# Range: 0-1
# Default:
StartSNMPTrapper=1
変更後はZabbix Serverを再起動します。
SNMP用インターフェースの追加
上記の設定でZabbixはSNMP Trapを読み込むことができていますが、監視メトリックとして取り込み、データを受信するにはホストとアイテムをGUI上で追加する必要があります。
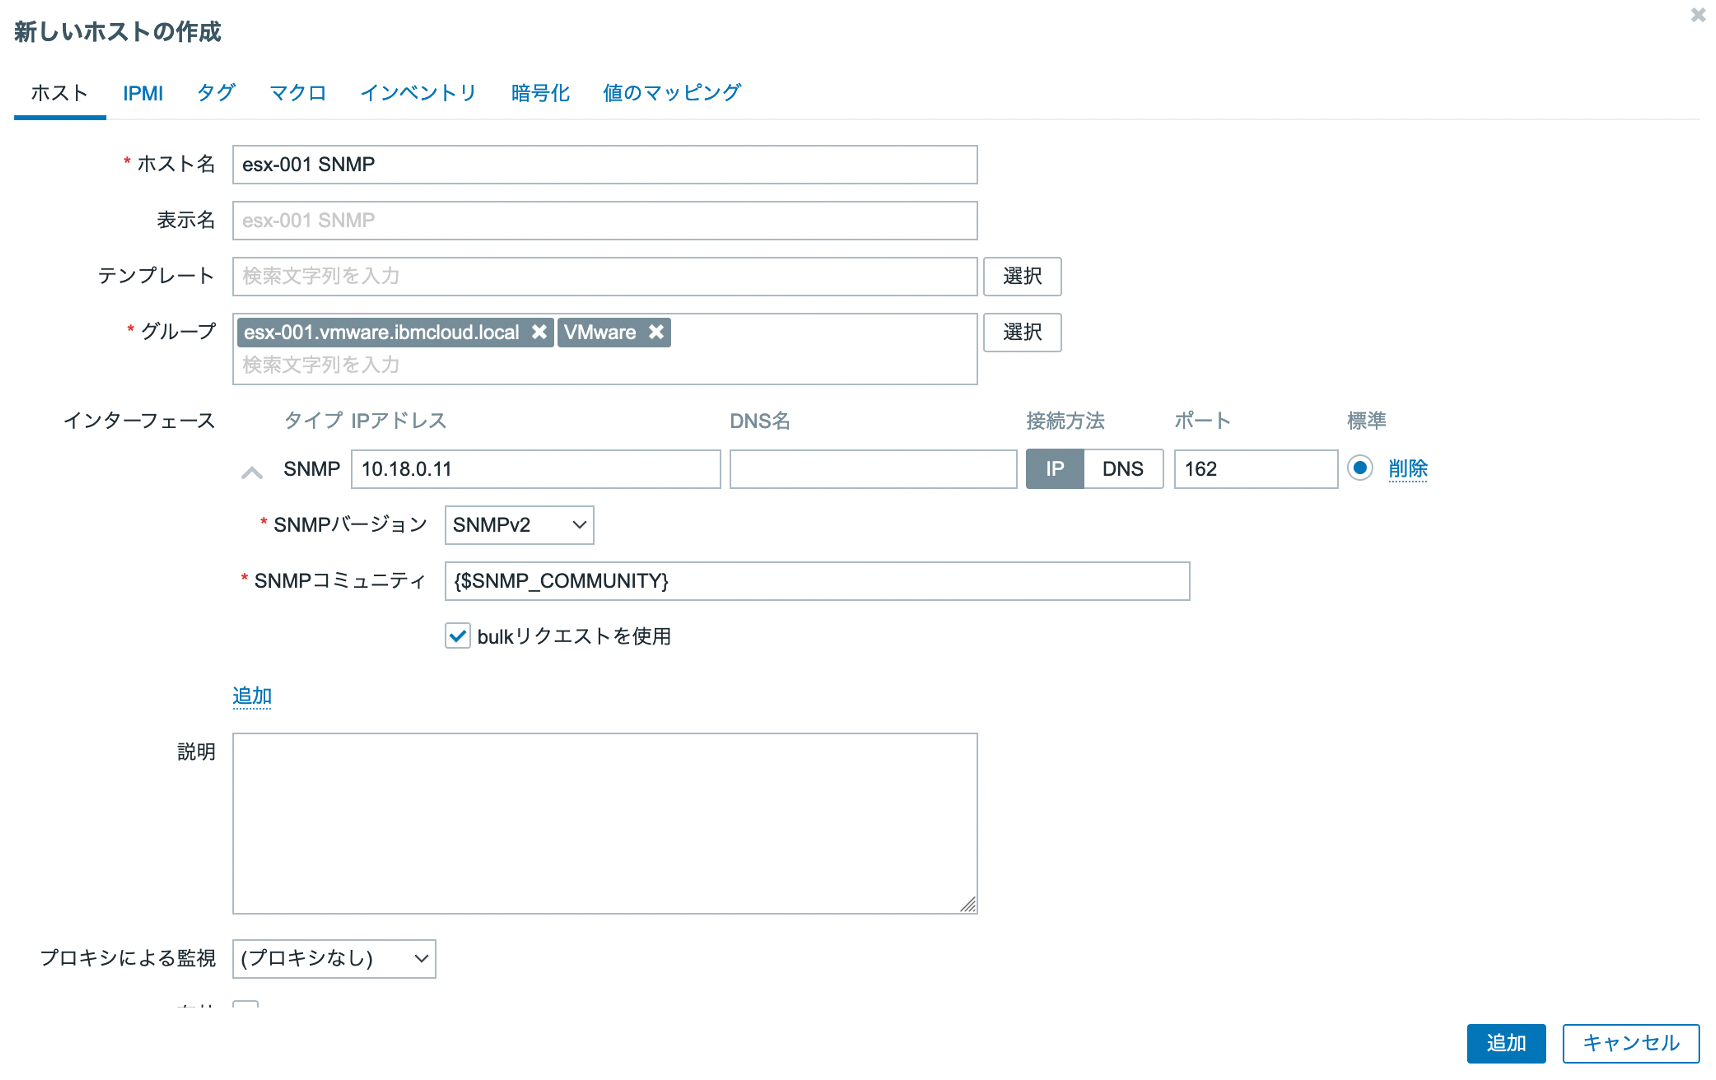
SNMP Trapを受信したいホストにSNMP用のインターフェースを追加します。
SNMP Trapはデフォルトの設定の場合162番ポートに向かって送信されます。そのため、ポートに「162」を入力します。
ディスカバリーにより自動で登録されたホストはインターフェースが追加できないため、SNMP Trapを受信するためのホストを別途追加しています。
「マクロ」タブから{$SNMP_COMMUNITY}の値をpublicに設定します。
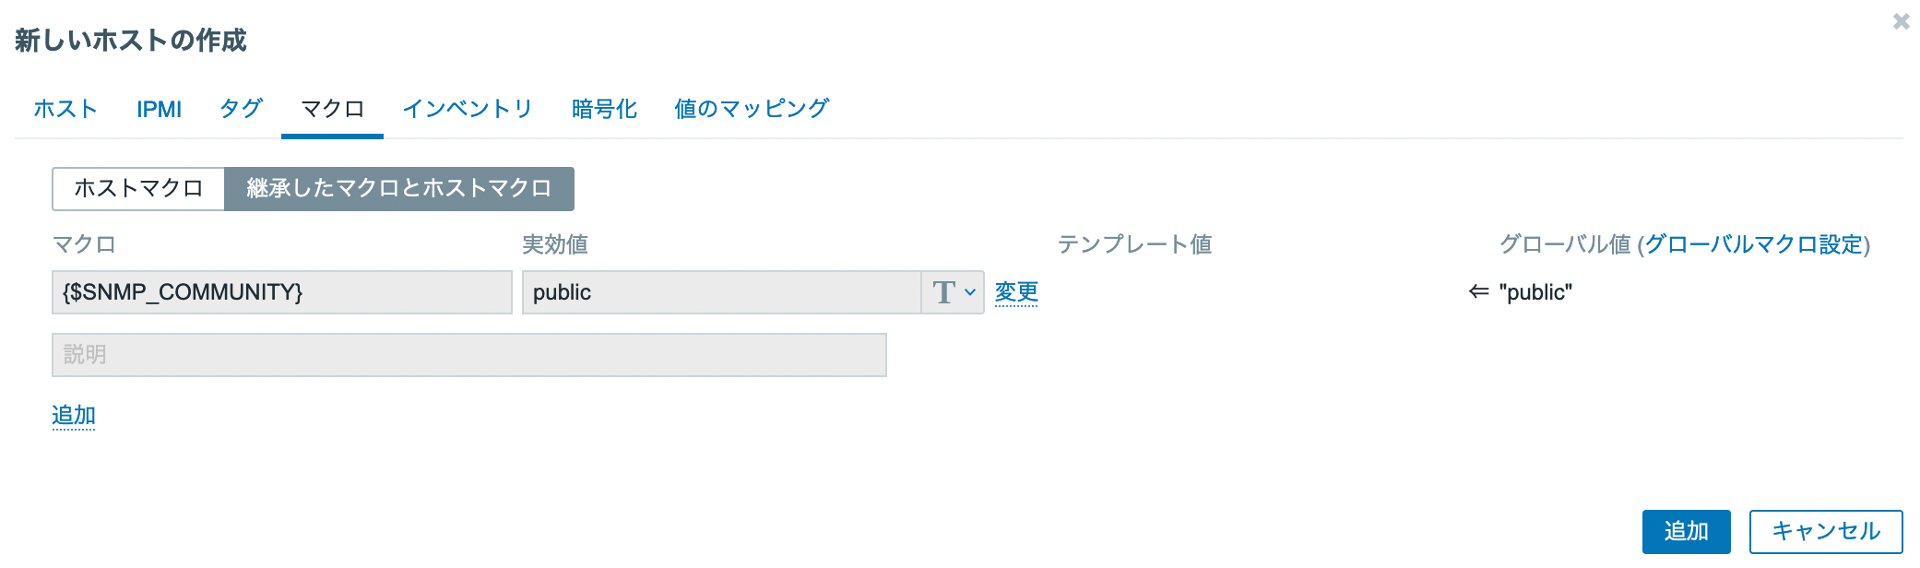
SNMPコミュニティの値を設定したら、「追加」をクリックしてホストを作成します。
これでホスト側でSNMP Trapを表示する受け口ができました。SNMP Trapを受信した際に、そのIPアドレス(FQDN)と全てのSNMPインターフェースが比較され、ホストを特定します。
最後に、作成したホストに対してSNMP Trapを収集するアイテムを作成します。キーには「snmptrap.fallback」を指定し、データ型として文字列を選択します。

これでSNMP Trapを受信するZabbix側の設定は完了です。
SNMP Trapの送信設定
続いて、SNMP Trapを送信するVMware製品側の設定を行います。
ESXi
ESXiでは、esxcliコマンドを利用することでSNMP Trapの送信設定をすることができます。詳細はこちらの公式ドキュメントをご確認ください。
ESXiにsshなどでログインし、下記のコマンドを実行します。まずはSNMPコミュニティを構成します。
[root@esx-001:~] esxcli system snmp set --communities public
次に、ターゲットを設定します。この設定によりSNMP Trapの送信先を指定することができます。
[root@esx-001:~] esxcli system snmp set --targets <Zabbix_IP>@162/public
SNMPエージェントを有効化し、設定は完了です。
[root@esx-001:~] esxcli system snmp set --enable true
設定を確認したい場合、テスト用のSNMP Trapを下記のコマンドで送信することができます。
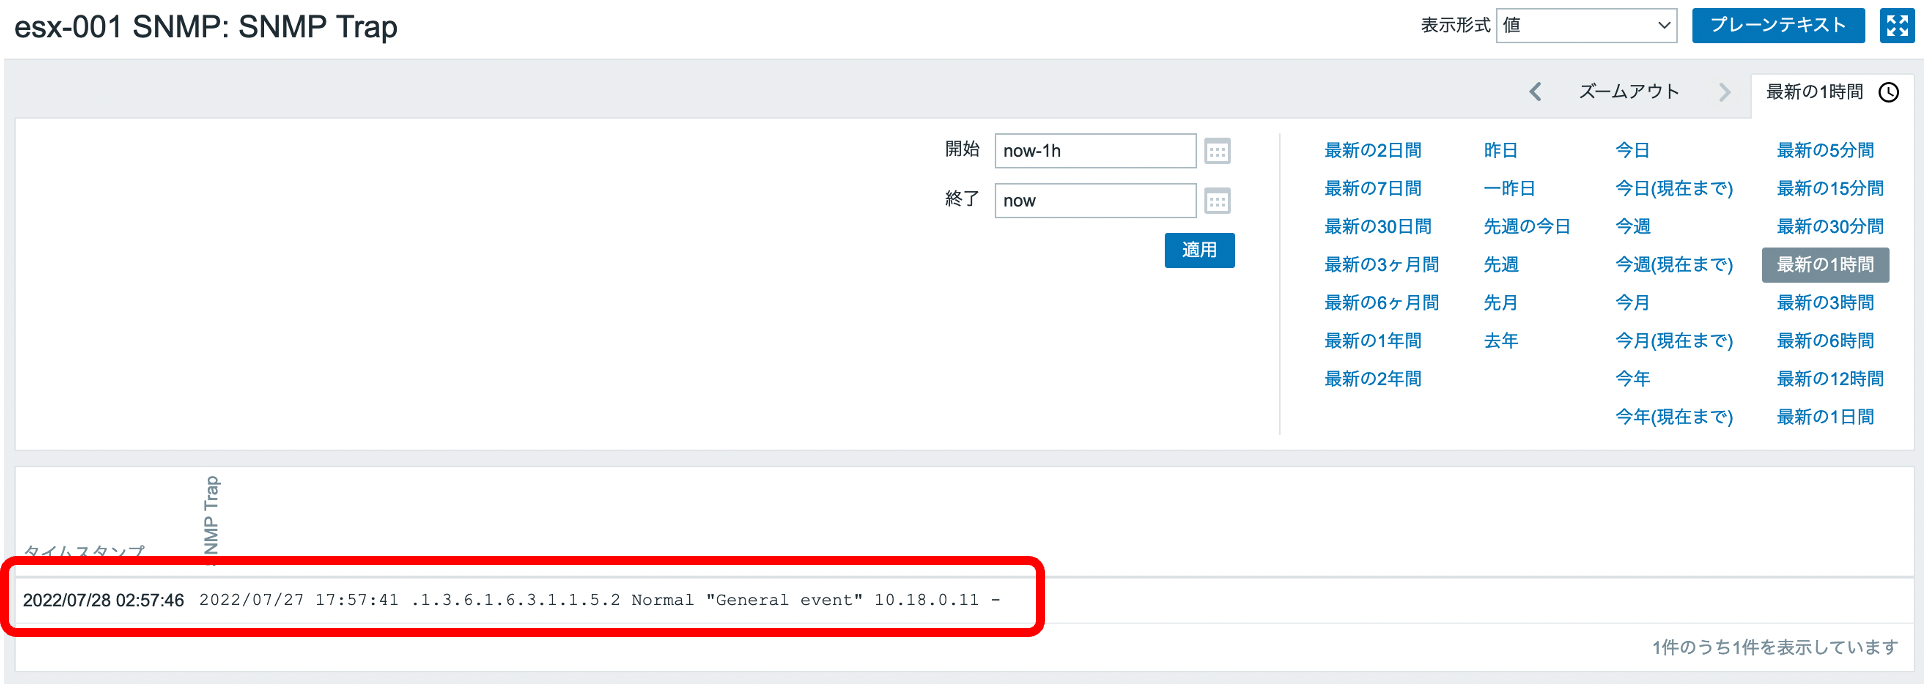
[root@esx-001:~] esxcli system snmp test
Zabbixメニューの「監視データ」->「最新データ」から先ほど作成したアイテムを選択し、テスト用のTrapが受信できていれば設定は完了です。
vCenter Server Appliance
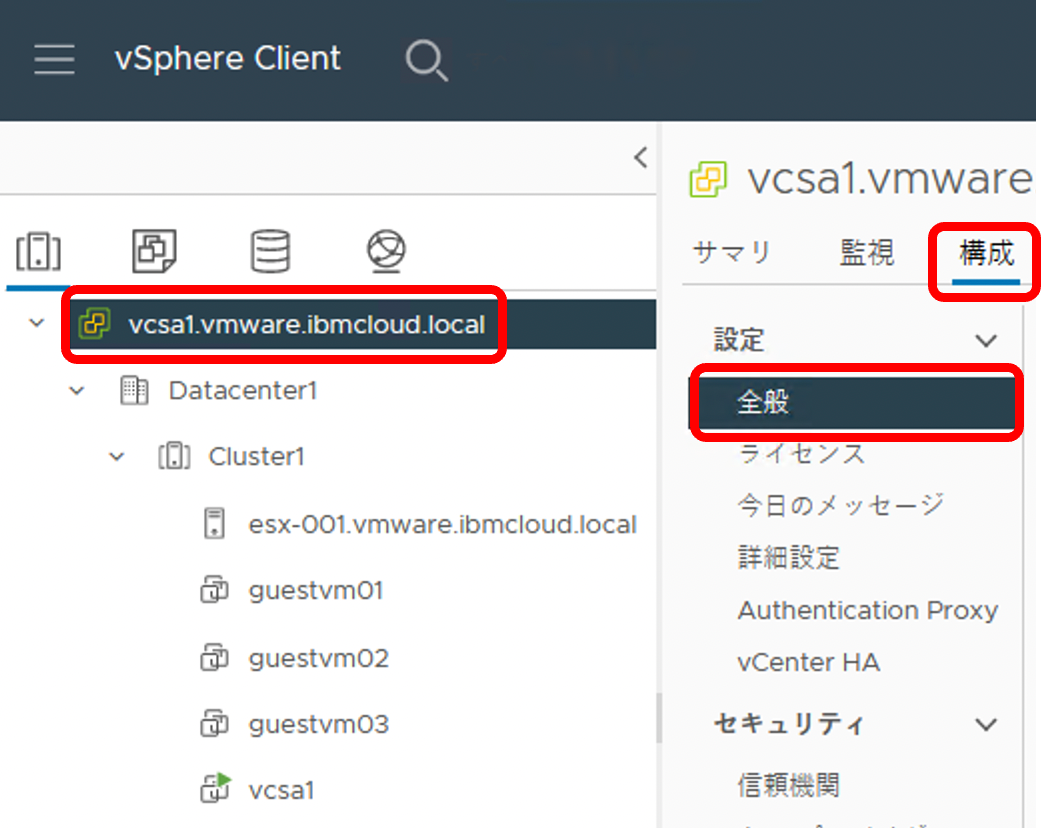
vCenterからもSNMP Trapを送信することが可能です。設定方法はこちらに記載されていますが、GUI上で設定が可能です。
vSphere ClientでvCenter Serverインスタンスを選択し、「構成」タブから「設定」->「全般」を選択します。
右上の「編集」をクリックし、SNMPレシーバとしてZabbix Serverを設定します。

これでvCenterからもSNMP Trapを送信する設定が完了しました。
SNMP Trapにより監視できる項目
MIBファイルを確認することで、どのようなデータがSNMP Trapで送信されるかを確認することができます。MIBファイルの中で、SNMP Trapの通知項目に関してはNOTIFICATION-TYPE句で定義されています。
ESXiに関連するものでは、下記のような項目があり、定義されているTrapのDescriptionを読むことでどのような項目がSNMPマネージャー側に通知されるのか把握することができます。
coldStart NOTIFICATION-TYPE
       STATUS  current
       DESCRIPTION
               "A coldStart trap signifies that the SNMP entity,
               supporting a notification originator application, is
               reinitializing itself and that its configuration may
               have been altered."
       ::= { snmpTraps 1 }

   warmStart NOTIFICATION-TYPE
       STATUS  current
       DESCRIPTION
               "A warmStart trap signifies that the SNMP entity,
               supporting a notification originator application,
               is reinitializing itself such that its configuration
               is unaltered."
       ::= { snmpTraps 2 }
linkDown NOTIFICATION-TYPE
    OBJECTS { ifIndex, ifAdminStatus, ifOperStatus }
    STATUS  current
    DESCRIPTION
            "A linkDown trap signifies that the SNMP entity, acting in
            an agent role, has detected that the ifOperStatus object for
            one of its communication links is about to enter the down
            state from some other state (but not from the notPresent
            state).  This other state is indicated by the included value
            of ifOperStatus."
    ::= { snmpTraps 3 }

linkUp NOTIFICATION-TYPE
    OBJECTS { ifIndex, ifAdminStatus, ifOperStatus }
    STATUS  current
    DESCRIPTION
            "A linkUp trap signifies that the SNMP entity, acting in an
            agent role, has detected that the ifOperStatus object for
            one of its communication links left the down state and
            transitioned into some other state (but not into the
            notPresent state).  This other state is indicated by the
            included value of ifOperStatus."
    ::= { snmpTraps 4 }
ESXiの通知項目を少しまとめてみました。以下のような項目が通知されるようです。
- coldStart: ESXiホストの再起動
- warmStart: ESXiのホストプロセスの再起動
- linkDown: 物理ネットワークインターフェースの状態がDownに変更される
- linkUp: 物理ネットワークインターフェースの状態がUpに変更される
- vmPoweredOn: ESXi上の仮想マシンがPowerOnされる
- vmPoweredOff: ESXi上の仮想マシンがPowerOffされる
- vmHBLost: ESXi上の仮想マシン(VMware Tools)とのheartbeatが失われる
- vmHBDetected: ESXi上の仮想マシン(VMware Tools)とのheartbeatが正常に動作する
- vmSuspended: ESXi上の仮想マシンがSuspended(サスペンド)状態になる
また、vCenterにおいては下記のようにMIBファイルに記載されています。
vpxdDiagnostic NOTIFICATION-TYPE
    STATUS      current
    DESCRIPTION
        "This notification is sent on starting or restarting vCenter Server,
         on requesting a test notification explicitly, and can also be
         configured to be sent periodically at a specified time interval via
         vCenter Server configuration by the vCenter Server SNMP agent."
    ::= { vmwVCNotifications 202 }

vpxdAlarmInfo NOTIFICATION-TYPE
    OBJECTS { vmwVpxdTargetObjType, vmwVpxdOldStatus, vmwVpxdNewStatus, vmwVpxdObjValue, vmwVpxdTargetObj }
    STATUS      current
    DESCRIPTION
        "This notification is sent on entity alarm state change, by the vCenter Server SNMP agent.
         This information is also available through the vSphere client, through the Alarms screen,
         or through the Managed Object Browser(MOB) interface for alarms at
         https://<vCenter Server machine address>/mob/?moid=AlarmManager.
         Listing individual objects of a specific type or ID can be done through the PropertyCollector SDK API.
         See http://www.vmware.com/support/developer/vc-sdk/visdk2xpubs/ReferenceGuide/vmodl.query.PropertyCollector.html
         for details."
    ::= { vmwVCNotifications 203 }
vCenterのアラームが発行された場合や、vCenter自体が再起動された場合にTrapが送信されるように設定されています。ご存じの通りvCenterはvSphere環境全体を管理するコンポーネントであり、vCenter配下の仮想マシンやESXiホストはvCenterによって監視されています。そのため、vCenterにはあらかじめアラームが定義されており、障害の発生時やステータスエラーなどが発生した場合にはアラームが発行されます。これによりvCenterからのSNMP Trapを監視することでZabbix側でもvSphere環境全体の障害状況を把握することができます。
vCenterで定義されているアラームは下記にリストされています。
VMwareの機能(vSAN、vSphereHAなど)やライセンスに関わるもの、ハードウェアの情報まで一通りの項目が網羅されています。しかし、ハードウェアの情報に関してはIPMIから取得されるデータを利用しているため、BMS for VPCで構成したESXiでは取得することができないと考えられます。
以上より、SNMP TrapをESXi、及びvCenterから受信できるように設定することで、ESXiに関するステータスの監視と、vSphere環境全体の監視を実施可能であることがわかりました。また、ESXiからのSNMP Trapには、ESXiホストの物理的なネットワークインターフェース(BMS for VPCのPCI Interface)のステータスが含まれており、アップリンクポートの監視を実施できることが確認できました。ちなみに、実際の物理ポートであるSmartNICはIBM Cloud側で運用管理を実施しているため、ユーザー側で監視する必要はありません。
あとがき
監視項目としては全体感が見えてきましたが、BMS for VPCではIPMIを利用することができないため、ハードウェアのステータス情報が不足しているように感じます。障害発生時の状況切り分けに利用することができるように、メモリーやディスクに関する情報をもう少し取得する必要があると思います。そのため、次の記事ではZabbixのSSHチェックを利用し、ESXiにssh接続を確立してコマンドを流し込むことで監視を実施してみたいと思います。
次の記事はこちら