色々な確率分布をPythonで計算、描画する際の備忘録。
※随時追加予定
正規分布(ガウス分布)
scipyで正規分布を計算
python
from scipy import stats

#平均100、分散50の正規分布

#ダイレクトに確率密度を取り出す
stats.norm.pdf(x=100, loc=100, scale=50)
#0.0079788456080286535

stats.norm.pdf(x=50, loc=100, scale=50)
#0.0048394144903828673

stats.norm.pdf(x=150, loc=100, scale=50)
#0.0048394144903828673

stats.norm.pdf(x=0, loc=100, scale=50)
#0.0010798193302637613

#正規分布の確率密度関数のオブジェクトを生成し、後で値を取り出す
norm = stats.norm(loc=100, scale=50)

print(norm.pdf(100))
#0.00797884560803

print(norm.pdf(5))
#0.00131231629549

#配列・リストも渡せる
list = [70, 100, 150]
norm = stats.norm(loc=100, scale=50)
print(norm.pdf(list))
#[ 0.00666449  0.00797885  0.00483941]
x:横軸の点(xに入れた値に対応する確率密度が出力される)
loc:平均
scale:分散
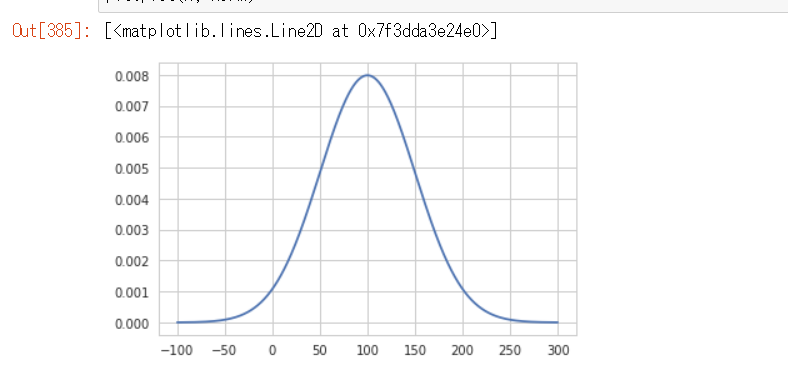
matplotlibで描画
python
import matplotlib.pyplot as plt
%matplotlib inline

x = np.linspace(-100, 300, num=800)
norm = stats.norm.pdf(x=x, loc=100, scale=50)

plt.plot(x, norm)