この記事は、toio Advent Calendar 2020 の 10日目の記事です。
(投稿が遅れてしまいました・・・)
記事の内容は、タイトルにも書いたとおり toio のシェイク検出の情報を Web Bluetooth API を使ってブラウザで受け取り、Smoothie Charts(smoothie.js)を使ってリアルタイムにグラフ化してみる、というものです。
実際にそれが動作している様子は以下となります。
#toio のシェイク検出の情報を Web Bluetooth API を使ってブラウザで受け取って、 さらにそれを Smoothie Charts(smoothie.js)でリアルタイムにグラフ化してみた。
— you (@youtoy) December 10, 2020
最大レベルの「0x0a(Level 10)」は、かなり強く振らないと到達しなそうな感じ。 pic.twitter.com/7btb1Mpo3g
使った仕組み・技術
toio のシェイク検出
今回、toio 側で利用した機能は、仕様ページに「バージョン 2.2.0」の段階で追加された、モーションセンサーの「シェイク検出」です。
リリースされたのは2ヶ月以上前ですが、まだ試せていない機能なので、この機会に触ってみました。
Web Bluetooth API
toio と PC との通信部分には「Web Bluetooth API」を利用しました。
こちらは、これまで 2度の Maker Faire出展を行った際に作った作品で、また toio のキャンペーン・コンテスト用に作った作品で使っており、以下の Qiita の記事や YouTube の動画に登場する作品等にも利用していました。
- toio を音で制御してみた(Audio用の Teachable Machine でベルやタンバリンの音を機械学習) - Qiita
- #Unity のオブジェクトと #toio を IoTの仕組み(MQTT)でリアルタイムに連動させる仕組み( #ロボやろ ) - Qiita
- #toio をスマートスピーカーから操作( #おうちでロボット開発 ): #Voiceflow と開発者向けマット(仮)を活用 - YouTube
toio のシェイク検出を試す
情報取得を試す
それでは、まずは toio のシェイク検出の情報を取得してみます。
モーションセンサーの各種情報を取得する処理については、以前書いた「toio を Web Bluetooth API で制御(「通知・読み出し・書き込み」を行う)」という記事の「通知の ON/OFF」という部分で、以下の処理を行うために作成したソースコードを掲載していました。
- BLE で toio と接続
- toio からセンサー情報を受信できるように通知処理の設定
- 通知されたバイナリデータをログで出力
これをベースにして、シェイク検出の情報を取得してみます。
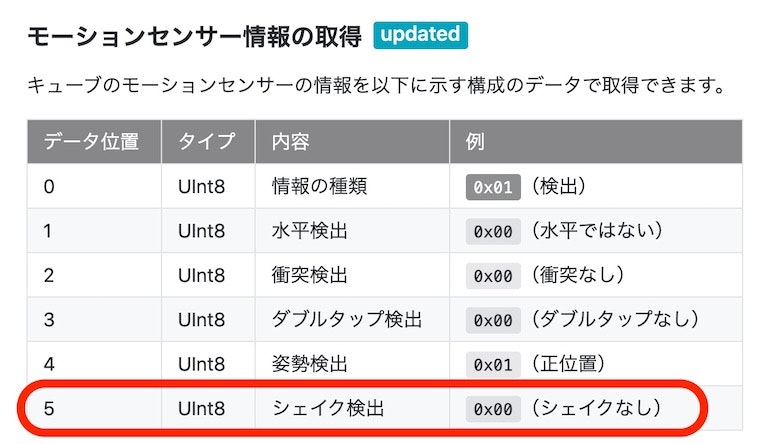
toio のモーションセンサーの仕様のページを見てみると、6バイトのバイナリデータが送られてきて、その6番目の情報を見れば良さそうです。

以前書いた記事で、toio から受信したバイナリデータを表示する部分は以下のような処理にしていました。
function handleNotifications(event) {
  let value = event.target.value;
  let a = [];
  for (let i = 0; i < value.byteLength; i++) {
    a.push('0x' + ('00' + value.getUint8(i).toString(16)).slice(-2));
  }
  console.log('> ' + a.join(' '));
}
「受信したバイナリデータの内容を、1バイトずつデータの長さ分だけ出力する」という形です。
byteLength でデータの長さを取得して処理を行っているため、仕様変更によりシェイク検出の部分が追加されて長さが変わったバイナリデータの内容も、そのままのコードで取得できていそうです。
それでは、明示的に6番目のデータを取得し、シェイク検出の情報が取り得る値の範囲(0x00:検出なし から 0x0a: Level 10 の値)に応じた処理を加えてみることにします。

具体的には、以下のような内容にしてみました。
function handleNotifications(event) {
  let value = event.target.value;
  const shake = value.getUint8(5);

  if(shake === 0) {
    console.log('検出なし');
  } else if(shake < 3) {
    console.log('軽く揺れてる');
  } else if(shake < 6) {
    console.log('まあまあの揺れ');
  } else {
    console.log('激しく揺れてる!');
  }
}
揺らす強さを変えると、ログで表示される文字が変わるのが確認できました。
グラフで表示させてみる
何らか取得した値を可視化できないかと、前にも何度か利用したことがある Smoothie Charts というライブラリを用いたグラフ化をやってみました。
冒頭に掲載したとおり、動作時の様子は以下のとおりです。
#toio のシェイク検出の情報を Web Bluetooth API を使ってブラウザで受け取って、 さらにそれを Smoothie Charts(smoothie.js)でリアルタイムにグラフ化してみた。
— you (@youtoy) December 10, 2020
最大レベルの「0x0a(Level 10)」は、かなり強く振らないと到達しなそうな感じ。 pic.twitter.com/7btb1Mpo3g
また、ソースコード全体は以下となります。
<!DOCTYPE html>
<html>
<head>
<meta charset="utf-8" />
<meta name="viewport" content="width=device-width, initial-scale=1">
<titleWeb Bluetooth API によるシェイク検出のデータ取得とデータのグラフ化</title>
<link rel="stylesheet" href="https://cdn.jsdelivr.net/npm/bulma@0.9.1/css/bulma.css">
<script src="https://cdnjs.cloudflare.com/ajax/libs/smoothie/1.34.0/smoothie.min.js"></script>
</head>
<body>
  <section class="section">
    <div class="container">
      <h1 class="title">
        グラフと操作用ボタン
      </h1>
      <canvas id="mycanvas" width="400" height="100"></canvas>
      <div class="buttons" style="margin-top: 1.5rem;">
        <button class="button is-success is-light" type="button" onclick="onStartButtonClick()">接続+通知ON</button>
        <button class="button is-danger is-light"  type="button" onclick="onStopButtonClick()">通知OFF</button>
        <button class="button is-info is-light" type="button" onclick="onStartNotificationsButtonClick()">通知ON</button>
      </div>
    </div>
</section>

<script>
var smoothie = new SmoothieChart({ minValue: 0.0, maxValue: 10.0});
var line = new TimeSeries();
smoothie.addTimeSeries(line, { strokeStyle: 'rgba(0, 255, 0, 1)', fillStyle: 'rgba(0, 255, 0, 0.2)', lineWidth: 4 });
smoothie.streamTo(document.getElementById("mycanvas"));

const TOIO_SERVICE_UUID          = '10b20100-5b3b-4571-9508-cf3efcd7bbae';
const MOTION_CHARACTERISTIC_UUID = '10b20106-5b3b-4571-9508-cf3efcd7bbae';

let myCharacteristic;

async function onStartButtonClick() {
  let serviceUuid = TOIO_SERVICE_UUID;
  let characteristicUuid = MOTION_CHARACTERISTIC_UUID;

  try {
    console.log('Requesting Bluetooth Device...');
    const device = await navigator.bluetooth.requestDevice({
        filters: [{services: [serviceUuid]}]});
    console.log('Connecting to GATT Server...');
    const server = await device.gatt.connect();
    console.log('Getting Service...');
    const service = await server.getPrimaryService(serviceUuid);
    console.log('Getting Characteristic...');
    myCharacteristic = await service.getCharacteristic(characteristicUuid);
    await myCharacteristic.startNotifications();
    console.log('> Notifications started');
    myCharacteristic.addEventListener('characteristicvaluechanged',
        handleNotifications);
  } catch(error) {
    console.log('Argh! ' + error);
  }
}

async function onStopButtonClick() {
  if (myCharacteristic) {
    try {
      await myCharacteristic.stopNotifications();
      console.log('> Notifications stopped');
      myCharacteristic.removeEventListener('characteristicvaluechanged',
          handleNotifications);
    } catch(error) {
      console.log('Argh! ' + error);
    }
  }
}

async function onStartNotificationsButtonClick() {
  try {
    console.log('Starting Notifications...');
    await myCharacteristic.startNotifications();
    myCharacteristic.addEventListener('characteristicvaluechanged',
        handleNotifications);
    console.log('> Notifications started');
  } catch(error) {
    log('Argh! ' + error);
  }
}

function handleNotifications(event) {
  let value = event.target.value;
  const shake = value.getUint8(5);

  line.append(new Date().getTime(), shake);
}

</script>
</body>
</html>
まとめ
今回、toio のシェイク検出の情報を Web Bluetooth API を使ってブラウザで受け取り、Smoothie Charts(smoothie.js)を使ってリアルタイムにグラフ化してみました。
シェイク検出をとりあえず試した、という感じですが、これから活用例を考えてみたいと思います。
