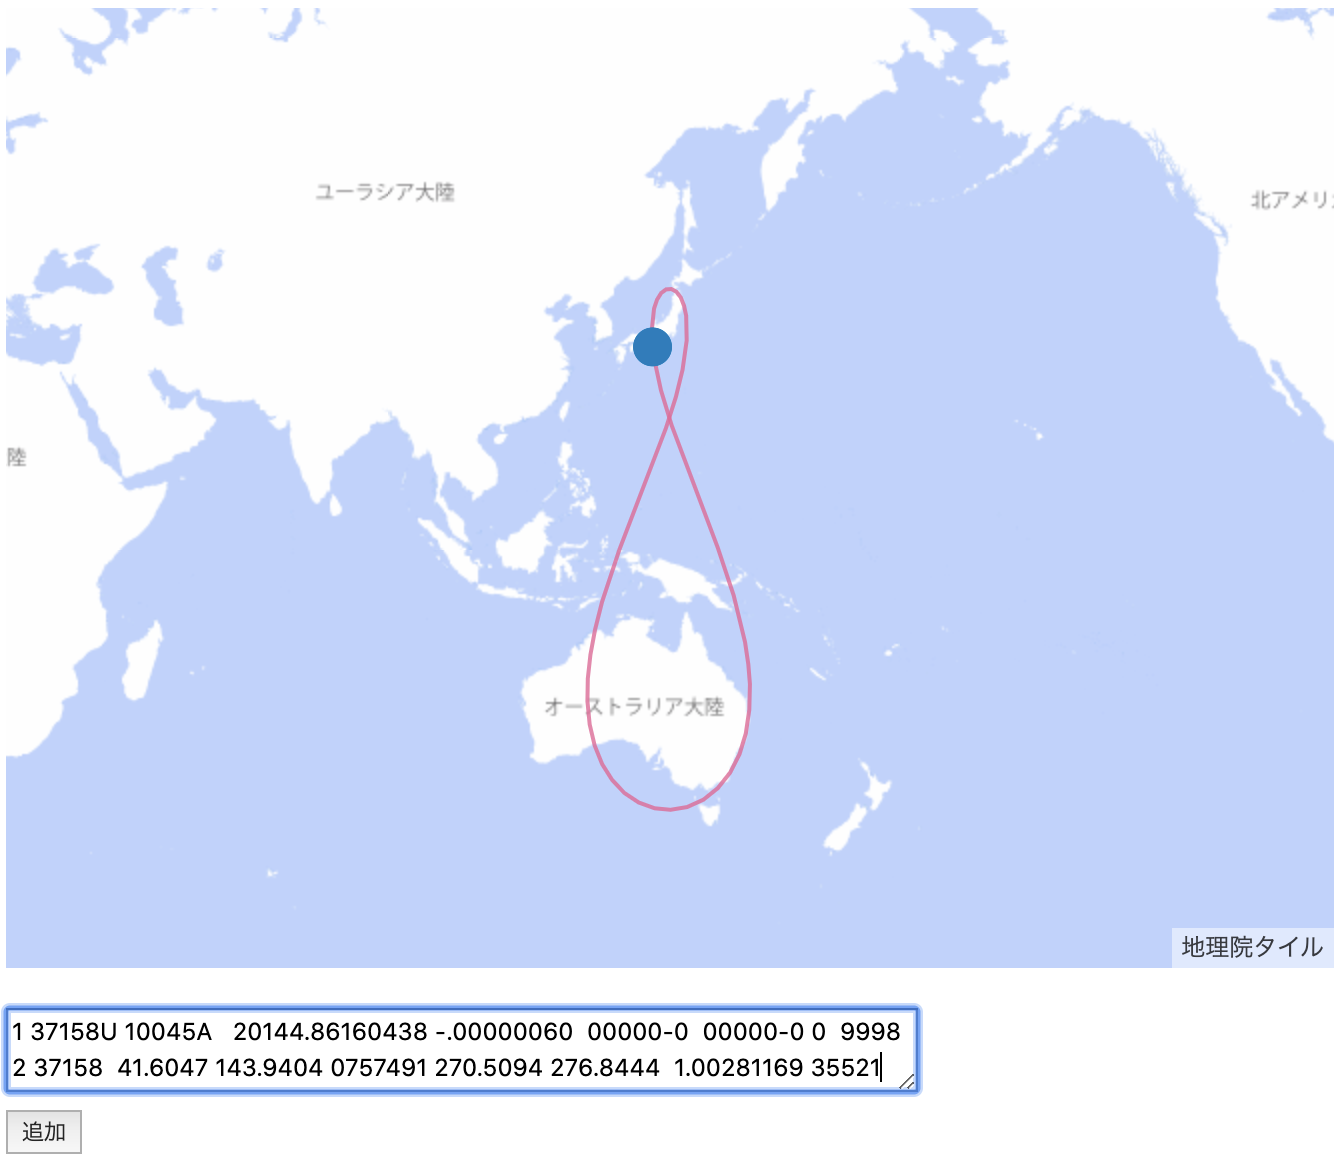
人工衛星がどの位置にあるのか、mapbox上にパッと表示する方法です。
地図は地理院タイルを利用します。
衛星の位置はTwo Line Elements(TLE)をcelestrakから入手します。
TLEを緯度経度に変換するアルゴリズムは、sgp4が有名です。
このアルゴリズムは観測から15日後の衛星位置を数10km程度の誤差で予測できるすぐれものです。
自前で作ろうと思いましたが、アルゴリズムの中身を見ると精度が良いだけに面倒だったので、素直に既存のライブラリに頼ることにします。
node-sgp4
またユーザがTLEを入力できるようにしたいので、入力値がTLEをとして適切かバリデーションするのにもライブラリをお借りすることにします。
tle-validator
サンプル
<!DOCTYPE html>
<html>

<head>
    <meta charset="UTF-8">
    <title>TLE</title>

    <script src='https://api.mapbox.com/mapbox-gl-js/v1.9.1/mapbox-gl.js'></script>
    <link href='https://api.mapbox.com/mapbox-gl-js/v1.9.1/mapbox-gl.css' rel='stylesheet' />
    <style>
        #map {
            height: 480px;
        }

        textarea {
            width: 450px;
            height: 3em;
            line-height: 1.5;
            font-size: 12px;
        }

        #error {
            font-size: 10px;
        }
    </style>
</head>

<body>
    <div id="map"></div>
    <div style="margin-top: 20px;">
        <textarea id="tle"></textarea>
    </div>
    <div>
        <button id="add">追加</button>
        <p id="error"></p>
    </div>
</body>
<script src='./dist/tle.js'></script>
</html>
import SGP4 from 'sgp4';
import TLEValidator from 'tle-validator';
const simulateUpdateSecond = 60;
const animationDurationMilliSecond = 50;
const maxSecond = 3600 * 24;

const map = new mapboxgl.Map({
	container: "map",
	center: [139.765, 35.65],
	zoom: 1,
	minZoom: 1,
	maxZoom: 8
});

map.addLayer({
	"id": "base/pale",
	"type": "raster",
	"source": {
		type: "raster",
		tiles: [
			"https://cyberjapandata.gsi.go.jp/xyz/pale/{z}/{x}/{y}.png"
		],
		attribution: "<a href='http: //maps.gsi.go.jp/development/ichiran.html'>地理院タイル</a>",
		tileSize: 256,
		minzoom: 2,
		maxzoom: 8
	}
});


map.on('load', function () {
	document.getElementById("add").addEventListener('click', function () {
		document.getElementById("error").innerText = "";
		let texts = document.getElementById("tle").value.split(/\n/);

		function setAnimation(line1, line2) {

			const satRec = SGP4.twoline2rv(line1, line2, SGP4.wgs84());
			const now = new Date();
			const id = now.getTime();
			const datetime = now;
			const counterclockwise = getAngularVelocity(datetime).z > 0;
			const meanMotion = satRec.no; //rad/min
			const orbitPeriod = 2 * Math.PI / (meanMotion / 60) //sec
			const limitSecond = Math.min(maxSecond, orbitPeriod)

			function getPosition(datetime) {
				//https://github.com/joshuaferrara/node-sgp4/blob/master/example.js
				const positionAndVelocity = SGP4.propogate(satRec, datetime.getUTCFullYear(), datetime.getUTCMonth() + 1, datetime.getUTCDate(), datetime.getUTCHours(), datetime.getUTCMinutes(), datetime.getUTCSeconds());
				const gmst = SGP4.gstimeFromDate(datetime.getUTCFullYear(), datetime.getUTCMonth() + 1, datetime.getUTCDate(), datetime.getUTCHours(), datetime.getUTCMinutes(), datetime.getUTCSeconds());
				const geodeticCoordinates = SGP4.eciToGeodetic(positionAndVelocity.position, gmst);
				const longitude = SGP4.degreesLong(geodeticCoordinates.longitude);
				const latitude = SGP4.degreesLat(geodeticCoordinates.latitude);
				return [longitude, latitude]
			}

			function getAngularVelocity(datetime) {
				const positionAndVelocity = SGP4.propogate(satRec, datetime.getUTCFullYear(), datetime.getUTCMonth() + 1, datetime.getUTCDate(), datetime.getUTCHours(), datetime.getUTCMinutes(), datetime.getUTCSeconds());
				const position = positionAndVelocity.position;
				const velocity = positionAndVelocity.velocity;
				const posLength = Math.sqrt(position.x ** 2 + position.y ** 2 + position.z ** 2);
				const velLength = Math.sqrt(velocity.x ** 2 + velocity.y ** 2 + velocity.z ** 2);
				return {
					x: (position.y * velocity.z - position.z * velocity.y) / posLength / velLength,
					y: (position.z * velocity.x - position.x * velocity.z) / posLength / velLength,
					z: (position.x * velocity.y - position.y * velocity.x) / posLength / velLength
				}
			}

			map.addLayer({
				'id': 'line_' + id,
				'type': 'line',
				'source': {
					'type': 'geojson',
					'data': {
						'type': 'FeatureCollection',
						'features': [{
							'type': 'Feature',
							'geometry': {
								'type': 'LineString',
								'coordinates': [
									[0, 0]
								]
							}
						}]
					}
				},
				'layout': {
					'line-cap': 'round',
					'line-join': 'round'
				},
				'paint': {
					'line-color': '#ed6498',
					'line-width': 2,
					'line-opacity': 0.8
				}
			});
			map.addLayer({
				'id': 'point_' + id,
				'source': {
					'type': 'geojson',
					'data': {
						'type': 'Point',
						'coordinates': [0, 0]
					}
				},
				'type': 'circle',
				'paint': {
					'circle-radius': 10,
					'circle-color': '#007cbf'
				}
			});

			function animate(timestamp) {
				return function () {
					let datetime = new Date(timestamp)
					let crossingAntiMeridianNumber = 0;
					let elapsedSec = 0;

					let lines = [
						[]
					];
					let before = getPosition(datetime)
					while (elapsedSec < limitSecond) {
						let lonlat = getPosition(datetime);
						if (counterclockwise) {
							if (lonlat[0] < 0 && before[0] > 0) {
								const lat = (lonlat[1] - before[1]) / (360 + lonlat[0] - before[0]) * (180 - before[0]) + before[1];
								lines[crossingAntiMeridianNumber].push([180, lat])
								lines[++crossingAntiMeridianNumber] = [
									[-180, lat]
								]
							}
						} else {
							if (lonlat[0] > 0 && before[0] < 0) {
								const lat = (lonlat[1] - before[1]) / (-360 + lonlat[0] - before[0]) * (-180 - before[0]) + before[1];
								lines[crossingAntiMeridianNumber].push([-180, lat])
								lines[++crossingAntiMeridianNumber] = [
									[180, lat]
								]
							}
						}

						lines[crossingAntiMeridianNumber].push(lonlat);
						before = lonlat
						if (elapsedSec < limitSecond / 2)
							setTimeout(function () {
								map.getSource('point_' + id).setData({
									'type': 'Point',
									'coordinates': lonlat
								});
							}, 50 * elapsedSec);

						datetime.setSeconds(datetime.getSeconds() + simulateUpdateSecond)
						elapsedSec += simulateUpdateSecond;
					}

					function createFeature(line) {
						return {
							'type': 'Feature',
							'geometry': {
								'type': 'LineString',
								'coordinates': line
							}
						}
					}
					let geojson = {
						'type': 'FeatureCollection',
						'features': lines.map(function (line) {
							return createFeature(line)
						})
					};
					map.getSource('line_' + id).setData(geojson);
					setTimeout(animate(datetime.getTime()), animationDurationMilliSecond * elapsedSec / 2);
				}
			}
			animate(now.getTime())();
		}

		if (texts.length > 1 && TLEValidator.validateTLE(texts[0].trim(), texts[1].trim())) {
			setAnimation(texts[0].trim(), texts[1].trim());
			document.getElementById("tle").value = "";
		} else {
			document.getElementById("error").innerText = "フォーマットが正しくありません。"
		}
	})
});
Javascriptはwebpackでコンパイルしています。コンパイルせず使いたい際はライブラリをダウンロードして適宜読み込ませてください。
ロジック
mapboxのAnimate a lineとAnimate a pointをベースに人工衛星特有のロジックを加えています。
function getAngularVelocity(datetime) {
    const positionAndVelocity = SGP4.propogate(satRec, datetime.getUTCFullYear(), datetime.getUTCMonth() + 1, datetime.getUTCDate(), datetime.getUTCHours(), datetime.getUTCMinutes(), datetime.getUTCSeconds());
    const position = positionAndVelocity.position;
    const velocity = positionAndVelocity.velocity;
    const posLength = Math.sqrt(position.x ** 2 + position.y ** 2 + position.z ** 2);
    const velLength = Math.sqrt(velocity.x ** 2 + velocity.y ** 2 + velocity.z ** 2);
    return {
        x: (position.y * velocity.z - position.z * velocity.y) / posLength / velLength,
        y: (position.z * velocity.x - position.x * velocity.z) / posLength / velLength,
        z: (position.x * velocity.y - position.y * velocity.x) / posLength / velLength
    }
}
SGP4.propogateは人工衛星の位置ベクトルと速度ベクトルを返します。
これを使って角速度ベクトルを求め回転方向を判別しています。
const counterclockwise = getAngularVelocity(datetime).z > 0;
経度180度線をまたぐ際はポリゴンを分割しないと表示がおかしなことになってしまうので配列を追加し、線が途切れないように線形補間で180度の点を与えています。
let lonlat = getPosition(datetime);
if (counterclockwise) {
    if (lonlat[0] < 0 && before[0] > 0) {
        const lat = (lonlat[1] - before[1]) / (360 + lonlat[0] - before[0]) * (180 - before[0]) + before[1];
        lines[crossingAntiMeridianNumber].push([180, lat])
        lines[++crossingAntiMeridianNumber] = [
            [-180, lat]
        ]
    }
} else {
    if (lonlat[0] > 0 && before[0] < 0) {
        const lat = (lonlat[1] - before[1]) / (-360 + lonlat[0] - before[0]) * (-180 - before[0]) + before[1];
        lines[crossingAntiMeridianNumber].push([-180, lat])
        lines[++crossingAntiMeridianNumber] = [
            [180, lat]
        ]
    }
}
表示はanimationDurationMilliSecond[ms]ごとにsimulateUpdateSecond[s]分進めます。
また軌道の予測線は、軌道maxRev周期またはmaxSecond[s]のより短い分描画します。
予測線は定期的に更新されます(元となるTLEを更新しているわけではないので、当然徐々に誤差が大きくなっていきます)。
const simulateUpdateSecond = 60;
const animationDurationMilliSecond = 50;
const maxSecond = 3600 * 24;
const maxRev = 1;
衛星例
代表的な衛星はこちらにまとめられているので参考にしてください。
国際宇宙ステーションや今流行りのstarlink、
連邦破産法11条の適用申請したonewebを見ることができます。
モルニヤ軌道をとるmolniya衛星なんかも面白いです。
この中に無い衛星のTLEはここで検索します。
例えば「みちびき」を調べたいときは「qzs」で検索すると見つかります。
**参考** [Two-line element set](https://en.wikipedia.org/wiki/Two-line_element_set) [きどうようそのひみつ](http://www.lizard-tail.com/isana/tle/misc/what_is_tle.html)