Cloud Optimized GeoTIFF (COG)とは
COGとは大まかに説明すると、TIFFに左上の地理座標(緯度経度座標やUTM座標)と1ピクセルごとの分解能や投影方法の情報を付加したGeoTIFFを、HTTP Rangeリクエストで取得しやすいよう拡張したフォーマットです。
Providing data as Cloud Optimized GeoTIFF
衛星写真などのラスターのGISデータを扱うときに海外ではデファクトスタンダードとなりつつありますが、日本語での資料があまりみられなかったので、調べたことをメモ程度に残しておきます。
下準備
GDALをインストールします。
詳しい方法は割愛しますが、ライブラリの依存関係などが面倒なのでAnacondaやDockerを利用することを強く勧めます。
Getting OGR to work on a Mac
今回試すファイルは次のサイトからお借りしました。
TIFF:[TIFF Sample Files]
(https://www.fileformat.info/format/tiff/sample/index.htm)
GeoTIFF:osgeo.org
COG: SkySat_Freeport
COG:AWS Landsat-8
GeoTIFFがCOGか調べる
How to read it with GDALに用意されているスクリプト(validate_cloud_optimized_geotiff.py )を利用します。
COG(warningが出ていますが、validと表示される)
$ python validate_cloud_optimized_geotiff.py LC08_L1TP_139045_20170304_20170316_01_T1_B2.tiff
The following warnings were found:
 - The file is greater than 512xH or Wx512, it is recommended to include internal overviews

LC08_L1TP_139045_20170304_20170316_01_T1_B2.tiff is a valid cloud optimized GeoTIFF
GeoTIFF(COGではないので NOT a valid と表示される)
$ python validate_cloud_optimized_geotiff.py SP27GTIF.tiff
The following warnings were found:
 - The file is greater than 512xH or Wx512, it is recommended to include internal overviews

SP27GTIF.tiff is NOT a valid cloud optimized GeoTIFF.
The following errors were found:
 - The offset of the main IFD should be 8. It is 649380 instead
 - The offset of the first block of the image should be after its IFD
TIFF(上に同じ)
$ python validate_cloud_optimized_geotiff.py CCITT_1.TIF
The following warnings were found:
 - The file is greater than 512xH or Wx512, it is recommended to include internal overviews

CCITT_1.TIF is NOT a valid cloud optimized GeoTIFF.
The following errors were found:
 - The file is greater than 512xH or Wx512, but is not tiled
 - The offset of the main IFD should be 8. It is 18120 instead
 - The offset of the first block of the image should be after its IFD
TIFFとGeoTIFFの判別はgdalinfoで可能です。
GeoTIFF
$ gdalinfo SP27GTIF.tiff
Driver: GTiff/GeoTIFF
Files: SP27GTIF.tiff
Size is 699, 929
Coordinate System is:
PROJCRS["NAD27 / Illinois East",
    BASEGEOGCRS["NAD27",
        DATUM["North American Datum 1927",
            ELLIPSOID["Clarke 1866",6378206.4,294.978698213898,
                LENGTHUNIT["metre",1]]],
中略

Data axis to CRS axis mapping: 1,2
Origin = (681480.000000000000000,1913050.000000000000000)
Pixel Size = (32.799999999999997,-32.799999999999997)
Metadata:
  AREA_OR_POINT=Area
  TIFFTAG_RESOLUTIONUNIT=1 (unitless)
  TIFFTAG_XRESOLUTION=72
  TIFFTAG_YRESOLUTION=72
Image Structure Metadata:
  INTERLEAVE=BAND
Corner Coordinates:
Upper Left  (  681480.000, 1913050.000) ( 87d39’59.59”W, 41d55’ 1.56”N)
Lower Left  (  681480.000, 1882578.800) ( 87d40’ 2.72”W, 41d50’ 0.54”N)
Upper Right (  704407.200, 1913050.000) ( 87d34’56.36”W, 41d54’59.69”N)
Lower Right (  704407.200, 1882578.800) ( 87d34’59.88”W, 41d49’58.67”N)
Center      (  692943.600, 1897814.400) ( 87d37’29.64”W, 41d52’30.14”N)
Band 1 Block=699x11 Type=Byte, ColorInterp=Gray
TIFF(Coordinate System や Originが表示されない)
a$ gdalinfo CCITT_1.TIF
Driver: GTiff/GeoTIFF
Files: CCITT_1.TIF
Size is 1728, 2376
Metadata:
  TIFFTAG_DOCUMENTNAME=Standard Input
  TIFFTAG_IMAGEDESCRIPTION=converted PBM file
  TIFFTAG_RESOLUTIONUNIT=2 (pixels/inch)
  TIFFTAG_XRESOLUTION=200
  TIFFTAG_YRESOLUTION=200
Image Structure Metadata:
  COMPRESSION=CCITTFAX4
  INTERLEAVE=BAND
  MINISWHITE=YES
Corner Coordinates:
Upper Left  (    0.0,    0.0)
Lower Left  (    0.0, 2376.0)
Upper Right ( 1728.0,    0.0)
Lower Right ( 1728.0, 2376.0)
Center      (  864.0, 1188.0)
Band 1 Block=1728x1 Type=Byte, ColorInterp=Palette
  Image Structure Metadata:
    NBITS=1
  Color Table (RGB with 2 entries)
    0: 255,255,255,255
    1: 0,0,0,255
GeoTIFF to COG
osgeo.orgにあるコマンドを3つ実行するだけです。
1. タイル化
gdal_translate {in.tiff} {temp.tiff} -co TILED=YES
TIFFは内部で画像を短冊状に保持する場合と、正方形のタイル状に保持する場合がありますが、COGではタイル状である必要があるため変換しておきます。
2. overviewを用意
gdaladdo -r nearest {temp.tiff} 2 4 8 16 32 64
ファイル名の後ろの数字(2, 4, 8...)分の縮小された画像を用意します。
これがあるとサイズの巨大ファイルでも気軽にブラウザ上で表示することができます。
この例ではオリジナルの1/2, 1/4, 1/8, 1/16, 1/32, 1/64のサイズが用意されます。
-r nearestで縮小時のサンプリング法を指定できます。averageやcubicも選択できますが、元のピクセルの値を変えたくない場合はnearestを選びましょう(デフォルト)。
3. COG化
gdal_translate {temp.tiff} {out.tif} -co TILED=YES -co COPY_SRC_OVERVIEWS=YES
最後にCOG化を行います。
元のピクセルと値が一致する必要がなければ-co COMPRESS=JPEGを付けて圧縮すると良いでしょう。
ブラウザで表示する
シカゴの衛星写真 SP27GTIF.TIF を上記コマンドでCOG化したものを例にブラウザでCOGを表示してみます。
geotiff.jsというライブラリを使います。
まずはGeoTIFFのメタ情報を表示してみます。
<!DOCTYPE html>
<html>

<head>
    <meta charset="UTF-8">
    <meta name="viewport" content="width=device-width, initial-scale=1.0" />
    <title>GeoTiff sample</title>
</head>

<body>
    Show Console.

    <script src="https://cdn.jsdelivr.net/npm/geotiff"></script>
    </script>
    <script>
        (async function () {
            const filepath = "{SP27GTIF_cog.tiff}"
            const tiff = await GeoTIFF.fromUrl(filepath);
            const pyramidNum = await tiff.getImageCount();
            console.log(`Pyramid: ${pyramidNum}`, );

            const image = await tiff.getImage(0);
            console.log(`Bounding box: ${image.getBoundingBox()}`);
            console.log(`Origin: ${ image.getOrigin()}`);
            console.log(`Resolution: ${image.getResolution()}`);
            console.log(`Size: ${image.getWidth()}, ${image.getHeight()}`);
            console.log(`Tile size: ${image.getTileWidth()}, ${image.getTileHeight()}`);
            console.log(`Band: ${image.getSamplesPerPixel()}`);
        })()
    </script>
</body>

</html>
注意
geotiff.jsはfetchでファイルを呼び出すので、ローカルのhtmlをそのまま呼び出すのでは動きません。
localhostを起動させるかサーバ上に置いて試しましょう。

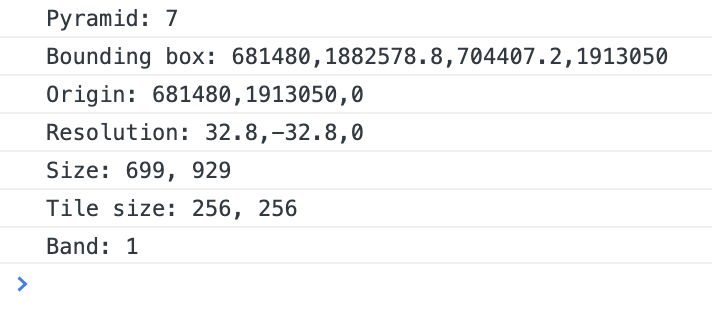
Pyramidは層の数(データ本体+overview、上記のコマンドで作成したCOGなので1+6=7)、Bounding boxはGeoTIFFが含んでいる範囲(この例ではUTM座標系の左下と右上のX座標Y座標)、Originは左上の座標、Resolutionは1ピクセルあたり分解能、Sizeは画像のピクセルサイズ、Tile sizeはCOG内部のタイルサイズ(256 or 512)、Bandは波長などのデータの種類(モノクロなら1、RGBカラーなら3)を表します。
表示は以下のように行います。
<!DOCTYPE html>
<html>

<head>
    <meta charset="UTF-8">
    <meta name="viewport" content="width=device-width, initial-scale=1.0" />
    <title>GeoTiff sample</title>
    <style>
        body {
            margin: 0;
            padding: 20px;
            width: 100%;
        }

        #images {
            width: 100%;
            display: flex;
            flex-wrap: wrap;
        }

        dl {
            margin-right: 20px;
        }

        dd {
            margin: 0;
        }
    </style>
</head>

<body>
    <div id="images"></div>

    <script src="https://cdn.jsdelivr.net/npm/geotiff"></script>
    </script>
    <script>
        (async function () {
            const filepath = "{SP27GTIF_cog.tiff}"
            const tiff = await GeoTIFF.fromUrl(filepath);
            const subfileNumber = await tiff.getImageCount();

            const readImageData = async (image, options = {}) => {
                const rasters = await image.readRasters(options);

                const {
                    width,
                    height
                } = rasters;
                const band = image.getSamplesPerPixel();
                const arr = [];

                for (let i = 0; i < rasters[0].length; i++) {
                    if (band > 1) {
                        arr[i * 4] = rasters[0][i];
                        arr[i * 4 + 1] = rasters[1][i];
                        arr[i * 4 + 2] = rasters[2][i];
                        arr[i * 4 + 3] = 255;
                    } else {
                        arr[i * 4] = rasters[0][i];
                        arr[i * 4 + 1] = rasters[0][i];
                        arr[i * 4 + 2] = rasters[0][i];
                        arr[i * 4 + 3] = 255;
                    }
                }
                const data = new Uint8ClampedArray(arr);
                return new ImageData(data, width, height);
            }

            const showImage = async (subfileIndex) => {
                const image = await tiff.getImage(subfileIndex);
                const maxSize = 1024;
                const width = maxSize < image.getWidth() ? maxSize : image.getWidth();
                const height = maxSize <
                    image.getHeight() ? maxSize : image.getHeight();
                let startX = parseInt((image.getWidth() - width) / 2);
                if (startX < 0) startX = 0;
                let endX = parseInt((image.getWidth() + width) / 2);
                if (endX > image.getWidth())
                    endX = image.getWidth();

                let startY = parseInt((image.getHeight() - height) / 2);
                if (startY < 0) startY = 0;
                let endY = parseInt((image.getHeight() + height) / 2);
                if (endY >
                    image.getHeight()) endY = image.getHeight();
                const data = await readImageData(image, {
                    window: [startX, startY, endX, endY]
                });

                const canvas = document.createElement('canvas');
                const ctx = canvas.getContext('2d');
                canvas.width = width;
                canvas.height = height;
                ctx.putImageData(data, 0, 0);
                const dl = document.createElement('dl');
                const dt = document.createElement('dt');
                dt.innerHTML = 'index: ' + subfileIndex;
                const dd = document.createElement('dd');
                dd.appendChild(canvas);
                dl.appendChild(dt);
                dl.appendChild(dd);

                document.getElementById('images').appendChild(dl);
            }

            for (let i = 0; i < subfileNumber; i++) {
                await showImage(i)
            }
        })()
    </script>
</body>

</html>
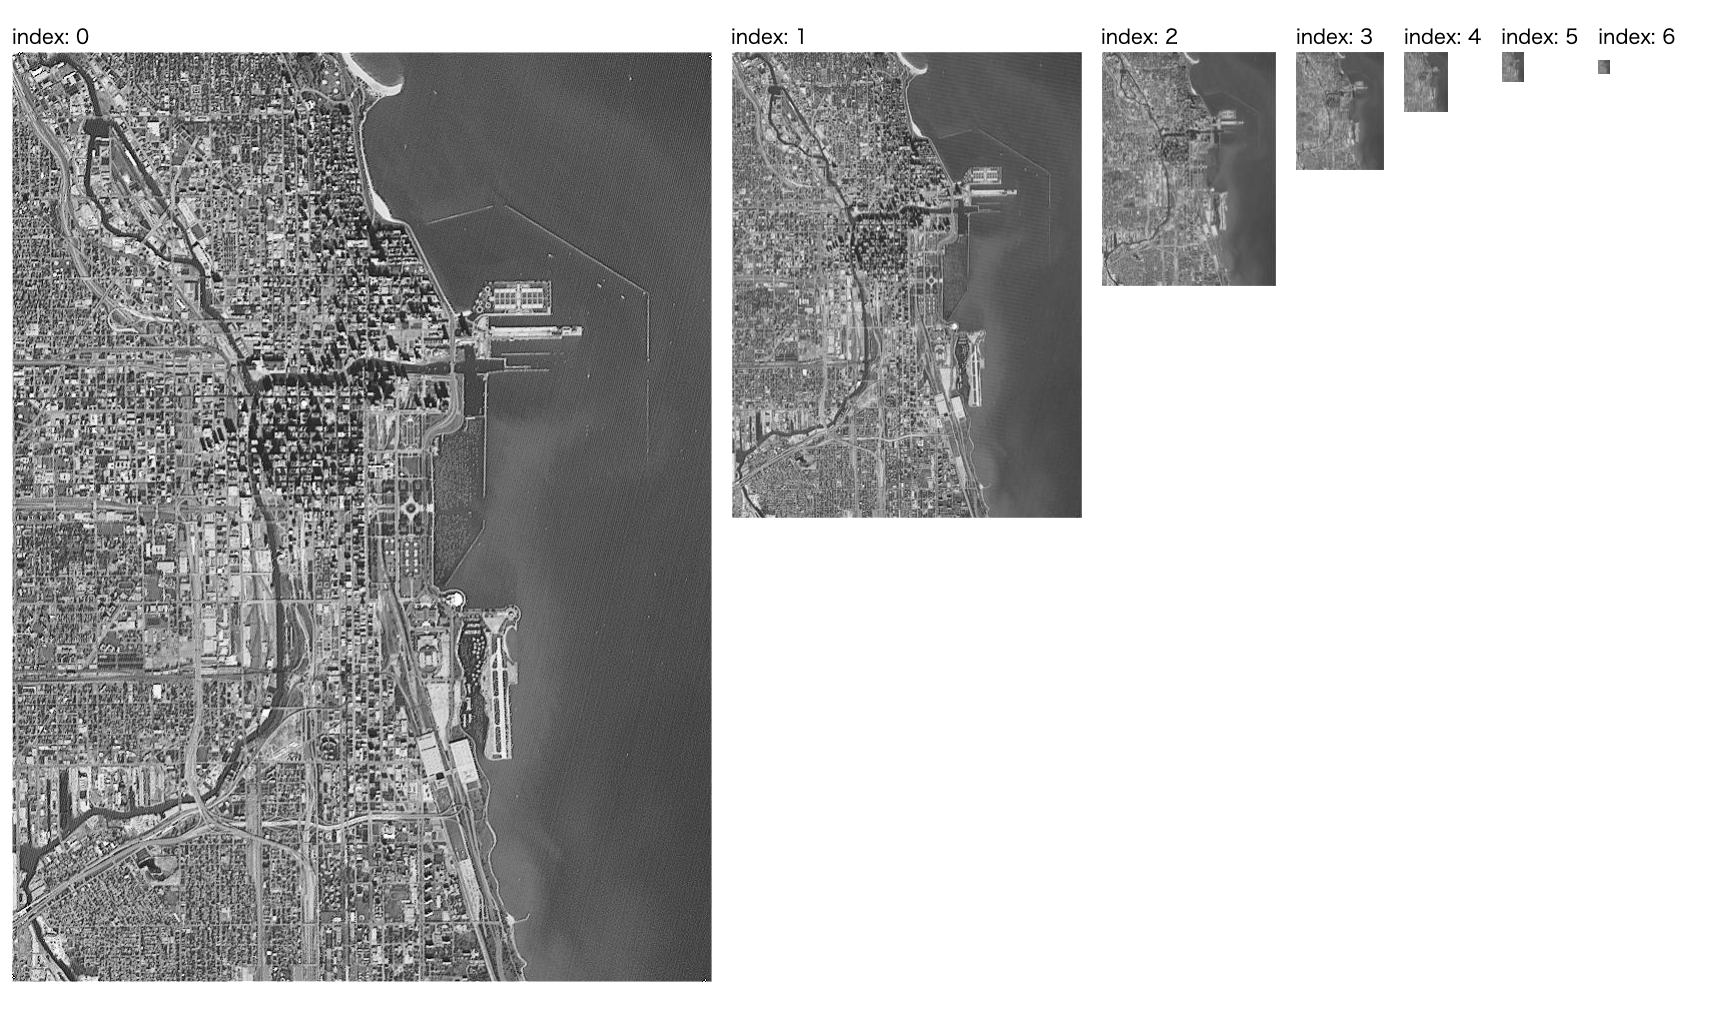
 サンプルHTMLではGeoTIFF内の全画像を取得して表示しています。
index:0はオリジナルのデータで、1~6は圧縮画像です。右に行くほどサイズが半分になっていくのがわかります。
SP27GTIF.TIFはモノクロ画像ですが、RGBカラー画像(SkySat_Freeport)もきちんと表示できます。
filepathを以下の様に書き換えてみてください。
filepath = "https://s3-us-west-2.amazonaws.com/planet-disaster-data/hurricane-harvey/SkySat_Freeport_s03_20170831T162740Z3.tif"
 大きい画像は中心から1024*1024ピクセルだけ取得して表示しています。
Landsat-8のカラー画像をブラウザで表示する
Landsat-8という衛星が観測したデータがAWS上で公開されています。
https://landsat-pds.s3.amazonaws.com/c1/L8/139/045/LC08_L1TP_139045_20170304_20170316_01_T1/index.html
ページを開くとわかりますが、Landsat-8のデータはバンド(波長)ごとにファイルが分けられています。
カラー画像を表示するために、青(B2)、緑(B3)、赤(B4)をダウンロードしてください。
(LC08_L1TP_139045_20170304_20170316_01_T1_B2.TIFなどファイル名の末尾で判断します)
このデータはすでに配布の時点でCOGですが、overviewが含まれていないので自分でコマンドを実行して再COG化します。
このとき圧縮をしたい場合は注意してください。
中身のデータがuint16なので-co COMPRESS=JPEGではエラーとなるため、圧縮方式をLZWにするなどしてください。
<!DOCTYPE html>
<html>

<head>
    <meta charset="UTF-8">
    <meta name="viewport" content="width=device-width, initial-scale=1.0" />
    <title>GeoTiff sample</title>
    <style>
        body {
            margin: 0;
            padding: 0;
            width: 100%;
        }

        #images {
            width: 100%;
            display: flex;
            flex-wrap: wrap;
        }

        dl {
            margin-right: 20px;
        }

        dd {
            margin: 0;
        }
    </style>
</head>

<body>
    <div id="images"></div>

    <script src="https://cdn.jsdelivr.net/npm/geotiff"></script>
    </script>
    <script>
        (async function () {
            const tiff = tiff_b = await GeoTIFF.fromUrl(   '{LC08_L1TP_139045_20170304_20170316_01_T1_B2_cog.tif}');
            const tiff_g = await GeoTIFF.fromUrl('{LC08_L1TP_139045_20170304_20170316_01_T1_B3_cog.tif}');
            const tiff_r = await GeoTIFF.fromUrl('{LC08_L1TP_139045_20170304_20170316_01_T1_B4_cog.tif}');

            const subfileNumber = await tiff.getImageCount();

            const readImageData = async (images, options = {}) => {
                const rasters = rasters_r = await images[0].readRasters(options);
                const rasters_g = await images[1].readRasters(options);
                const rasters_b = await images[2].readRasters(options);

                const {
                    width,
                    height
                } = rasters;
                const arr = [];
                let max = 255;
                let min = 0;
                for (let i = 0; i < rasters[0].length; i++) {
                    arr[i * 4] = rasters_r[0][i];
                    arr[i * 4 + 1] = rasters_g[0][i];
                    arr[i * 4 +
                        2] = rasters_b[0][i];
                    arr[i * 4 + 3] = Infinity;
                    min = Math.min(min, rasters_r[0][i], rasters_g[0][i],
                        rasters_b[0][i]);
                    max = Math.max(max, rasters_r[0][i], rasters_g[0][i], rasters_b[0][i]);
                }
                for (let i = 0; i <
                    arr.length; i++) {
                    if (arr[i] === Infinity) {
                        arr[i] = 255;
                    } else {
                        arr[i] = parseInt(255 * ((arr[i] - min) / (max -
                            min)), 10);
                    }
                }
                const data = new Uint8ClampedArray(arr);
                return new ImageData(data, width, height);
            }

            const showImage = async (subfileIndex) => {
                const image = image_b = await tiff_b.getImage(subfileIndex);
                const image_g = await tiff_g.getImage(subfileIndex);
                const image_r = await tiff_r.getImage(subfileIndex);
                const maxSize = 512;
                const width = maxSize < image.getWidth() ? maxSize : image.getWidth();
                const height = maxSize <
                    image.getHeight() ? maxSize : image.getHeight();
                let startX = parseInt((image.getWidth() - width) /
                    2);
                if (startX < 0) startX = 0;
                let endX = parseInt((image.getWidth() + width) / 2);
                if (endX >
                    image.getWidth()) endX = image.getWidth();

                let startY = parseInt((image.getHeight() - height) / 2);
                if (startY < 0) startY = 0;
                let endY = parseInt((image.getHeight() + height) / 2);
                if (endY >
                    image.getHeight()) endY = image.getHeight();

                const data = await readImageData([image_r, image_g, image_b], {
                    window: [startX, startY, endX, endY]
                });

                const canvas = document.createElement('canvas');
                const ctx = canvas.getContext('2d');
                canvas.width = width;
                canvas.height = height;
                ctx.putImageData(data, 0, 0);
                const dl = document.createElement('dl');
                const dt = document.createElement('dt');
                dt.innerHTML = 'index: ' + subfileIndex;
                const dd = document.createElement('dd');
                dd.appendChild(canvas);
                dl.appendChild(dt);
                dl.appendChild(dd);

                document.getElementById('images').appendChild(dl);
            }

            for (let i = 0; i < subfileNumber; i++) {
                await showImage(i)
            }
        })()
    </script>
</body>

</html>
データがuint16なため、uint8に変換する部分で少々工夫しています。
変換の影響で画像が全体的に白っぽくなってしまっていますが、画像の加工の探求は割愛します。

以上がCloud Optimized GeoTIFF (COG)を作って表示する流れです。
より使いこなすにはgdalのオプションやgeotiff.jsの使い方に精通する必要がありますが、触ってみるだけなら上記で十分だと思うのでまずは試してみてください。