はじめに
ここでは、ポートフォリオ理論における効率的フロンティア(The Efficient Frontier) の概要を説明したのち、Rを使い計算と可視化をします。ここでは2種類の資産項目で構成されたポートフォリオに限定します。3種類以上の資産で構成されたポートフォリオの効率的フロンティアの計算は最適化問題が少し複雑になるのでまたの機会にまとめます。
金融の基礎知識、ベクトル行列、R言語にある程度知見がある方向けに書いています。
効率的フロンティア(The Efficient Frontier) とは
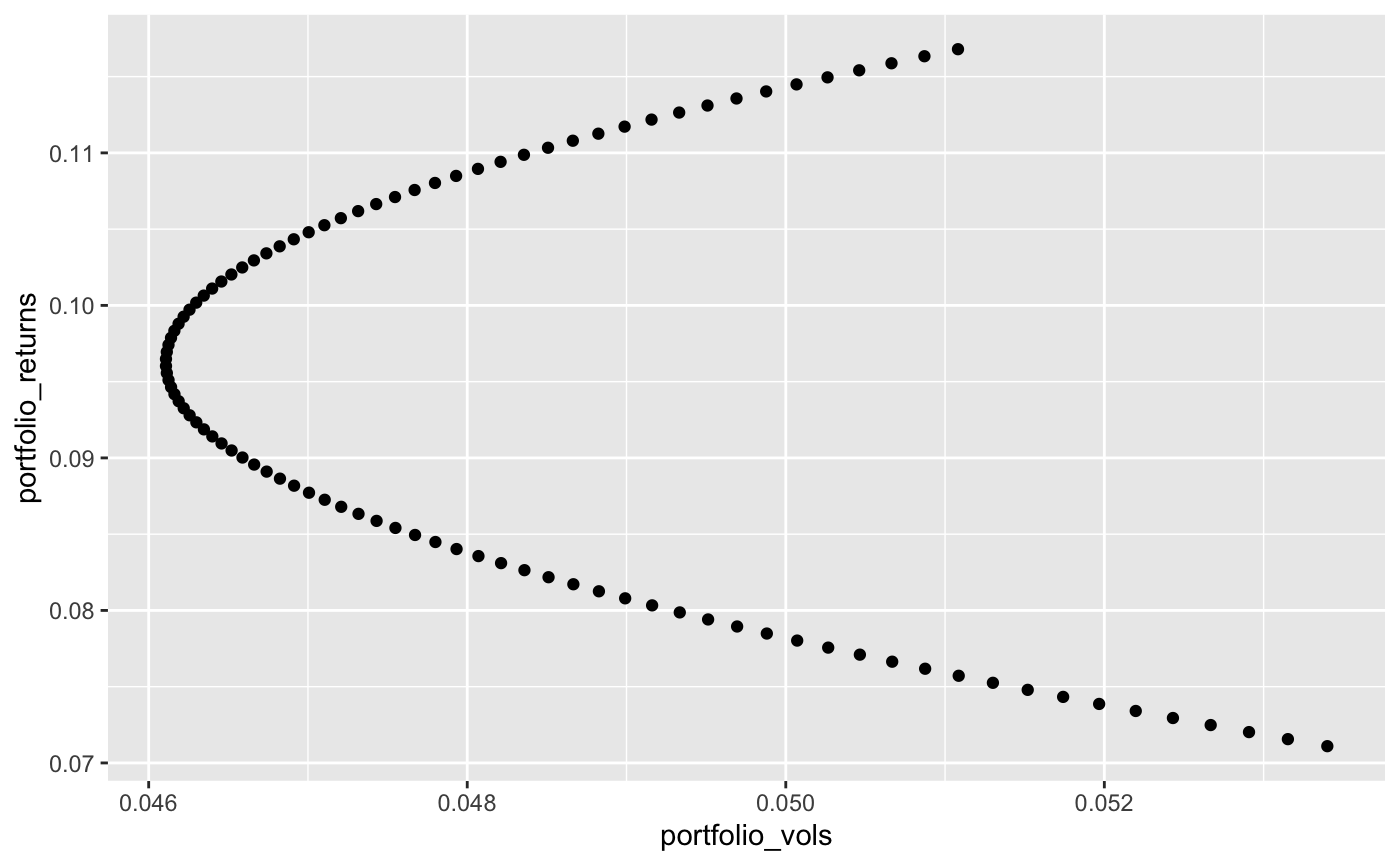
効率的フロンティア(The Efficient Frontier) とは、現代ポートフォリオ理論における概念で、定義されたリスクレベル(Volatility)に対して最高の期待リターンを提供する、または与えられた期待リターンレベルに対して最低のリスクを持つ最適なポートフォリオの集合を表します。効率的フロンティアの下に位置するポートフォリオは、そのリスクレベルに対して十分なリターンを提供しないため、非最適です。効率的フロンティアの右側に集まるポートフォリオも非最適です。なぜなら、定義されたリターン率に対して高いリスクを持っているからです。
以下のグラフは2種類の資産で構成されるリターン(portfolio_returns)とリスクレベル(portfolio_vols)の分布です。

リスクとリターンの空間または平均分散フレームワークにおいて、資産AとBから成るポートフォリオのリスクとリターンについて説明します。ポートフォリオがAまたはBのみから構成されている場合、そのリスクとリターンはそれぞれAまたはBのものとなります。AとBに均等に投資を分けたポートフォリオのリターンは、AとBのリターンの加重平均となります。しかし、そのようなポートフォリオのリスクやボラティリティは、AとBの相関関係を知らなければ決定できません。AとBが完全に相関している場合、それらは同じ資産のように振る舞います。資産間の相関関係は、ポートフォリオを構築する際の重要な要素です。
簡単に言えば、ポートフォリオを作るときには、それぞれの資産がどれだけリターンを出すかだけでなく、資産同士がどれだけ関連して動くかも考える必要があります。資産が互いに関連しているほど、ポートフォリオ全体のリスクも変わってきます。
資産A&Bにおけるポートフォリオのリターン
$$ R_p = \sum_{i=1}^{k} w_i R_i $$
$k$ = ポートフォリオ内の資産の数
または、
$$ R_p = \mathbf{w}^T \mathbf{R} $$
$\mathbf{w}^T$ = 重みの転置ベクトル
$\mathbf{R}$ = リターンベクトル
資産A&Bにおけるポートフォリオのリスク(Volatility)
$$
\sigma_p^2 = \sum_{i=1}^{k} \sum_{j=1}^{k} w_i w_j \sigma_{ij}
$$
$w_i$ and $w_j$ = ポートフォリオ内の資産の重み
memo: $ covaliance\ \sigma_{ij} = \sigma_i\ \times \sigma_j\ \times \rho_{ij}$
$\sigma_i\ \sigma_j$ = 格資産の標準偏差
$\rho_{ij}$ = 資産$i,j$の相関係数
または、
$$\sigma_p^2 = \mathbf{w}^T \Sigma \mathbf{w}$$
$\mathbf{w}$ = 重みベクトル
$\mathbf{w^T}$ = 重みの転置ベクトル
$\mathbf{\Sigma}$ = 資産収益の共分散行列
Rでの実装
それでは各業界の月間リターンのデータを元に効率的フロンティア(The Efficient Frontier)を可視化してみましょう。
ind = read.csv('data/ind30_m_vw_rets.csv')

# Set column names to the date vector
ind <- ind  %>%
   mutate(X = paste(as.character(X), "01",sep = "")) %>%
   mutate(X = as.Date(X,"%Y%m%d")) %>%
   filter(between(X,as.Date("1996-01-01"),as.Date("2000-12-31")))

# Change ratio % to decimos
rownames(ind) = ind$X ind = ind %>%
		select(-X) ind = ind/100head(ind)
| Food | Beer | Smoke | Games | … | |
|---|---|---|---|---|---|
| 1996-01-01 | 0.0342 | 0.0326 | 0.0182 | 0.0469 | … |
| 1996-02-01 | 0.0162 | 0.0561 | 0.0318 | 0.0179 | … |
| 1996-03-01 | -0.0382 | 0.0190 | -0.0768 | 0.0108 | … |
| 1996-04-01 | -0.0032 | -0.0089 | -0.0160 | 0.0237 | … |
| 1996-05-01 | 0.0550 | 0.0969 | 0.0548 | 0.0279 | … |
| … | … | … | … | … | … |
年複利成長(Compound grow)を計算し、各業界の年間リターンを算出
# Calculate compound growth
compounded_growth = sapply(ind, function(x) prod(x + 1))
n_periods = nrow(ind)

# Periods_per_year is 12 since it is monthly data
periods_per_year = 12

# Calculate annual return
annualized_return = compounded_growth**(periods_per_year/n_periods)-1

annualized_return
Food        Beer       Smoke       Games       Books       Hshld       Clths
 0.11679867  0.14112579  0.10783044  0.06821155  0.18728565  0.13476603  0.07916
重みを想定し、ポートフォリオ(Food,Beer,Smoke,Coal)を作成しリターンを算出
er = annualized_return[c(1,2,3,18)]

# Designate portfolio weights
weights = rep(0.25, 4)

# Calculate portfolio return
portfolio_return <- t(weights) %*% er

portfolio_return
0.195111
重みを想定し、ポートフォリオ(Food,Beer,Smoke,Coal)を作成しリスクレベルを算出
er = annualized_return[c(1,2,3,18)]

# Designate portfolio weights
weights = rep(0.25, 4)

# Calculate covariance matrixs
covmat = head(cov(ind %>% select(c(Food,Beer,Smoke, Coal))))

# Calculate portfolio volatility
portfolio_vol =(t(weights) %*% covmat %*% weights) ** 0.5portfolio_vol
0.0550592
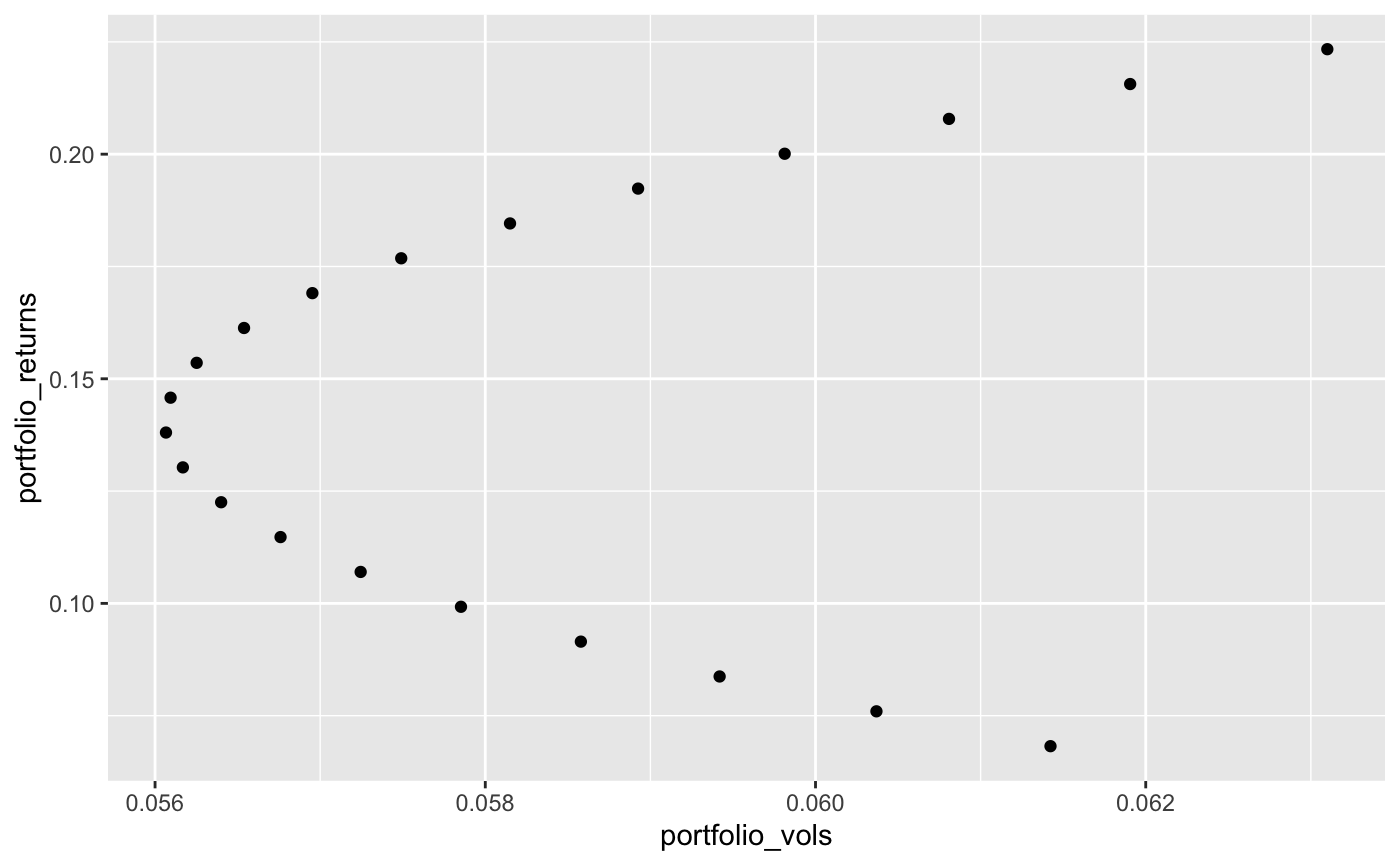
リターンとリスクレベルにおいて格試算項目の比重を計算し可視化
ここでは21通りのパターンを計算
# Get annualized return of Games(4) and Fin(29) industory from df
er = annualized_return[c(4,29)]

# Get covariance matrixs of Games and Fin
covmat = cov(ind %>% select(c(Games, Fin)))

# Calculate weights vectors in different weight balance percentage
n_points = 21
weights = seq(0, 1, length.out = n_points)
weights = sapply(weights, function(x) c(x, 1 - x))

# Calcualte portfolio return
portfolio_returns = t(weights) %*% er

# Calcualte portfolio volatility Run for loop for each weights convinations
portfolio_vols = c()
for (n in 1:ncol(weights)) {
  portfolio_vols = append(portfolio_vols,(t(weights[,n]) %*% covmat %*% weights[,n]) ** 0.5)
  }

# Gather portfolio return and volatility
plot = data.frame(portfolio_returns, portfolio_vols)

# Plot by geom_point()
ggplot(plot, aes(x = portfolio_vols, y = portfolio_returns)) +
   geom_point()
ファンクションに返還
plot.efficient.frontier = function(df, v, p = 20){

      compounded_growth = sapply(df, function(x) prod(x + 1))
      n_periods = nrow(df)
      annualized_return = compounded_growth**(12/n_periods)-1

      er = annualized_return[v]
      covmat = cov(df %>% select(colnames(df[c(v)])))
      n_points = p
      weights = seq(0, 1, length.out = n_points)
      weights = sapply(weights, function(x) c(x, 1 - x))

      portfolio_returns = t(weights) %*% as.matrix(er)

      portfolio_vols = c()

      for (n in 1:ncol(weights)) {
        portfolio_vols = append(portfolio_vols,(t(weights[,n]) %*% covmat %*% weights[,n]) ** 0.5)
      }

      plot = data.frame(portfolio_returns, portfolio_vols)

      ggplot(plot, aes(x = portfolio_vols, y = portfolio_returns)) +
        geom_point()
}

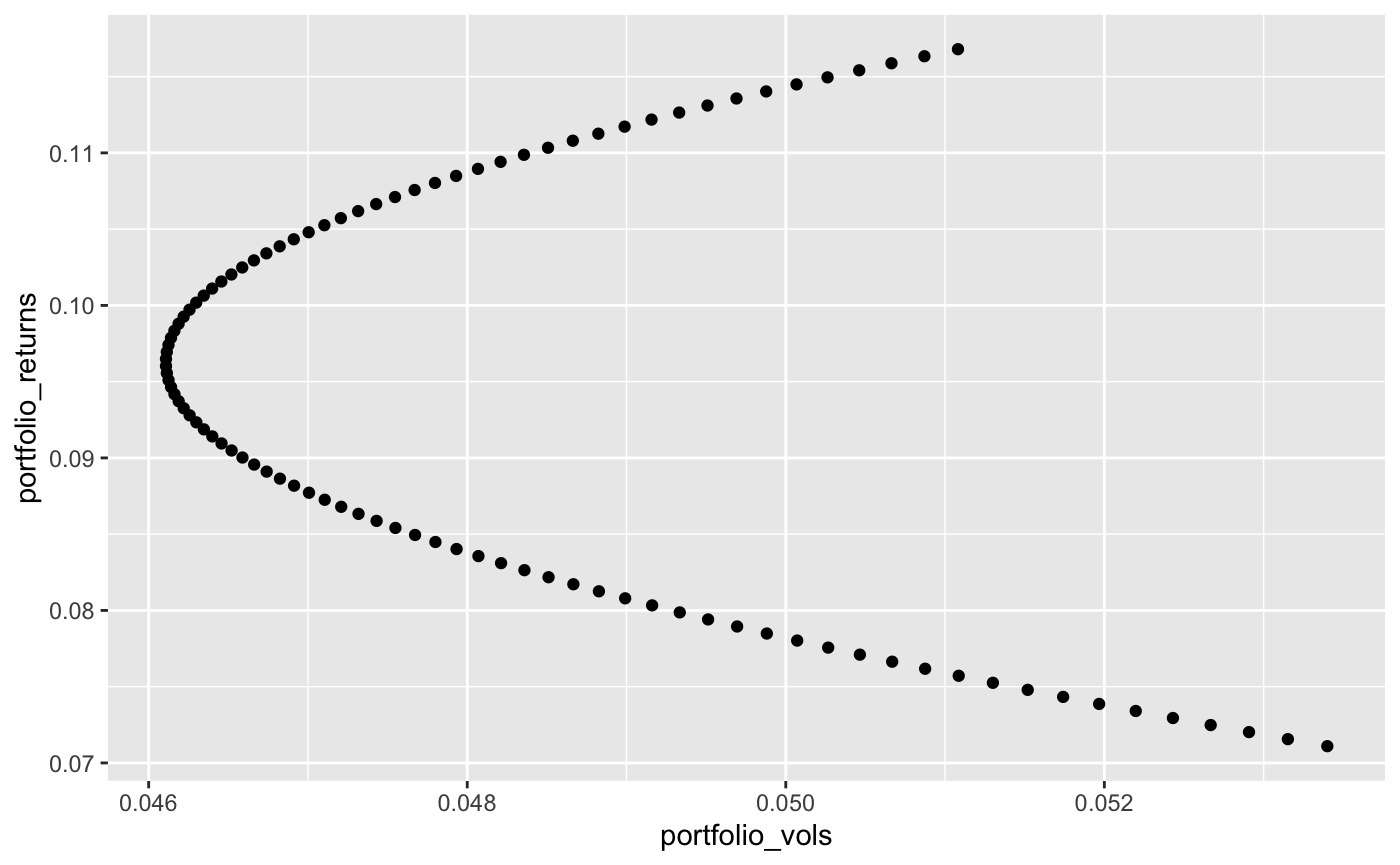
plot.efficient.frontier(ind, c(1,25), 100)
終わりに
ここでは効率的フロンティアに関する基礎的な知識と計算方法、またその可視化について説明いたしました。ポートフォリの多様性がポートフォリオ全体のリスクレベルを下げより強固なものになる事がわかりました。3種類以上の試算項目を含んだ実装も今後まとめるつもりです。

