やること
動画のどのフレームのどの位置にどんなものが映っているかを特定する。
googleのVideo Intelligence APIを使用して動画から物体検出を行う。
本記事で紹介するコードは公式の入門ガイドをベースにした実装になっている。
準備
Video Intelligence API
公式ガイドのAPIに対する認証までを完了してサービスアカウントキーファイルを取得しておく。
google colaboratory
実装と結果の確認はgoogle colaboratoryを使用する。
こちらの記事にあるようにサービスアカウントキーファイルをcolaboratoryにアップロードしておく。
毎回やるのが面倒な場合はマウントするgoogle driveに入れておく方法もあるがうっかり共有してしまわないように注意が必要である。
解析対象の画像
Video Intelligence API では
- GCPのStorageに保存してある動画ファイル
- ローカルに保存してある動画ファイル
を解析することができる。GCPのStorageに保存してある動画ファイルを使用する場合はAPIの料金の他、Storageに使用料金がかかるので、ちょっと試して見る程度であればローカルがおすすめ。
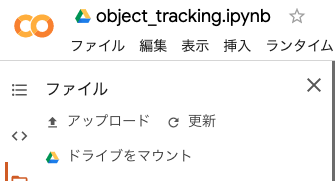
今回は「ローカルに保存してある動画ファイル」を解析する手法で行うため、google driveに解析したい動画を保存しておき、colaboratoryにドライブをマウントしておく。
ドライブのマウントはcolaboratoryの左側のペインから可能。
なお、動画を用意する場合はVideo Intelligence APIの利用料金について考慮する。
【補足】Video Intelligence APIの利用料(2020年3月現在)
Video Intelligence APIは解析する動画の長さ(尺)に応じて従量課金される。
長さは分単位で計算され、1分未満は切り上げになるので以下の3つのパターンでアノテーションを行った場合全て同じ利用料となる。
- 2分30秒の動画を1つ
- 1分30秒の動画と30秒の動画を1つずつ
- 30秒の動画を3つ
各アノテーションの料金は以下の通り
| 機能 | 最初の 1,000 分 | 1,000 分超 |
|---|---|---|
| ラベル検出 | 無料 | $0.10/分 |
| ショット検出 | 無料 | $0.05/分、ラベル検出を利用している場合は無料 |
| 不適切コンテンツ検出 | 無料 | $0.10/分 |
| 音声文字変換 | 無料 | $0.048/分(音声文字変換の課金対象は対応言語の en-US のみ) |
| オブジェクト トラッキング | 無料 | $0.15/分 |
| テキスト検出 | 無料 | $0.15/分 |
| ロゴ検出 | 無料 | $0.15/分 |
| Celebrity recognition | 無料 | $0.10/分 |
実装
videointelligenceを使用する準備
videointelligenceのクライアントをインストールする
!pip install -U google-cloud-videointelligence
videointelligenceのクライアントを作成する
まず、APIに対する認証で取得したサービスアカウントキーファイルを使用して認証を行う。
service_account_key_nameはcolaboratoryにアップロードしたサービスアカウントキーファイルのパス。
import json
from google.cloud import videointelligence
from google.oauth2 import service_account

# APIの認証
service_account_key_name = "{YOUR KEY.json}"
info = json.load(open(service_account_key_name))
creds = service_account.Credentials.from_service_account_info(info)

# クライアントを作成
video_client = videointelligence.VideoIntelligenceServiceClient(credentials=creds)
APIを実行する
まず動画をドライブから読み込む。
# 処理対象の動画を指定して読み込む
import io

path = '{YOUR FILE PATH}'
with io.open(path, 'rb') as file:
    input_content = file.read()
次にAPIを実行して結果を取得する
features = [videointelligence.enums.Feature.OBJECT_TRACKING]
timeout = 300
operation = video_client.annotate_video(input_content=input_content, features=features, location_id='us-east1')

print('\nProcessing video for object annotations.')
result = operation.result(timeout=timeout)
print('\nFinished processing.\n')
結果の確認
検出されたオブジェクトの一覧を表示する
jupyter notebookはpandasのDataFrameを良い感じに勝手に描画してくれるので、レスポンスから必要な情報だけ抜き取ってDataFrameを生成する。
今回はレスポンスのobject_annotationsから以下のものを取得する。
| カラム名 | 内容 | ソース |
|---|---|---|
| Description | オブジェクトの説明(名前) | entity.description |
| Confidence | 検出の信頼性 | confidence |
| SegmentStartTime | オブジェクトが映っているセグメントの開始時間 | segment.start_time_offset |
| SegmentEndTime | オブジェクトが映っているセグメントの終了時間 | segment.end_time_offset |
| FrameTime | オブジェクトが検出されたフレームが動画の先頭から何秒目にあるか | frames[i].time_offset |
| Box{XXX} | オブジェクトのbounding boxの各辺の座標を100分率にしたもの | frames[i].normalized_bounding_box |
# 検出されたobjectを一覧表示する
import pandas as pd
columns=['Description', 'Confidence', 'SegmentStartTime', 'SegmentEndTime', 'FrameTime', 'BoxLeft', 'BoxTop', 'BoxRight', 'BoxBottom', 'Box', 'Id']
object_annotations = result.annotation_results[0].object_annotations
result_table = []
for object_annotation in object_annotations:
for frame in object_annotation.frames:
box = frame.normalized_bounding_box
result_table.append([
object_annotation.entity.description,
object_annotation.confidence,
object_annotation.segment.start_time_offset.seconds + object_annotation.segment.start_time_offset.nanos / 1e9,
object_annotation.segment.end_time_offset.seconds + object_annotation.segment.end_time_offset.nanos / 1e9,
frame.time_offset.seconds + frame.time_offset.nanos / 1e9,
box.left,
box.top,
box.right,
box.bottom,
[box.left, box.top, box.right, box.bottom],
object_annotation.entity.entity_id
])
# 膨大になるので、とりあえず各セグメントの最初のframeだけ
break
df=pd.DataFrame(result_table, columns=columns)
pd.set_option('display.max_rows', len(result_table))
# Confidenceでソートして表示
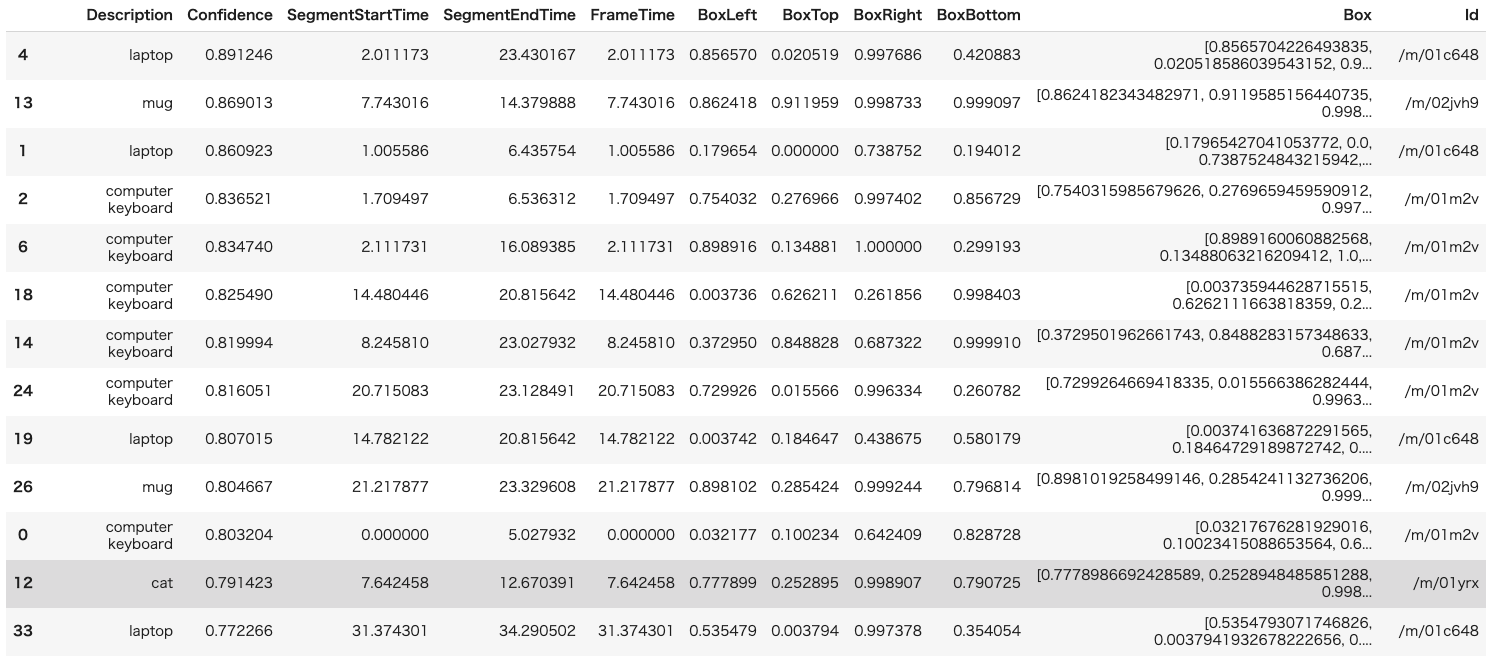
df.sort_values('Confidence', ascending=False)
実行すると以下のような結果が得られる。
オブジェクトが検出されたフレームを静止画で一覧表示する
まず、上述のtime_offsetの情報をもとに動画からフレームを抜き出す。
動画から静止画の取得はopenCVを使用する。切り出す静止画をフレームで指定する必要があるため、動画のFPSとtime_offset(秒)からおおよそのフレーム数を算出する。
import cv2

images = []
cap = cv2.VideoCapture(path)

if cap.isOpened():
    fps = cap.get(cv2.CAP_PROP_FPS)
    for sec in df['FrameTime']:
        # fpsと秒から何フレーム目かを計算する
        cap.set(cv2.CAP_PROP_POS_FRAMES, round(fps * sec))
        ret, frame = cap.read()
        if ret:
            images.append(cv2.cvtColor(frame, cv2.COLOR_BGR2RGB))
次に、openCVのrectangleで切り出したそれぞれの静止画に映っているオブジェクトに枠を付ける。
rectangleは描画したい長方形の左上と右下の頂点を指定する必要があるためこの2点を得る必要がある。
APIから返却されるnormalized_bounding_boxの中には4辺の情報(left,top,right,bottom)があり、例えば以下の画像でpersonの位置を示すboxのleftの値は l(画像の左端からboxの左端までの幅) / width(画像全体の幅)なのでleftの値から頂点1(pt1)のx座標を求める場合はwidth * leftと逆算すれば良い。
メソッドを適当に用意しておく。

# 画像上の座標を求める
def ratio_to_pics(size_pics, ratio):
    return math.ceil(size_pics * ratio)

# box から左上と右下の頂点を得る
def rect_vertex(image, box):
    height, width  = image.shape[:2]
    return[
        (
            ratio_to_pics(width, box[0]), ratio_to_pics(height, box[1])
        ),
        (
            ratio_to_pics(width, box[2]), ratio_to_pics(height, box[3])
        )
    ]
上記のメソッドを使用して枠の頂点の位置を計算しながら、実際に枠を画像に書き込んでいく。
boxed_images = []
color = (0, 255, 255)
thickness = 5
for index, row in df.iterrows():
    image = images[index]
    boxed_images.append(cv2.rectangle(image,  *rect_vertex(image, row.Box), color,  thickness = thickness))
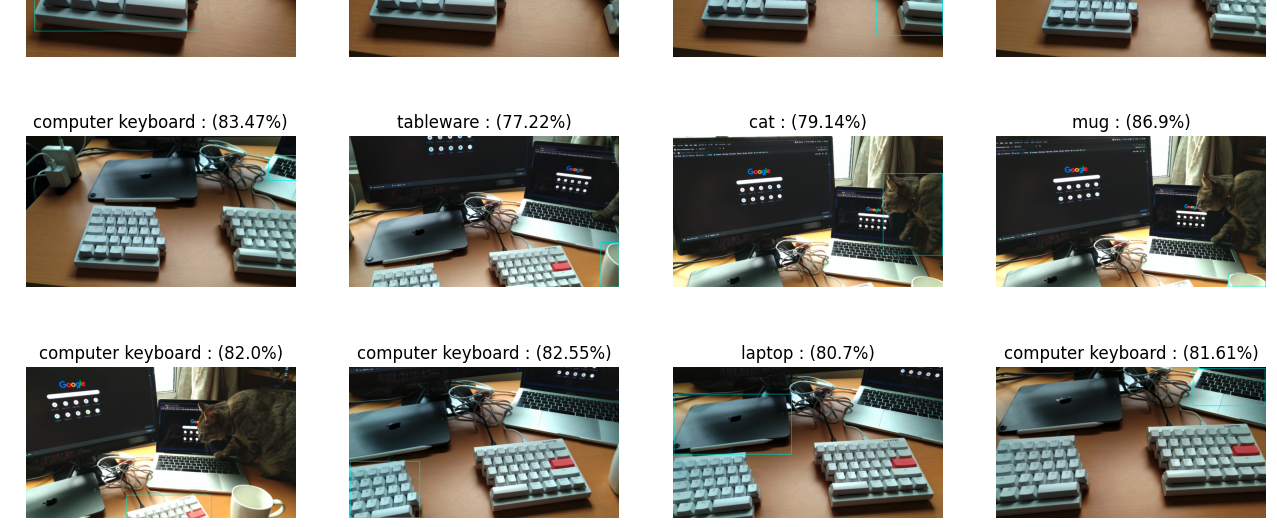
最後に各画像にDescriptionとConfidenceを添えて表示する。
なお、動画の尺や検出されたオブジェクトの数によってはすべて表示すると時間がかかるためConfidenceにしきい値を設けている。
import math
import matplotlib.pyplot as plt

# confidenceで適当に足切りする
min_confidence = 0.7

# figureの諸々を設定する
col_count = 4
row_count = math.ceil(len(images) / col_count)
fig = plt.figure(figsize = (col_count * 4, row_count * 3), dpi = 100)
num = 0

# 静止画を並べて表示する
for index, row in df.iterrows():
    if row.Confidence < min_confidence:
        continue
    num += 1
    fig.add_subplot(row_count, col_count, num, title = '%s : (%s%s)' % (row.Description, round(row.Confidence * 100, 2), '%'))
    plt.imshow(boxed_images[index], cmap='gray')
    plt.axis('off')
実行すると以下のような結果が得られる。
参考
Colaboratory 上から Cloud Video Intelligence API を使い、動画を解析した結果を表示する。
公式の入門ガイド