エアコンをラズパイから操作できるようになったので、室温と湿度をから自動的にエアコンをつけたいと思った。
温湿度は前の記事を参考にBME280で取得する。
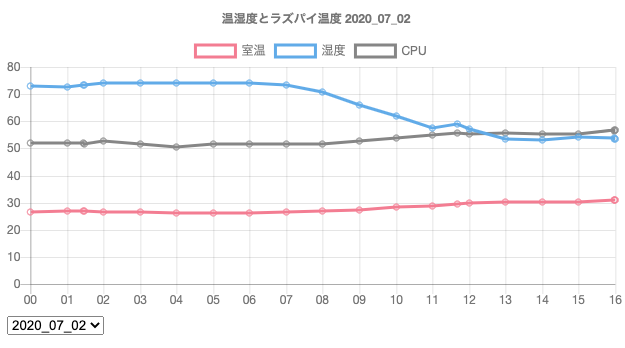
ついでにラズパイのCPU温度も取得してグラフにする。
まずは完成したグラフがこちら
コード
window.onload = function() {
  view();
  let sl = document.querySelector("select.date")
  sl.value = today();
}

function view(date) {
  if (!date) date = today();
  let room_temp = [];
  let room_hum = [];
  let cpu = [];
  let labels = []

  fetch('http://192.168.3.2/temperature/getData.php?date=' + date)
    .then(function(response) {
      return response.text();
    })
    .then(function(myJson) {
      // console.log(myJson)
      myJson = JSON.parse(myJson);
      // console.log(myJson)
      myJson.forEach((e) => {
        room_temp.push(parseFloat(e.room_temp));
        room_hum.push(parseFloat(e.room_hum));
        cpu.push(parseFloat(e.cpu));
        labels.push(getDatetime(new Date(Number(e.time * 1000))))
      })
      graf(labels, room_temp, room_hum, cpu, date)
    });
}

function change() {
  let sl = document.querySelector("select.date")
  view(sl.value);
}

function getDatetime(now) {
  let Hour = ("0" + now.getHours()).slice(-2);
  let Min = ("0" + now.getMinutes()).slice(-2);
  let Sec = ("0" + now.getSeconds()).slice(-2);
  return Hour + ":" + Min;
}

function today(date) {
  let now = new Date();
  let Y = now.getFullYear();
  let M = ("0" + (Number(now.getMonth()) + 1)).slice(-2);
  let D = ("0" + now.getDate()).slice(-2);
  return date = Y + '_' + M + '_' + D;
}

function graf(labels, room_temp, room_hum, cpu, date) {

  let ctx = document.getElementById('myChart').getContext('2d');

  let myChart = new Chart(ctx, {
    type: "line",
    data: {
      labels: labels,
      datasets: [{
        label: "室温",
        data: room_temp,
        borderColor: "rgb(255, 99, 132)",
        backgroundColor: "rgba(255, 99, 132, 0)"
      }, {
        label: "湿度",
        data: room_hum,
        borderColor: "rgb(54, 162, 235)",
        backgroundColor: "rgba(54, 162, 235, 0)"
      }, {
        label: "CPU",
        data: cpu,
        borderColor: "rgb(120, 120, 120)",
        backgroundColor: "rgba(54, 162, 235, 0)"
      }]
    },
    options: {
      tooltips: {
        callbacks: {}
      },
      title: {
        display: true,
        text: '温湿度とラズパイ温度 ' + date
      },
      elements: {
        line: {
          tension: 0
        }
      },
      scales: {
        xAxes: [{
          type: 'time',
          time: {
            parser: "mm:ss",
            unit: 'minute',
            unitStepSize: 1,
            displayFormats: {
              'minute': 'mm',
            },

          }
        }],
        yAxes: [{
          ticks: {
            beginAtZero: true
          },

        }]
      }
    }
  });
}
解説
DB
+-----------+---------+------+-----+---------+----------------+
| Field     | Type    | Null | Key | Default | Extra          |
+-----------+---------+------+-----+---------+----------------+
| id        | int(11) | NO   | PRI | NULL    | auto_increment |
| room_temp | float   | YES  |     | NULL    |                |
| room_hum  | float   | YES  |     | NULL    |                |
| cpu       | float   | YES  |     | NULL    |                |
| time      | int(11) | YES  |     | NULL    |                |
+-----------+---------+------+-----+---------+----------------+
timeはUnixタイムスタンプ(秒)
javascriptについて
DBからデータを取ってくる関数がこちら。
function view(date) {
  if (!date) date = today();
  let room_temp = [];
  let room_hum = [];
  let cpu = [];
  let labels = []

  fetch('http://192.168.3.2/temperature/getData.php?date=' + date)
    .then(function(response) {
      return response.text();
    })
    .then(function(myJson) {
      // console.log(myJson)
      myJson = JSON.parse(myJson);
      // console.log(myJson)
      myJson.forEach((e) => {
        room_temp.push(parseFloat(e.room_temp));
        room_hum.push(parseFloat(e.room_hum));
        cpu.push(parseFloat(e.cpu));
        labels.push(getDatetime(new Date(Number(e.time * 1000))))
      })
      graf(labels, room_temp, room_hum, cpu, date)
    });
}
撮ってきたデータをオブジェクトに格納するのだが、chart.jsが処理できるデータにする必要があるのでここでは以下のような操作をしている。
- 温度、湿度それぞれの配列へデータを入れていくがその際、DBからの値を文字列から数字に変換して格納している。
- X軸として配列labelsへ自覚情報を渡しているが、DBに登録しているUnixタイムスタンプは秒なのでミリ秒に直している。
そうしてできたデータをグラフを表示する関数grafへ渡している。