R Advent Calendar 2020 13日目の記事です
まずはこちらをご覧下さい
これは、今年2月から12月までのコロナ感染者数の累積人数をgif animationで示したものです。
今多くの地域でコロナウイルスの感染者数が急激に増大しているのは言うまでもありません。
しかし、このように実際にデータの可視化してみないと気が付かない点も多く有ると思います。
今回の場合ですとインド、ブラジル、アメリカの感染者数の変化の仕方に大きな違いが有ることが見て取れます。また、フランスもここ数ヶ月で急増していることが一目瞭然です。
いま多くのメディアがどのように感染者が増大しているかをニュースや新聞で報道しています。もちろんこれらの情報は重要ですし、しっかりとしたソースにあたって情報収集することは大事なことです。
しかしこれらのプロットを自分で表現することはさして難しいことではなくなっています。
グラフに必要なデータは全てオープンソースですし、可視化に扱うR言語もフリーで使うことができます。
このように自力でデータを可視化し、どのような状況になっているかを自分の手と目で作ることによって受動的に得られる情報とはまた違う気づきが得られると思っています。
そこで、今回の記事では、コロナウイルス感染者のデータを日にちごと、国別でプロットしアニメーションにする方法を解説していきます。
コード
私のGitHubに今回のスクリプトが上がっているので、動かすだけならコピペでokです。
動作環境
- OS: Windows 10 Home
- CPU: Intel Core i7-8565U
- RAM: 16 GB
- R version 4.0.2 (2020-06-22)
- R.Studio 1.3.1093
また、扱うパッケージは以下の通りです。(カッコ内はversion)
- tidyverse (1.3.0)
- gganimate (1.0.6)
- lubridate (1.7.9)
- gifski (0.8.6)
- transformr (0.1.3)
- scales (1.1.1)
- magrittr(1.5)
はじめに
今回用いるデータはour World in Dataが掲載しているデータとなっています。
gitHubにおいてcsv, json, xlsxファイルが提供されておりこれらを用いて解析を行っていくことが可能です。今回はcsvファイルを使用します。
csvのロードはread_csv()関数であり、直接ウェブ上のcsvを参照できます。
library(tidyverse)
library(gganimate)
library(lubridate)
library(gifski)
library(transformr)
library(scales)
library(magrittr)

Covid_19 <-  read_csv("https://covid.ourworldindata.org/data/owid-covid-data.csv")

Covid_19
# A tibble: 60,106 x 50
   iso_code continent location date       total_cases new_cases new_cases_smoot~ total_deaths new_deaths new_deaths_smoo~
   <chr>    <chr>     <chr>    <date>           <dbl>     <dbl>            <dbl>        <dbl>      <dbl>            <dbl>
 1 AFG      Asia      Afghani~ 2020-01-23          NA         0               NA           NA          0               NA
 2 AFG      Asia      Afghani~ 2020-01-24          NA         0               NA           NA          0               NA
 3 AFG      Asia      Afghani~ 2020-01-25          NA         0               NA           NA          0               NA
 4 AFG      Asia      Afghani~ 2020-01-26          NA         0               NA           NA          0               NA
 5 AFG      Asia      Afghani~ 2020-01-27          NA         0               NA           NA          0               NA
 6 AFG      Asia      Afghani~ 2020-01-28          NA         0                0           NA          0                0
 7 AFG      Asia      Afghani~ 2020-01-29          NA         0                0           NA          0                0
 8 AFG      Asia      Afghani~ 2020-01-30          NA         0                0           NA          0                0
 9 AFG      Asia      Afghani~ 2020-01-31          NA         0                0           NA          0                0
10 AFG      Asia      Afghani~ 2020-02-01          NA         0                0           NA          0                0
# ... with 60,096 more rows, and 40 more variables: total_cases_per_million <dbl>, new_cases_per_million <dbl>,
#   new_cases_smoothed_per_million <dbl>, total_deaths_per_million <dbl>, new_deaths_per_million <dbl>,
#   new_deaths_smoothed_per_million <dbl>, reproduction_rate <dbl>, icu_patients <lgl>, icu_patients_per_million <lgl>,
#   hosp_patients <lgl>, hosp_patients_per_million <lgl>, weekly_icu_admissions <lgl>,
#   weekly_icu_admissions_per_million <lgl>, weekly_hosp_admissions <lgl>, weekly_hosp_admissions_per_million <lgl>,
#   total_tests <lgl>, new_tests <lgl>, total_tests_per_thousand <lgl>, new_tests_per_thousand <lgl>,
#   new_tests_smoothed <lgl>, new_tests_smoothed_per_thousand <lgl>, positive_rate <lgl>, tests_per_case <lgl>,
#   tests_units <lgl>, stringency_index <dbl>, population <dbl>, population_density <dbl>, median_age <dbl>,
#   aged_65_older <dbl>, aged_70_older <dbl>, gdp_per_capita <dbl>, extreme_poverty <dbl>, cardiovasc_death_rate <dbl>,
#   diabetes_prevalence <dbl>, female_smokers <dbl>, male_smokers <dbl>, handwashing_facilities <dbl>,
#   hospital_beds_per_thousand <dbl>, life_expectancy <dbl>, human_development_index <dbl>
実行してみるとわかりますが、かなり膨大なデータです。そこで今回は累計感染者Top 5のデータを可視化することにしましょう。
では、現時点で累計感染者が多い国はどこかを検索します。filter()関数を使って12/2現在ののデータを見てみます。
既にdate列はdate型になっているのでlubridateパッケージのtoday()関数が使えます。
その後、slice_maxを用いてtotal_cases(累計感染者数)の上位5カ国を抽出します。
ここで、全世界の累計感染者が常に一位となるため、予めそれは除外しておきます。
Covid_19_top <-
  Covid_19 %>%
  mutate("date" = ymd(date)) %>%
  filter(
    date == today(),
    location != "World"
  ) %>%
  slice_max(order_by = total_cases, n = 5)

Covid_19_top$location
[1] "United States" "India"         "Brazil"        "Russia"        "France"
どうやらアメリカ、インド、ブラジル、ロシア、フランスが現在累計感染者のTop 5であるようです。
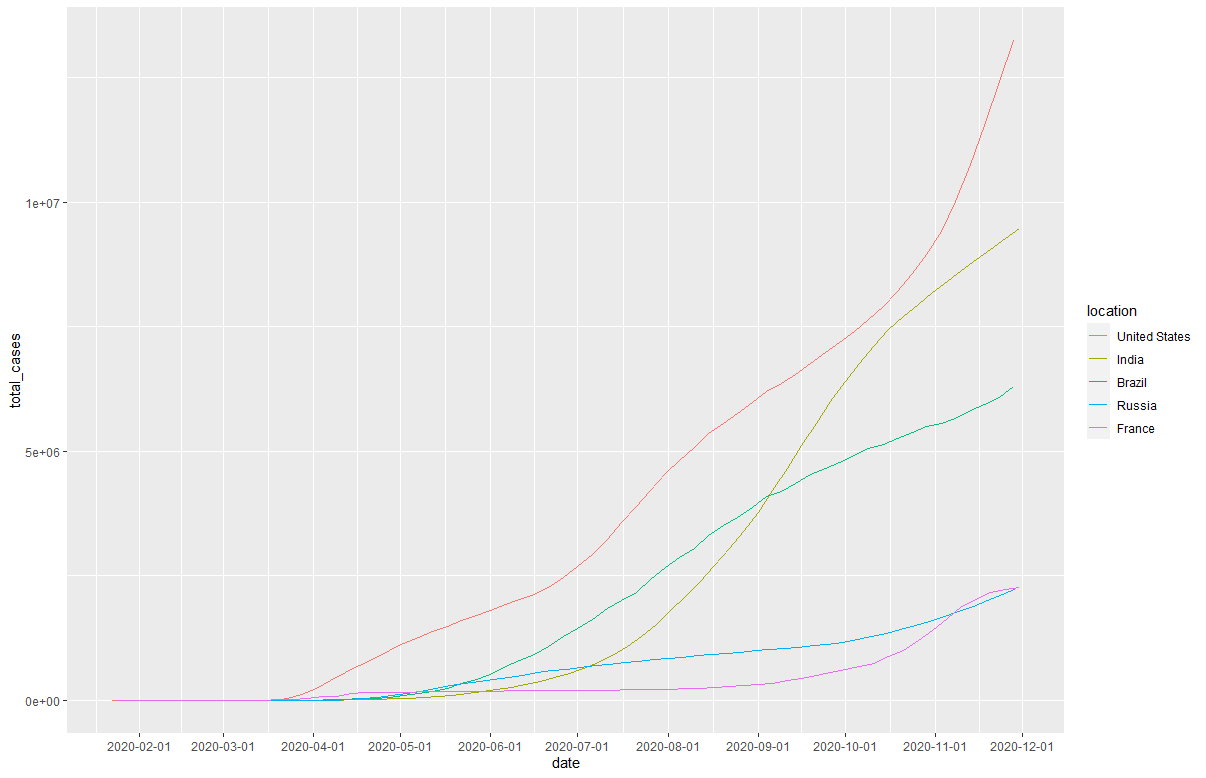
まず、いきなりアニメーションを作る前にどのようなプロットになるのかを軽く見てみることにしましょう。
このような可視化にはggplotパッケージが非常に有効です。
Covid_19 %>%
  select(location, date, total_cases) %>%
  drop_na() %>%
  filter(
    location == Covid_19 _top$location
  )  %>% #locationのうちの上位5カ国だけにする
  mutate(
    location = as_factor(location) %>% fct_relevel(Covid_19_top$location)
    ) %>% #locationをfactor型に変え、多い順に並べ替え
  ggplot(aes(date, total_cases, color = location, group = location)) +
  scale_x_date(date_breaks = "1 month") + # 1ヶ月ごとに目盛りを入れる
  geom_line()
この地点でかなり良い可視化ができていますが、アニメーションにすることによって
より感染者数の増大速度をイメージしやすくなります。
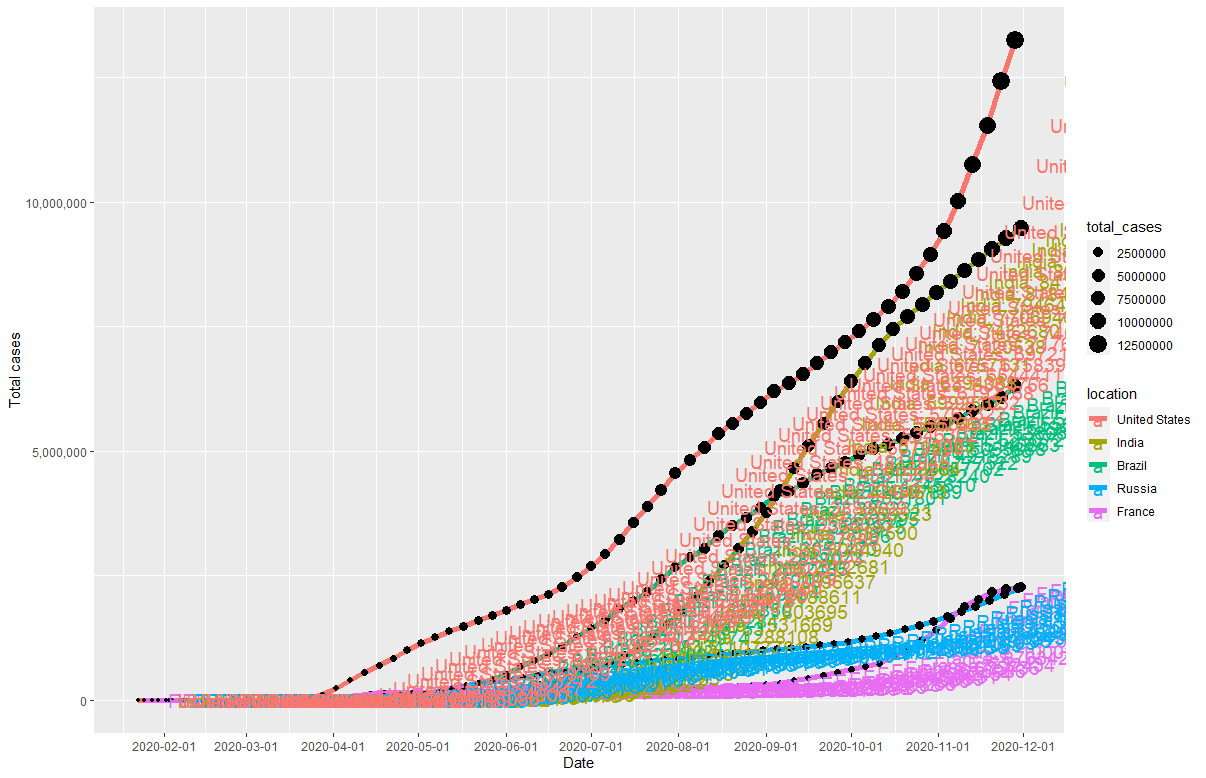
また、増大していく人数も表記してみます。geom_text()関数を用いることでグラフのpointの横にその時の人数を出力することができます。
まずは一枚絵として色々変更していきましょう。
  Covid_19 %>%
  select(location, date, total_cases) %>%
  drop_na() %>%
  filter(
    location == Covid_19_top$location
  )  %>% #locationのうちの上位5カ国だけにする
  mutate(
    location = as_factor(location) %>% fct_relevel(Covid_19_top$location)
    ) %>% #locationをfactor型に変え、多い順に並べ替え
  ggplot(aes(date, total_cases, size = total_cases, group = location)) +
  geom_line(aes(color = location), size = 1.5) +
  geom_point(aes(size = total_cases)) +
  scale_x_date(date_breaks = "1 month") +
  labs(x = "Date", y = "Total cases") + # label名の変更
  geom_text(aes(color = location, label = paste0(location, ": ", total_cases)), hjust = -0.3, size = 5) +
  # pointの横に感染者数を明記
  scale_y_continuous(label = comma, limits = c(0, NA))
かなりぐちゃぐちゃな図になっていますが、(国名):(感染者数)というテキストがグラフ中に書かれています。
あとはこれを日付ごとにレンダリングし、gifアニメーションとして出力すれば完成です。
gganimationパッケージに含まれている、transition_reveal()関数, animate()関数でレンダリングし、anim_save()関数でgifを保存します。
transition_reveal()関数では、何を基準にしてアニメーションを作成するかを決めます。
今回は日ごとに動いてほしいので、transition_reveal(date) とします。
animate()関数は、出力されるgifアニメーションの時間、fps、幅、高さを
duration, fps, width, heightで決めることができます。
あまり大きくしすぎるとレンダリングの時間がかかってしまうほか、メモリ不足に陥るので注意して下さい。
Covid_animation <-
  Covid_19 %>%
  select(location, date, total_cases) %>%
  drop_na() %>%
  filter(
    location == Covid_19_top$location
  )  %>% #locationのうちの上位5カ国だけにする
  mutate(
    location = as_factor(location) %>% fct_relevel(Covid_19_top$location)
    ) %>% #locationをfactor型に変え、多い順に並べ替え
  ggplot(aes(date, total_cases, size = total_cases, group = location)) +
  geom_line(aes(color = location), size = 1.5) +
  geom_point(aes(size = total_cases)) +
  scale_x_date(date_breaks = "1 month") +
  labs(x = "Date", y = "Total cases") + # label名の変更
  geom_text(aes(color = location, label = paste0(location, ": ", total_cases)), hjust = -0.3, size = 5) + # pointの横に感染者数を明記
  scale_y_continuous(label = comma, limits = c(0, NA)) + # y軸のlabelを3桁ごとにコンマを打つように変更
  transition_reveal(date)
  animate(Covid_animation, duration = 20, fps = 30, width = 960, height = 480)
  anim_save("output.gif")
レンダリングに少々時間(私の環境だと5 minぐらい)がかかりますが、気長に待ちましょう。
そしてできたものがこちらになります。
終わりに
今回はコロナウイルス感染者の可視化を行いました。
こういった可視化を伴って、感染者数の急増の要因はなんであったかを考えてみるのも良いと思います。
また、今回使っているデータもそうですが、生データは常にアップデートされていきます。情報のアップデートに追いつくためにも、このようなプログラムを一つ作っておくことは重要であると思います。


