概要説明
Maps JavaScript APIを使ってGoogle Mapに町丁目ポリゴンを表示してみました。この記事はOpenLayersを使ってOpenStreetMapに町丁目ポリゴンを表示してみる(OpenLayers v6)のGoogle Map版です。
使用するもの
Google Map
Google Mapは、Googleが提供する地図サービスであり、地域情報を検索することも可能です。知らない街への外出など、日常的に利用している人も多いのではないでしょうか。
Maps JavaScript API
Maps JavaScript APIはGoogle Mapで提供されている API の中の一つで、ウェブアプリ用に動的でインタラクティブな地図、位置情報、地理空間のエクスペリエンスを作成し、独自の画像やコンテンツを使って地図を高度にカスタマイズすることができます。
Google Map上にマーカーを表示したり、データをマップ上に可視化したりなど、マップの活用幅をグッと広げることができます。
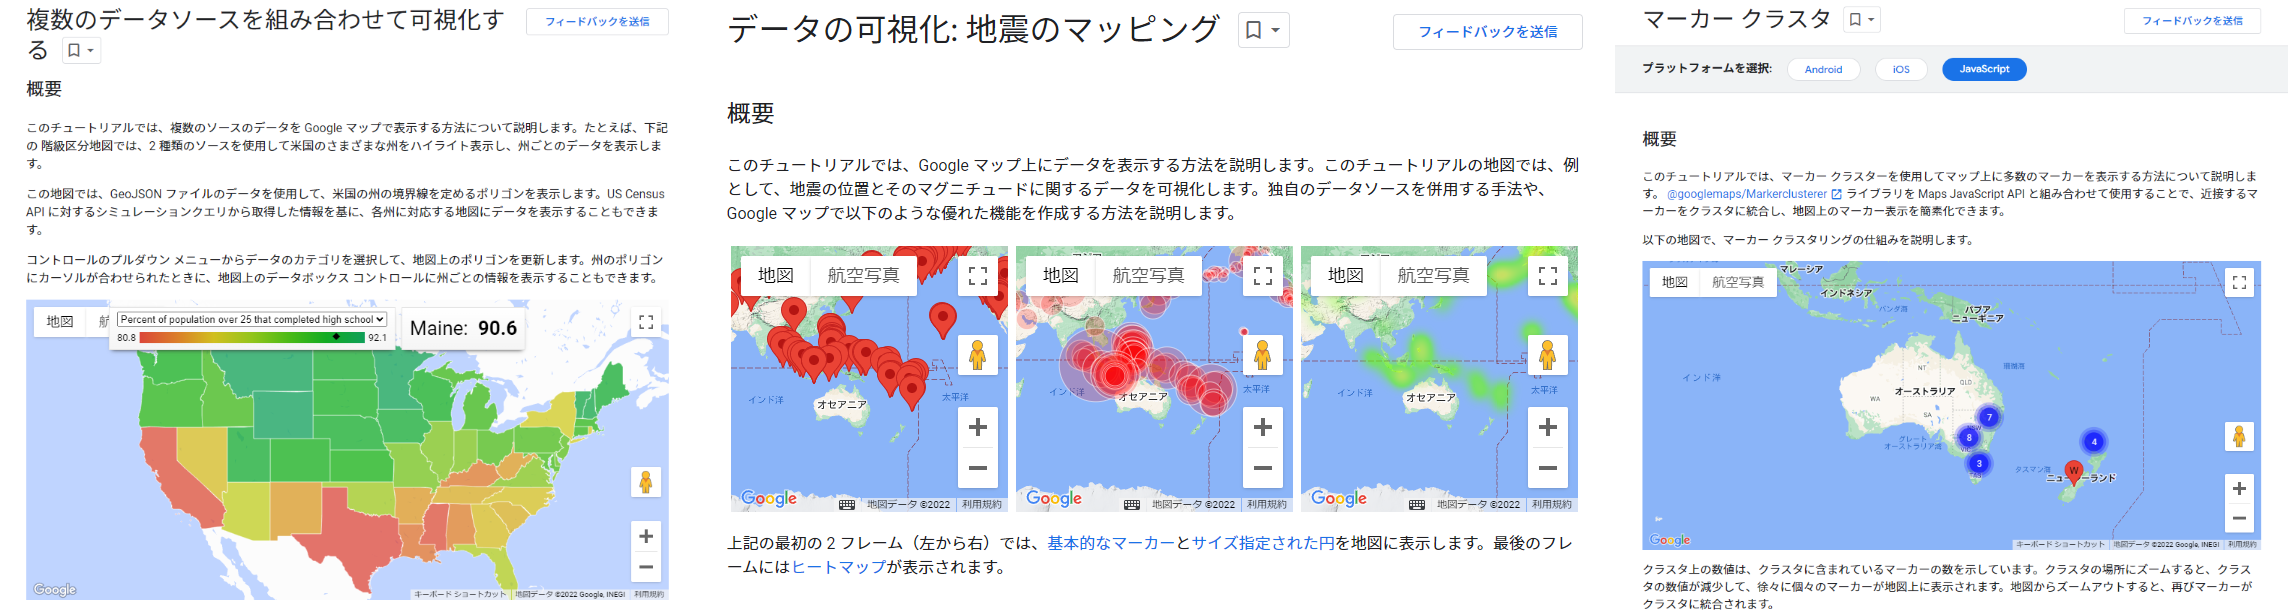
画像はMaps JavaScript APIより引用
町丁目ポリゴン
町丁目とは行政界の一つで「富士見町3丁目」「広尾1丁目」など「●丁目」で表わされる行政区画のことです。行政界は他には都道府県や市区町村、大字などがあります。
町丁目ポリゴンは、官報および自治体の情報をもとに作成・更新されている、●町や●丁目などの行政界エリアデータのこと。
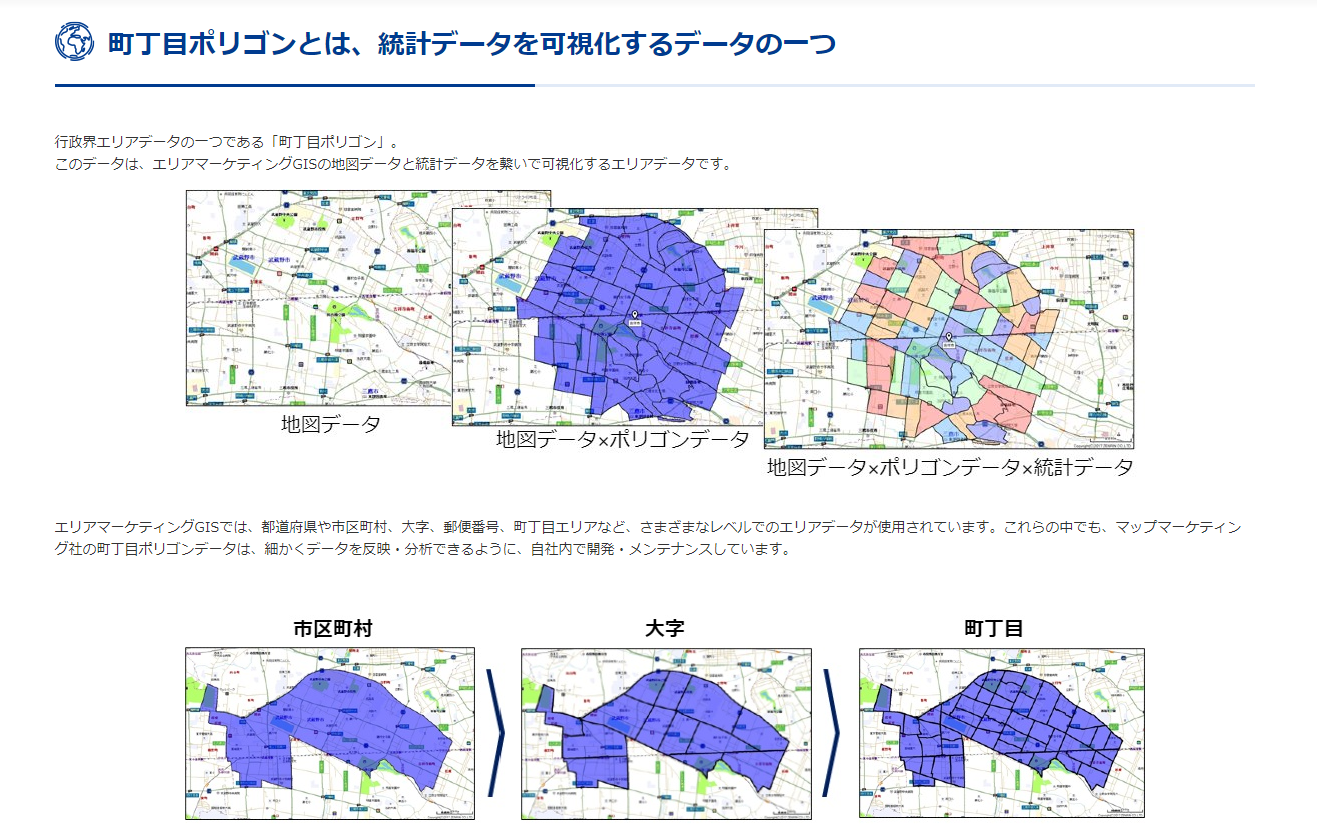
画像はマップマーケティングの町丁目ポリゴンデータより引用
町丁目ポリゴンはe-stat(日本の統計が閲覧できる政府統計ポータルサイト)からダウンロードすることもできます。e-statでは小地域(町丁・字等別)という名称で公開されています。
e-statの小地域(町丁・字等別)のポリゴンを地図に描画することもできますが、e-statからダウンロードしたりShapefileやKMLのファイルをシステムに取り込んだりするのが手間なので、マップマーケティングのTerraMap APIを使って取得した町丁目ポリゴンを表示させてみます。
Google Maps APIキーを用意する
Google Mapを表示するにはAPIキーの用意が必須となります。
- Google Cloud Consoleでセットアップする
- プロジェクトを作成する
- 課金を有効にする(アプリをデプロイするには、課金を有効にする必要があります。無料の割り当て範囲を超えなければ、アカウントには課金されません。)
- Maps JavaScript APIを有効にする
具体的な操作手順はMaps JavaScript APIのCloud Consoleでの設定を参照してください
- APIキーを取得する
- APIキーを作成する
- キーの制限をします(アプリケーションに必要な API しか使用しないよう、API キーの使用に制限をかけておくことを強くおすすめします。)
具体的な操作手順はMaps JavaScript APIのAPI キーを使用するを参照してください
Google Mapの表示
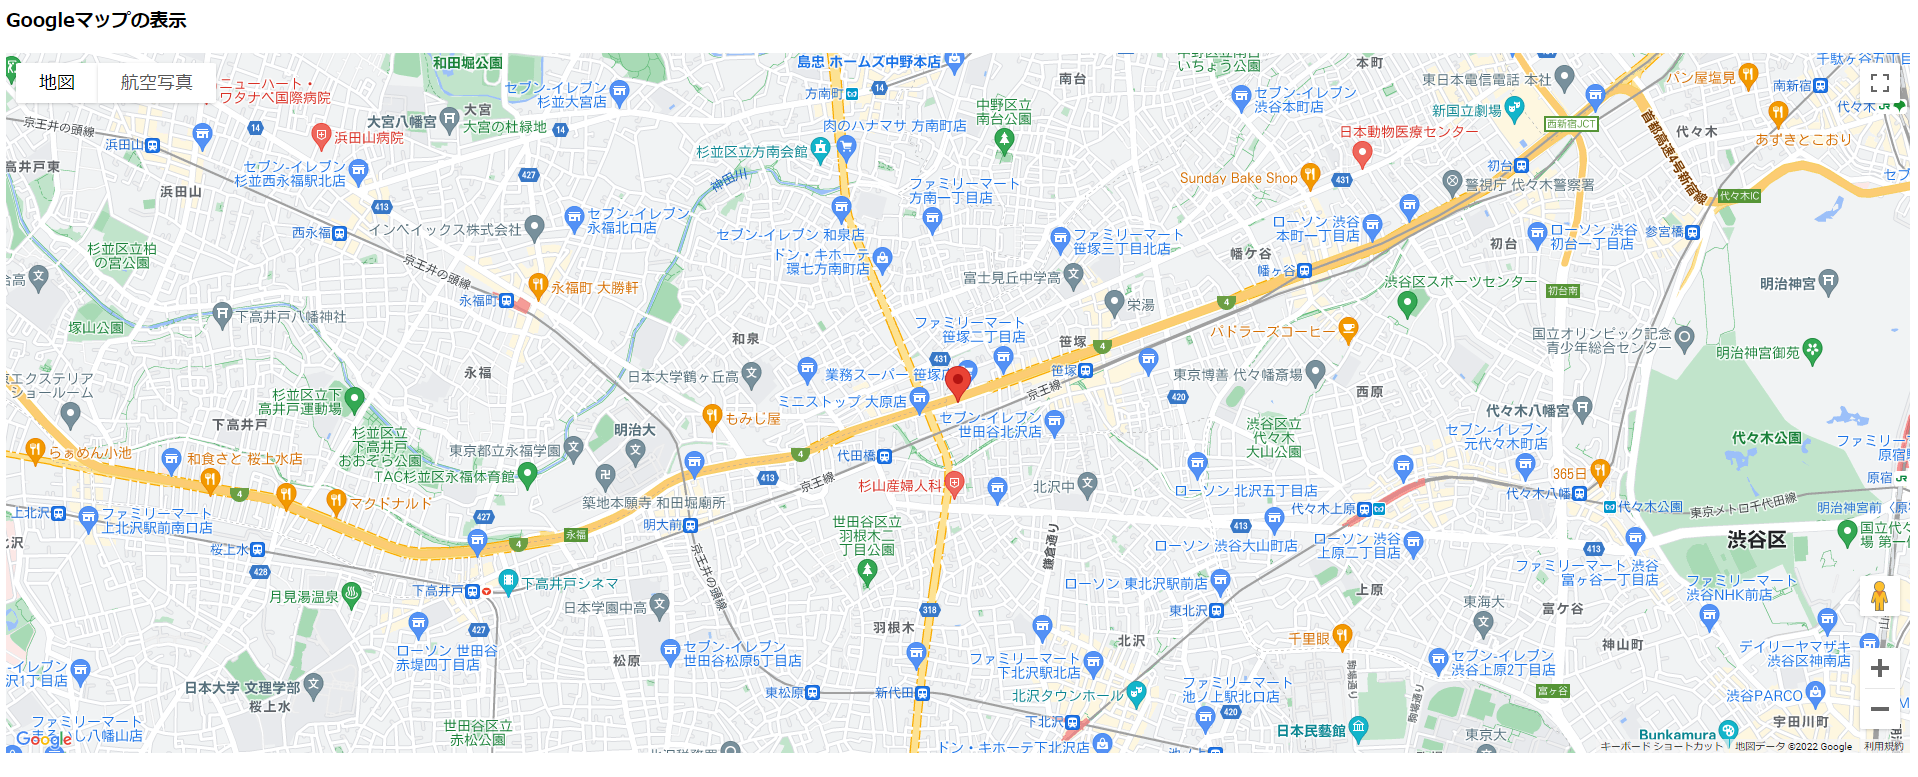
まずはMaps JavaScript API公式チュートリアルのサンプルを元に編集し、地図だけを表示してみました。
localhostのURLにアクセスし、地図表示されるイメージは以下になります。
サンプルコード
<!DOCTYPE html>
<html>
  <head>
    <title>Googleマップの表示</title>

    <link rel="stylesheet" type="text/css" href="./style.css" />
    <script type="module" src="./index.js"></script>
  </head>
  <body>
    <h3>Googleマップの表示</h3>
    <!--The div element for the map -->
    <div id="map"></div>

    <!--
     The `defer` attribute causes the callback to execute after the full HTML
     document has been parsed. For non-blocking uses, avoiding race conditions,
     and consistent behavior across browsers, consider loading using Promises
     with https://www.npmjs.com/package/@googlemaps/js-api-loader.
    -->
    <script
      src="https://maps.googleapis.com/maps/api/js?key=YOUR_GOOGLE_MAP_KEY&callback=initMap&v=weekly"
      defer
    ></script>
  </body>
</html>
function initMap() {
  // 中心位置
  const centerLocation = { lat: 35.6727, lng: 139.662 };

  const map = new google.maps.Map(document.getElementById("map"), {
    zoom: 15,
    center: centerLocation,
  });

  const marker = new google.maps.Marker({
    position: centerLocation,
    map: map,
  });
}

window.initMap = initMap;
#map {
  height: 700px;
  width: 100%;
}
index.htmlにYOUR_GOOGLE_MAP_KEYを記載してる箇所はご自身のAPIキーに置き換えてください
Google Mapに町丁目ポリゴンを表示
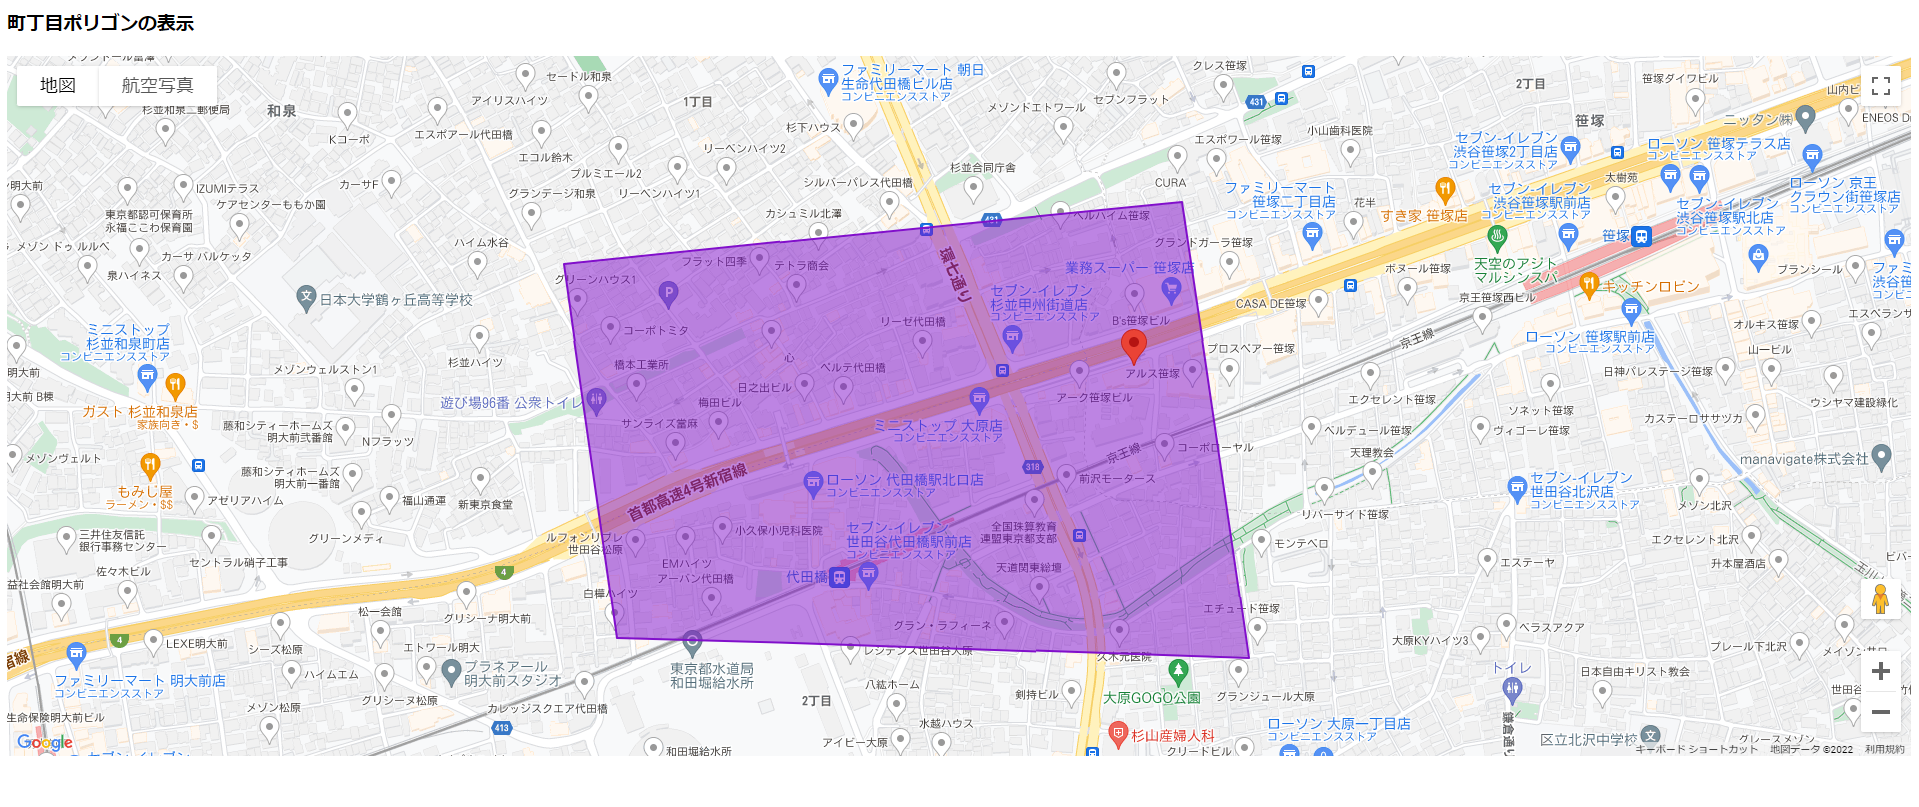
次に地図ロード時にポリゴンを表示させてみました。
GeoJSONによるポリゴン表示
ポリゴン表示されるイメージは以下のようになります。
ポリゴンの図形描画ではaddGeoJson()メソッドとData.setStyle()メソッドを使います。
以下のようにGeoJSONデータを用意すれば、直接地図にポリゴンを表示することができます。
function initMap() {
  // 中心位置
  const centerLocation = { lat: 35.6727, lng: 139.662 };

  const map = new google.maps.Map(document.getElementById("map"), {
    zoom: 14,
    center: centerLocation,
  });

  // GeoJSONでポリゴンを準備
  const geojsonObject = {
    type: "FeatureCollection",
    features: [
      {
        type: "Feature",
        properties: {},
        geometry: {
          type: "MultiPolygon",
          coordinates: [
            [
              [
                [139.65645236269657, 35.6703299404073],
                [139.65588373440954, 35.67358963979696],
                [139.66251415481307, 35.67413000490703],
                [139.6632329867986, 35.67015562118215],
                [139.65645236269657, 35.6703299404073],
              ],
            ],
          ],
        },
      },
    ],
  };
  map.data.addGeoJson(geojsonObject);

  // ポリゴンのスタイル設定
  const polygonStyleOptions = {
    strokeColor: "#810FCB",
    strokeOpacity: 1.0,
    strokeWeight: 2.0,
    fillColor: "#810FCB",
    fillOpacity: 0.5,
  };

  map.data.setStyle((feature) => {
    if (feature.getGeometry().getType() === "MultiPolygon") {
      return polygonStyleOptions;
    }
    return null;
  });

  const marker = new google.maps.Marker({
    position: centerLocation,
    map,
  });
}

window.initMap = initMap;
TerraMap APIを利用してポリゴン表示
ポリゴン表示されるイメージは以下のようになります。
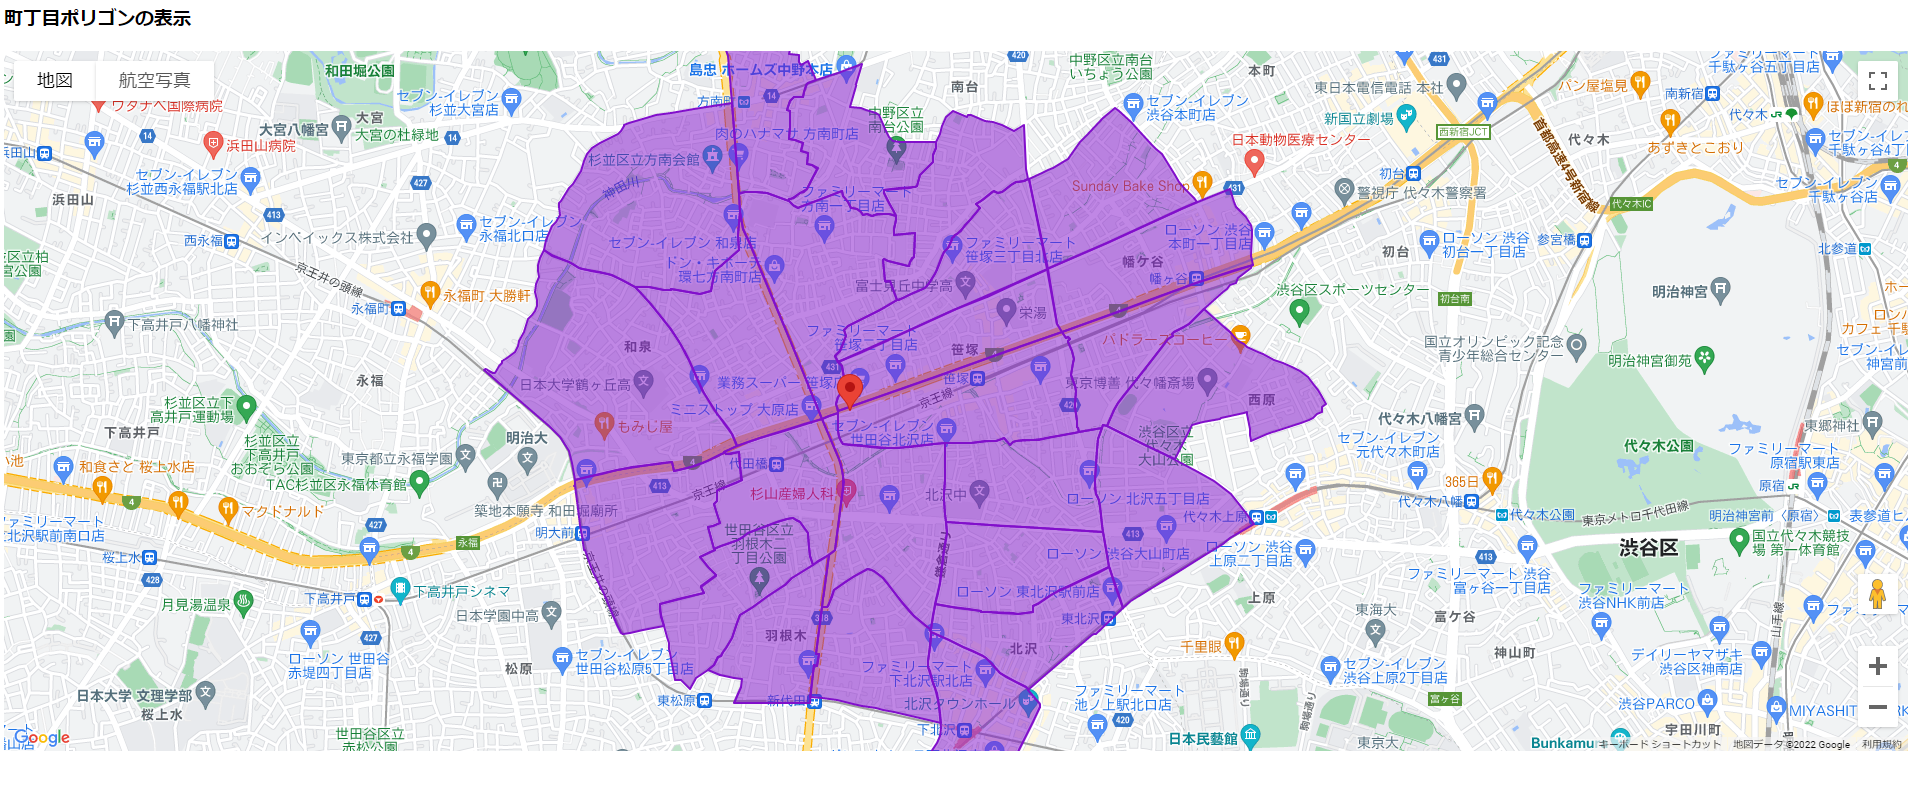
ポリゴンの図形描画ではloadGeoJson()メソッドとData.setStyle()メソッドを使います。
TerraMap APIのポリゴンはGeoJSONでレスポンスされるので、TerraMap APIにリクエストを送るサーバーサイドプログラムのURLをそのままメソッドにセットすることができます。
コード例ではTerraMap APIへのリクエストについて詳細は記載していませんが、マーカー地点から半径1kmに含まれる町丁目のポリゴンを取得しています。
function initMap() {
  // 中心位置
  const centerLocation = { lat: 35.6727, lng: 139.662 };

  const map = new google.maps.Map(document.getElementById("map"), {
    zoom: 14,
    center: centerLocation,
  });

  // loadGeoJsonにTerraMap APIにリクエストを送るサーバーサイドプログラムのURLを指定します
  // URLはダミーです
  map.data.loadGeoJson(
    "https://your_domain.example.jp/path/to/terramap_api_request_program"
  );

  // ポリゴンのスタイル設定
  const polygonStyleOptions = {
    strokeColor: "#810FCB",
    strokeOpacity: 1.0,
    strokeWeight: 2.0,
    fillColor: "#810FCB",
    fillOpacity: 0.5,
  };

  map.data.setStyle((feature) => {
    if (feature.getGeometry().getType() === "MultiPolygon") {
      return polygonStyleOptions;
    }
    return null;
  });

  const marker = new google.maps.Marker({
    position: centerLocation,
    map,
  });
}

window.initMap = initMap;
上記TerraMap API経由で取得したGeoJSONレスポンスは以下になります。
GeoJSONレスポンスの抜粋
{
  "type": "FeatureCollection",
  "features": [
    {
      "type": "Feature",
      "properties": {
        "area": {
          "area": 0.2007340142607987
        },
        "geocode": "13112001606"
      },
      "geometry": {
        "type": "MultiPolygon",
        "coordinates": [
          [
            [
              [139.665413202536, 35.6651199470495],
              [139.665407957177, 35.6650825751151],
              [139.665470556221, 35.6650056603209],
              [139.665451449088, 35.6648053926962],
              [139.665405472513, 35.6645540024516],
              [139.665397364773, 35.6644324490172],
              [139.66536154612, 35.6642302208182],
              [139.665318388011, 35.6640041163447],
              [139.665345404201, 35.6637827930964],
              [139.665406358573, 35.6636253460313],
              [139.665509486479, 35.6633299401357],
              [139.665534396319, 35.663239416048],
              [139.66563853021, 35.6630429551629],
              [139.665693567078, 35.6628690553599],
              [139.665751433301, 35.6626449554005],
              [139.665798351486, 35.6624275321163],
              [139.665834398261, 35.6621703011839],
              [139.665880449166, 35.661822916957],
              [139.665878518166, 35.6618232922501],
              [139.66463942524, 35.6620645182137],
              [139.663880351047, 35.6621976411037],
              [139.663398581018, 35.6622993467022],
              [139.66308834155, 35.6623349628471],
              [139.662524152312, 35.6624331171959],
              [139.662510989829, 35.6624354064495],
              [139.662249533541, 35.662480916319],
              [139.662095733777, 35.6624998504691],
              [139.661798852388, 35.6625468607858],
              [139.661421427052, 35.6626359242693],
              [139.66140683407, 35.6626377338789],
              [139.660759550497, 35.662718078067],
              [139.660575530457, 35.6627412653376],
              [139.660276490158, 35.6627441475831],
              [139.660445321881, 35.6638525411345],
              [139.660564714501, 35.6638232465199],
              [139.66063298265, 35.6642210387391],
              [139.660508652424, 35.6642389227506],
              [139.660778357889, 35.6658727640081],
              [139.660994749219, 35.6658720481091],
              [139.661045879353, 35.6659139170565],
              [139.661200747995, 35.666239228201],
              [139.661302707608, 35.6664623274162],
              [139.66178398481, 35.6667494034591],
              [139.662111787526, 35.6669317668531],
              [139.662324092816, 35.6670218883919],
              [139.662657656015, 35.6671756297824],
              [139.662691771062, 35.6671880378829],
              [139.662756243703, 35.6672051635922],
              [139.662904275602, 35.6671790725902],
              [139.663029599439, 35.6671281582155],
              [139.663194845677, 35.6670323786724],
              [139.663384862508, 35.6668933225368],
              [139.663592102288, 35.6666768999907],
              [139.663689080311, 35.6665748546305],
              [139.663860197534, 35.6663908484381],
              [139.664179571248, 35.6660755005103],
              [139.664295555419, 35.6659517899419],
              [139.664453871556, 35.6658153979992],
              [139.664568904161, 35.6657122896624],
              [139.664732984435, 35.6655651713708],
              [139.665221860737, 35.6652162512982],
              [139.665413202536, 35.6651199470495]
            ]
          ]
        ]
      }
    },
    {
      "type": "Feature",
      "properties": {
        "area": {
          "area": 0.1506017957278304
        },
        "geocode": "13112002001"
      },
      "geometry": {
        "type": "MultiPolygon",
        "coordinates": [
          [
            [
              [139.661070757331, 35.6677023604939],
              [139.661029034509, 35.6674516124339],
              [139.660778357889, 35.6658727640081],
              [139.660508652424, 35.6642389227506],
              [139.66063298265, 35.6642210387391],
              [139.660564714501, 35.6638232465199],
              [139.660445321881, 35.6638525411345],
              [139.660276490158, 35.6627441475831],
              [139.660247977835, 35.6625510152295],
              [139.660243895716, 35.6625232270921],
              [139.657423901949, 35.6625195277901],
              [139.657415969462, 35.6625195192372],
              [139.657010586717, 35.662522969915],
              [139.657018101569, 35.6625410825807],
              [139.65714774928, 35.662792917296],
              [139.657247191559, 35.6629738694611],
              [139.657285916429, 35.6630792297539],
              [139.65730987528, 35.6632501748798],
              [139.65733885743, 35.6633614820429],
              [139.657318688389, 35.6633616608303],
              [139.656980843168, 35.6634046578738],
              [139.656417738533, 35.6634788274511],
              [139.656400759479, 35.66349555902],
              [139.656367239757, 35.663514066773],
              [139.655887890545, 35.6636768449155],
              [139.656132403618, 35.663840856252],
              [139.656336183053, 35.6641161102979],
              [139.656435258116, 35.6641719517557],
              [139.656522607615, 35.6642908799836],
              [139.656675309079, 35.6644530330182],
              [139.656915069977, 35.6648058676967],
              [139.656974421729, 35.6649399716249],
              [139.65712968553, 35.6653140860843],
              [139.657209603811, 35.6655385986179],
              [139.657247975411, 35.6656049147414],
              [139.657453024959, 35.6656760607395],
              [139.657472814123, 35.6656867919747],
              [139.657701209645, 35.6657909898172],
              [139.657823463977, 35.6658754249166],
              [139.658044776659, 35.6660156765361],
              [139.658444737717, 35.6662658591227],
              [139.659111672701, 35.6666077584828],
              [139.659172462176, 35.6666455991159],
              [139.659466599662, 35.6668437181143],
              [139.659498170075, 35.666874330386],
              [139.659730205263, 35.6670031088286],
              [139.659758481405, 35.6670181150078],
              [139.660287165991, 35.6672987238544],
              [139.660385631953, 35.667352801053],
              [139.660572675887, 35.6674457453853],
              [139.660611345005, 35.6674649598578],
              [139.660646352382, 35.6674829647922],
              [139.660996029935, 35.667662684643],
              [139.661070757331, 35.6677023604939]
            ]
          ]
        ]
      }
    },
    "//": "長いため以下は省略します"
  ]
}
コード参考情報
Google マップのデータレイヤ
おわりに
今回は、Maps JavaScript APIを用いてブラウザにマップと町丁目ポリゴンを表示させる方法を紹介しました。
Maps JavaScript APIのドキュメントが充実していたので、GeoJSONさえあれば、地図にポリゴンを描くことは容易でした。
今回はTerraMap APIから取得した町丁目ポリゴンのみを表示させてみましたが、統計データや住所も取得すると、地図を使った統計データの見える化やエリアマーケティングに特化した分析が実現できます。
以上になります。最後まで読んでいただき有難うございました。