前々からやってみたかったのですが、ふと思ってつくってみました。手法はntp系の監視と同じ流れになります。なぜこの方法かというとターゲットのストレージ(flash,md)が限られていて、RRDtoolとかを動かすのが難しいためにそうしています。
REALTEK社製EthernetSwtichチップのRTL8366SRのMIBを表示してみます。
MIBを拾うmrubyスクリトは以下になります。merbgemsのmruby-etherswichを使っています。
# !/usr/local/bin/mruby

# RTL8366SR MIB
#
#        0               IfInOctets
#        1               EtherStatsOctets
#        2               EtherStatsUnderSizePkts
#        3               EtherFregament
#        4               EtherStatsPkts64Octets
#        5               EtherStatsPkts65to127Octets
#        6               EtherStatsPkts128to255Octets
#        7               EtherStatsPkts256to511Octets
#        8               EtherStatsPkts512to1023Octets
#        9               EtherStatsPkts1024to1518Octets
#        10              EtherOversizeStats
#        11              EtherStatsJabbers
#        12              IfInUcastPkts
#        13              EtherStatsMulticastPkts
#        14              EtherStatsBroadcastPkts
#        15              EtherStatsDropEvents
#        16              Dot3StatsFCSErrors
#        17              Dot3StatsSymbolErrors
#        18              Dot3InPauseFrames
#        19              Dot3ControlInUnknownOpcodes
#        20              IfOutOctets
#        21              Dot3StatsSingleCollisionFrames
#        22              Dot3StatMultipleCollisionFrames
#        23              Dot3sDeferredTransmissions
#        24              Dot3StatsLateCollisions
#        25              EtherStatsCollisions
#        26              Dot3StatsExcessiveCollisions
#        27              Dot3OutPauseFrames
#        28              Dot1dBasePortDelayExceededDiscards
#        29              Dot1dTpPortInDiscards
#        30              IfOutUcastPkts
#        31              IfOutMulticastPkts
#        32              IfOutBroadcastPkts
#        33              Dot1dTpLearnEntryDiscardFlag
#
# IfInOctets and EtherStatsOctets is 64bit wide other is 32bit.

mib = ARGV[0].to_i

t = EtherSwitch.new(0)

portoff = 0

srid = t.readreg(0x0105)
rbid = t.readreg(0x0509)

if srid == 0x8366 then
# RTL8366SR
  portoff = 0x0040
  ctrlreg = 0x11F0
elsif rbid == 0x5937 then
# RTL8366RB
  portoff = 0x0050
  ctrlreg = 0x13F0
else
  p "switch not found"
end


if portoff != 0 then

  port = 0

  while port < 6 do

    if mib <= 1 then
      off = 0x1000 + port * portoff + 4 * mib
    else
      off = 0x1000 + port * portoff + 8 + (mib - 2) * 2
    end

    t.writereg(off, 0)

    st = t.readreg(ctrlreg)

    if st & 3 == 0 then
      val = 0
      if mib <= 1 then
        c = 0
        while c < 4 do
          if c < 3 then   # only 48 bit
            val = (t.readreg(off + c) << (16 * c)) | val
          else
            dmy = t.readreg(off + c)
          end
          c = c + 1
        end
      else
        c = 0
        while c < 2 do
           val = (t.readreg(off + c) << (16 * c)) | val
           c = c + 1
        end
      end
    else
      val = 0
    end

    if port != 0 then
      print ","
    end
    print val.to_s

    port = port + 1
  end
end
これをsnmpd.confに入れます。
# Extension commands (extTable)

inmib := 0
extNames.0 = "portsin"
extCommand.0 = "/tmp/rtl8366.rb $(inmib)"
IfInOctets(0)を拾っています。Ifが付いているMIBはRFC 1213由来のようです。
複数に分けるとときどきデータが壊れるので全ポート一発で拾えるようにしています。何かのバグがあるような気がします。
これで拾えるようになったので、cronで定期的に下記のshスクリプトを実行して、csvを作ります。
# !/bin/sh

DAY=`date "+%Y/%m/%d"`
TIME=`date "+%H:%M:%S"`

VAL=`bsnmpwalk -s 10.0.1.3 .1.3.6.1.4.1.2021.8.1.101 | awk '{print $3}'`

if [ -n "${VAL}" -a "${VAL}" != "No" ]; then
echo ${DAY},${TIME},${VAL} >> /tmp/sw.log
fi
mrubyスクリプトでcvsをjsonにします。
# !/usr/local/bin/mruby

f = File.open("/tmp/" + ARGV[0], "r")

j = File.open("/tmp/htdocs/json/" + ARGV[1], "w")

j.printf("{\"date\":\"" + ARGV[2] + "\",")
j.printf("\"type\":\"" + ARGV[0] + "\",")

j.printf("\"data\":[")

c = 0

f.each_line do |line|

  line.chomp!

  arr = line.split(",")

  if ARGV[2] == arr[0] then
    if c != 0 then
      j.printf(",")
    end
    j.printf("[\"" + arr[1] + "\"")
    i = 2
    while i < arr.length do
      j.printf("," + arr[i])
      i = i + 1
    end
    j.printf("]")
    c = c + 1
  end
end

j.printf("]}")
変換の処理は以下になります。
% ./csv2json.rb sw.log test.json 2019/12/13
これで出力された、jsonをChart.jsで書きます。
<!DOCTYPE html>
<html>
<head>
<meta charset="UTF-8">
</head>
<body>
<script src="js/Chart.min.js"></script>
<script src="js/jquery.min.js"></script>
<canvas id="myChart" width="200" height="100"></canvas>
<a id='link' download='filename.png'>Save as Image</a>
<script>
var ctx = document.getElementById("myChart");
//ctx.style.backgroundColor = 'rgba(250,250,100,255)';
window.chartColors = {
	red: 'rgb(255, 99, 132)',
	orange: 'rgb(255, 159, 64)',
	yellow: 'rgb(255, 205, 86)',
	green: 'rgb(75, 192, 192)',
	blue: 'rgb(54, 162, 235)',
	purple: 'rgb(153, 102, 255)',
	grey: 'rgb(201, 203, 207)'
};
var clab = [];
var p1dat = [];
var portdat = [];
$(function() {
  if(!window.CanvasRenderingContext2D){
    return;
  }
  var arg = new Object;
  var pair=location.search.substring(1).split('&');
  for(var i=0;pair[i];i++) {
    var kv = pair[i].split('=');
    arg[kv[0]]=kv[1];
  }
  Chart.pluginService.register({
    beforeDraw: function (chart, easing) {
      if (chart.config.options.chartArea && chart.config.options.chartArea.backgroundColor) {
        var helpers = Chart.helpers;
        var ctx = chart.chart.ctx;
        var chartArea = chart.chartArea;

        ctx.save();
        ctx.fillStyle = chart.config.options.chartArea.backgroundColor;
        ctx.fillRect(chartArea.left, chartArea.top, chartArea.right - chartArea.left, chartArea.bottom - chartArea.top);
        ctx.restore();
      }
    }
  });
  var now = new Date();
  var srcfile = "json/" + arg.src + ".json" + "?id=" + now.getTime();
  $.getJSON(srcfile, function(data) {
    var len = data.data.length;
    var ports = data.data[0].length - 1;
//    alert(len);

    for(var j = 0; j < ports; j++) {
      portdat.push(new Array);
    }

    var oct = 0;

    for(var i = 1; i < len; i++) {
      clab.push(data.data[i][0].substr(0,5));
      for(var j = 0; j < ports; j++) {
        portdat[j].push(data.data[i][j+1] - data.data[i-1][j+1]);
      }
    }

    var config =  {
        type: 'line',
        data: {
            labels: clab,
            borderColor : "#fff00",
            datasets: []
        },
        options: {
chartArea: {
        backgroundColor: 'rgba(255, 255, 255, 0)'
    },
          bezierCurve : false,
          animation: {
            onComplete: done
          },
          title: {
              display: true,
              fontSize: 24,
              text: data.date +' - ' + decodeURIComponent(arg.title)
          },
          legend: {
            labels: {
              generateLabels: function(chart) {
                labels = Chart.defaults.global.legend.labels.generateLabels(chart);
                return labels;
              }
            }
          },
          scales: {
              xAxes: [{
                ticks: {
                  callback: function(value) {return value.match(/((^0[0369])|(^1[258])|(^21)):0/) ? value : ''},
                  stepSize: 1
                }
              }],
              yAxes: [{
//                  type: 'logarithmic',
                  ticks: {
                    callback: function(value) {return value + " oct"},
                    min: 0
                  }
              }]
          }
        }
    };
    var myChart = new Chart(ctx, config);
    var ary = [];
    for(var i in window.chartColors){
      ary.push(window.chartColors[i]);
    }
    for(var j = 0; j < ports; j++) {
      config.data.datasets.push(adddataset(j, portdat[j], ary[j]));
    }
    myChart.update();
  })
  .fail(function(jqXHR, textStatus, errorThrown) {
    console.log("getJSON status: " + textStatus);
    console.log("getJSON text: " + jqXHR.responseText);
  });
});
function adddataset(port, data, color){
    var newDataset = {
      label: 'Port' + String(port),
      data: data,
      fill: false,
      lineTension: 0.1,
      backgroundColor: color,
      borderColor: color,
      borderCapStyle: 'butt',
      borderDash: [],
      borderDashOffset: 0.0,
      borderJoinStyle: 'miter',
      pointBorderColor: color,
      pointBackgroundColor: "#fff",
      pointBorderWidth: 1,
      pointHoverRadius: 5,
      pointHoverBackgroundColor: color,
      pointHoverBorderColor: "rgba(220,220,220,1)",
      pointHoverBorderWidth: 2,
      pointRadius: 1,
      pointHitRadius: 10,
      spanGaps: false,
    };
    return newDataset;
}
function done(){
  var url_base64 = document.getElementById('myChart').toDataURL('image/png');
  link.href = url_base64;
}
</script>
</body>
</html>
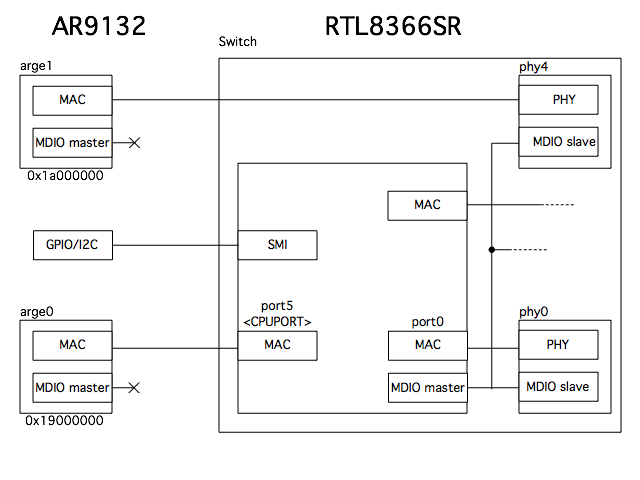
ターゲットは以下のような構成になっています。
MIBはMACベースで集計されているようで、Phy切り出しで使われているarge1(WAN)のMIBは拾えません。このためPort4はずっと0のままです。
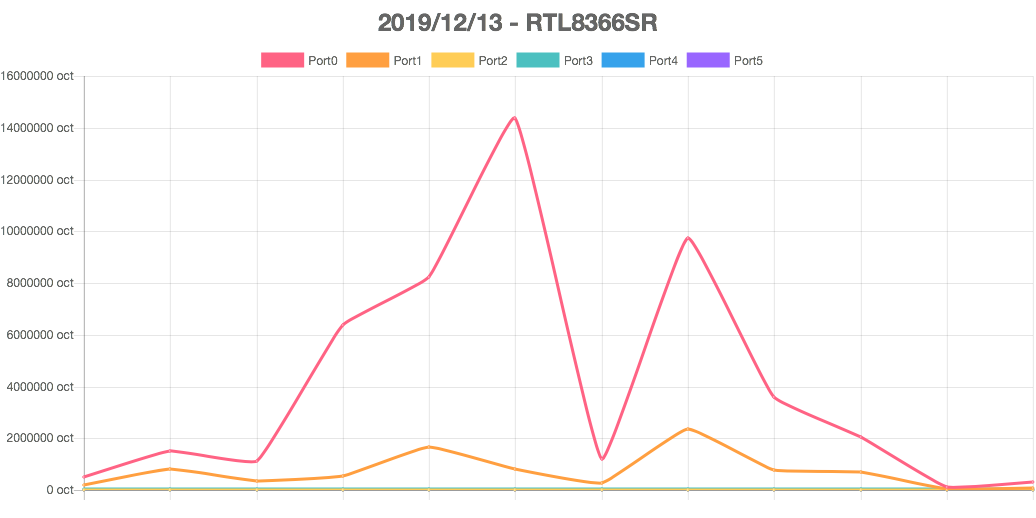
グラフはこんな風になります。
http://10.0.1.3/snmpgraph.html?src=test&title=RTL8366SR
当初おうちのネットワークトポロジーを勘違いしていてグラフの意味が理解できませんでした。^ ^;


