こんにちは!
今回はグラフに動きをつけるfl_chartパッケージについて紹介します。
最後まで読んでいただけると嬉しいです!
使用パッケージ
fl_chart パッケージは、カスタマイズ性が高く、様々なチャートタイプをサポートしているため、どのようなデータビジュアライゼーションニーズにも対応できます。バージョン ^0.68.0 ではさらに多くの機能が追加され、ユーザー体験が向上しています。
特徴(多様なチャートタイプ)
| チャートタイプ | 説明 |
|---|---|
| ラインチャート (Line Chart) | 折れ線グラフを描画し、データの変化を視覚的に表示します。 複数の線を重ねることができ、異なるデータセットの比較が可能です。 グラデーションや点の形状、線の太さなどをカスタマイズ可能。 |
| バーチャート (Bar Chart) | 棒グラフを描画し、カテゴリデータの比較に適しています。 横棒グラフ、縦棒グラフ、積み上げ棒グラフに対応。 各バーの色や間隔、アニメーション効果をカスタマイズ可能。 |
| パイチャート (Pie Chart) | 円グラフを描画し、全体に対する部分の割合を表示します。 セグメントの色、半径、間隔を調整可能。 セグメントを選択した際のインタラクティブなアニメーションをサポート。 |
| スキャッターチャート (Scatter Chart) | 散布図を描画し、データポイントの分布を表示します。 点のサイズ、色、形状をカスタマイズ可能。 直線や曲線の回帰ラインを追加して、データの傾向を視覚化できます。 |
| レーダーチャート (Radar Chart) | レーダーチャートを描画し、多次元データの比較に適しています。 各軸のラベルや範囲を調整可能。 データセットごとの異なる色やスタイルを設定可能。 |
実際に実装してみて
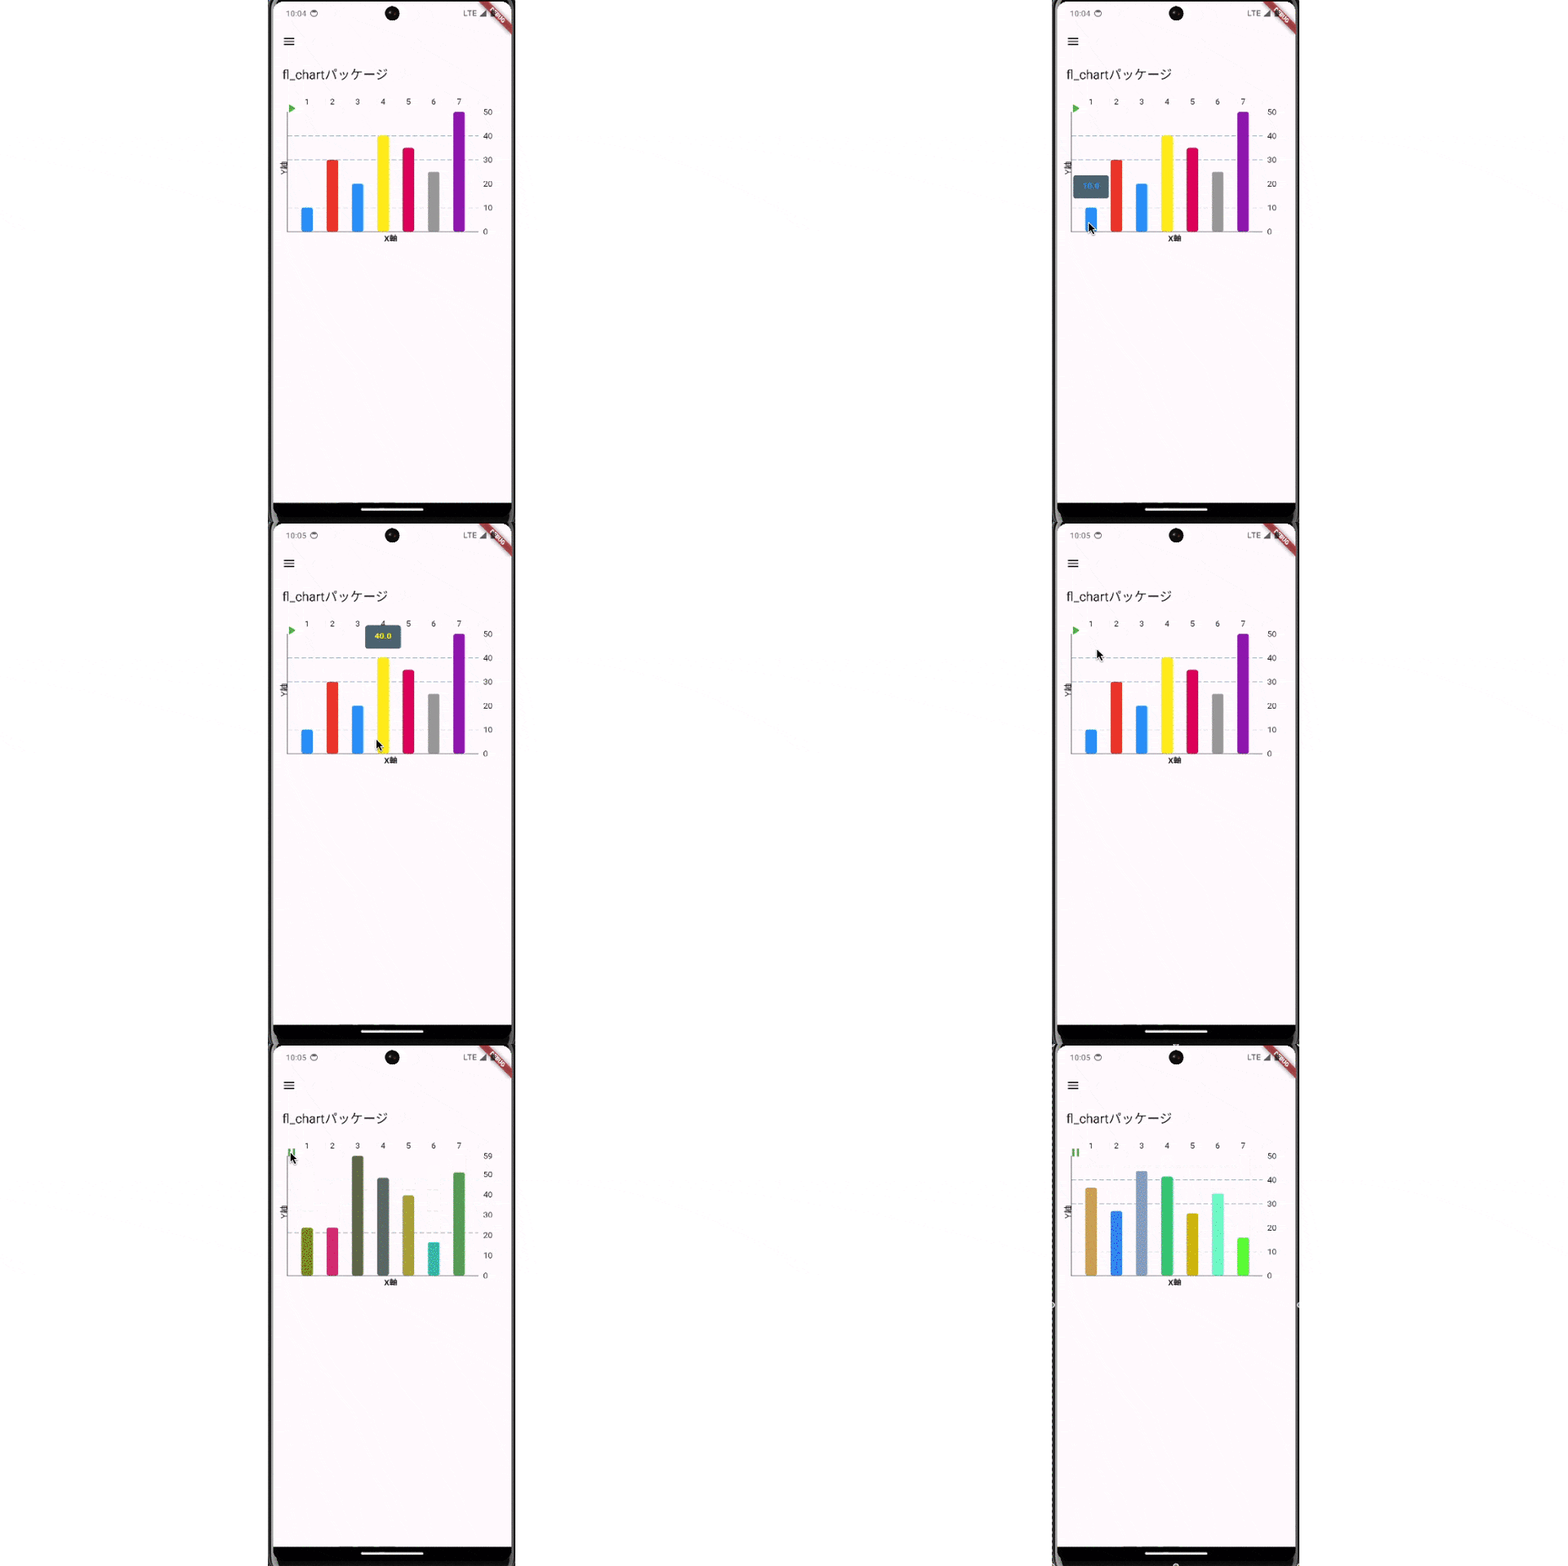
今回はバーチャートで試してみました。
実際のコード
 SingleChildScrollView(
        child: Column(
          children: [
            Padding(
              padding: const EdgeInsets.all(8.0),
              child: SizedBox(
                width: MediaQuery.of(context).size.width * 0.95,
                height: MediaQuery.of(context).size.width * 0.95 * 0.65,
                child: Stack(
                  children: [
                    BarChart(
                      isPlaying ? randomData() : mainBarData(),
                      swapAnimationDuration: animDuration,
                    ),
                    Align(
                      alignment: Alignment.topLeft,
                      child: IconButton(
                        icon: Icon(
                          isPlaying ? Icons.pause : Icons.play_arrow,
                          color: Colors.green,
                        ),
                        onPressed: () {
                          setState(() {
                            isPlaying = !isPlaying;
                            if (isPlaying) {
                              refreshState();
                            }
                          });
                        },
                      ),
                    ),
                  ],
                ),
              ),
            ),
          ],
        ),
      ),
    );
  }

  BarChartGroupData makeGroupData(
    int x,
    double y, {
    bool isTouched = false,
    Color barColor = Colors.blue,
    double width = 20,
    List<int> showTooltips = const [],
  }) {
    return BarChartGroupData(
      x: x,
      barRods: [
        BarChartRodData(
          toY: isTouched ? y + 1 : y,
          color: isTouched ? Colors.yellow : barColor,
          width: width,
          borderRadius: BorderRadius.circular(4),
        ),
      ],
      showingTooltipIndicators: showTooltips,
    );
  }

// メインのバーグラフデータを作成するメソッド
  BarChartData mainBarData() {
    return BarChartData(
      barTouchData: BarTouchData(
        touchCallback: (FlTouchEvent event, barTouchResponse) {
          setState(() {
            if (!event.isInterestedForInteractions ||
                barTouchResponse == null ||
                barTouchResponse.spot == null) {
              touchedIndex = -1;
              return;
            }
            touchedIndex = barTouchResponse.spot!.touchedBarGroupIndex;
          });
        },
      ),
      borderData: FlBorderData(
        border: const Border(
          top: BorderSide.none,
          right: BorderSide.none,
          left: BorderSide(width: 1),
          bottom: BorderSide(width: 1),
        ),
      ),
      titlesData: const FlTitlesData(
        bottomTitles: AxisTitles(
          axisNameWidget: Text(
            "X軸",
            style: TextStyle(
              fontWeight: FontWeight.bold,
            ),
          ),
        ),
        leftTitles: AxisTitles(
          axisNameWidget: Text(
            "Y軸",
            style: TextStyle(),
          ),
        ),
      ),
      gridData: const FlGridData(
        show: true,
        drawVerticalLine: true,
        drawHorizontalLine: true,
        verticalInterval: 1,
        horizontalInterval: 10,
      ),
      groupsSpace: 12,
      barGroups: List.generate(7, (i) {
        switch (i) {
          case 0:
            return makeGroupData(1, 10);
          case 1:
            return makeGroupData(2, 30, barColor: Colors.red);
          case 2:
            return makeGroupData(3, 20, barColor: Colors.blue);
          case 3:
            return makeGroupData(4, 40, barColor: Colors.yellow);
          case 4:
            return makeGroupData(5, 35, barColor: Colors.pink);
          case 5:
            return makeGroupData(6, 25, barColor: Colors.grey);
          case 6:
            return makeGroupData(7, 50, barColor: Colors.purple);
          default:
            return throw Error();
        }
      }),
    );
  }

// ランダムなバーグラフデータを作成するメソッド
  BarChartData randomData() {
    return BarChartData(
      barTouchData: BarTouchData(
        enabled: false,
      ),
      titlesData: const FlTitlesData(
        bottomTitles: AxisTitles(
          axisNameWidget: Text(
            "X軸",
            style: TextStyle(
              fontWeight: FontWeight.bold,
            ),
          ),
        ),
        leftTitles: AxisTitles(
          axisNameWidget: Text(
            "Y軸",
            style: TextStyle(),
          ),
        ),
      ),
      borderData: FlBorderData(
        border: const Border(
          top: BorderSide.none,
          right: BorderSide.none,
          left: BorderSide(width: 1),
          bottom: BorderSide(width: 1),
        ),
      ),
      gridData: const FlGridData(
        show: true,
        drawVerticalLine: true,
        drawHorizontalLine: true,
        verticalInterval: 1,
        horizontalInterval: 10,
      ),
      groupsSpace: 12,
      barGroups: List.generate(7, (i) {
        return makeGroupData(
          i + 1,
          Random().nextInt(50).toDouble() + 10,
          barColor: Color.fromARGB(
            255,
            Random().nextInt(255),
            Random().nextInt(255),
            Random().nextInt(255),
          ),
        );
      }),
    );
  }

  Future<void> refreshState() async {
    setState(() {});
    await Future<void>.delayed(animDuration + const Duration(milliseconds: 50));
    if (isPlaying) {
      await refreshState();
    }
  }
}
終わり
今回の記事は以上になります。
今回も最後まで読んでいただき、ありがとうございました。
では、また次の記事で〜!
