背景
天体画像の radial profile を作ることで,望遠鏡や検出器の有限の広がりと比較し,点源のコンシステントな広がりなのか,それよりも広がっているのかなど,天体の画像解析の一般的な方法であり,汎用的な解析ツールに含まれることもあるが,細かい解析をする場合は,自分で書いてみたい時もあるだろう.
作り方
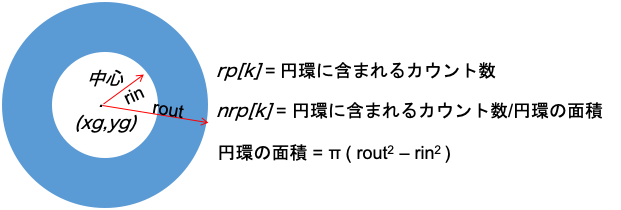
実直に,中心を決めて,そこから円環を用意して,円環の中に含まれるピクセルのカウント数を数えて円環の面積で割るだけである.
def calc_radialprofile(data, xg, yg, ds = 10, ndiv = 10, debug = False):
    """
    calc simple peak (just for check) and barycentric peak.
    """
    tmp = data.T
    nr  = np.linspace(0, ds, ndiv)
    rc = (nr[:-1] + nr[1:]) * 0.5
    rp = np.zeros(len(nr)-1)
    nrp = np.zeros(len(nr)-1)

    for i in range(ds*2):
        for j in range(ds*2):
            itx = int(xg - ds + i)
            ity = int(yg - ds + j)
            val = tmp[itx][ity]
            dist = dist2d(itx, ity, xg, yg)
            for k, (rin,rout) in enumerate(zip(nr[:-1], nr[1:])):
                if dist >=  rin and dist < rout:
                    rp[k] = rp[k] + val

    # normalize rp
    for m, (rin,rout) in enumerate(zip(nr[:-1], nr[1:])):
        darea = np.pi *  ( np.power(rout,2) - np.power(rin,2) )
        nrp[m] = rp[m] / darea
        if debug:
            print(m, rp[m], nrp[m], rin, rout, darea)

    return rc, nrp
一応,図式で説明すると,このように円環を考えて,そこに入るカウント数を数えて,円環の面積で割るだけである.
これだけであるが,厳密には,イメージ素子がCCDの場合は,GAPがあることや,場所によっては,円環ではなくて,一部が画素のない部分のこともあるので,円環かつ有効な感度がある面積で計算する必要がある.「すざく」衛星のXIS(CCD)検出器のパイルアップツール Recipe for Pileup Effect on the Suzaku XIS では,1/4 or 1/8 Window mode, timing mode, などに応じて,実効的な面積で割るようにしている.
python で radial profile を作るサンプルコード
コード概要
fits のイメージファイルを入力とする.イメージの中のある"点構造"の radial profile を作るためには,
- 中心座標(x,y)
- サイズ(ds)
- 円環の分割数(ndiv)
が最低限必要なパラメータとなる.イメージは光子のカウントの時もあれば,カウントレートの時もあり,ダイナミックレンジが違うので,表示の範囲や見栄えは -m -a VMAX -i VMIN を指定すると,VMIN から VMAX の範囲になるが,何も指定しなければ,適当にデータの最小最大付近を表示する.
[syamada] $ python qiita_mk_radialprofile.py -h
Usage: qiita_mk_radialprofile.py FileList

Options:
  --version             show program's version number and exit
  -h, --help            show this help message and exit
  -d, --debug           The flag to show detailed information
  -m, --manual          The flag to use vmax, vmin
  -x DETX, --detx=DETX  det x
  -y DETY, --dety=DETY  det y
  -a VMAX, --vmax=VMAX  VMAX
  -i VMIN, --vmin=VMIN  VMIN
  -s DS, --dataExtractSize=DS
                        data size to be extracted from image
  -n NDIV, --numberOfDivision=NDIV
                        number of division of annulus
使い方
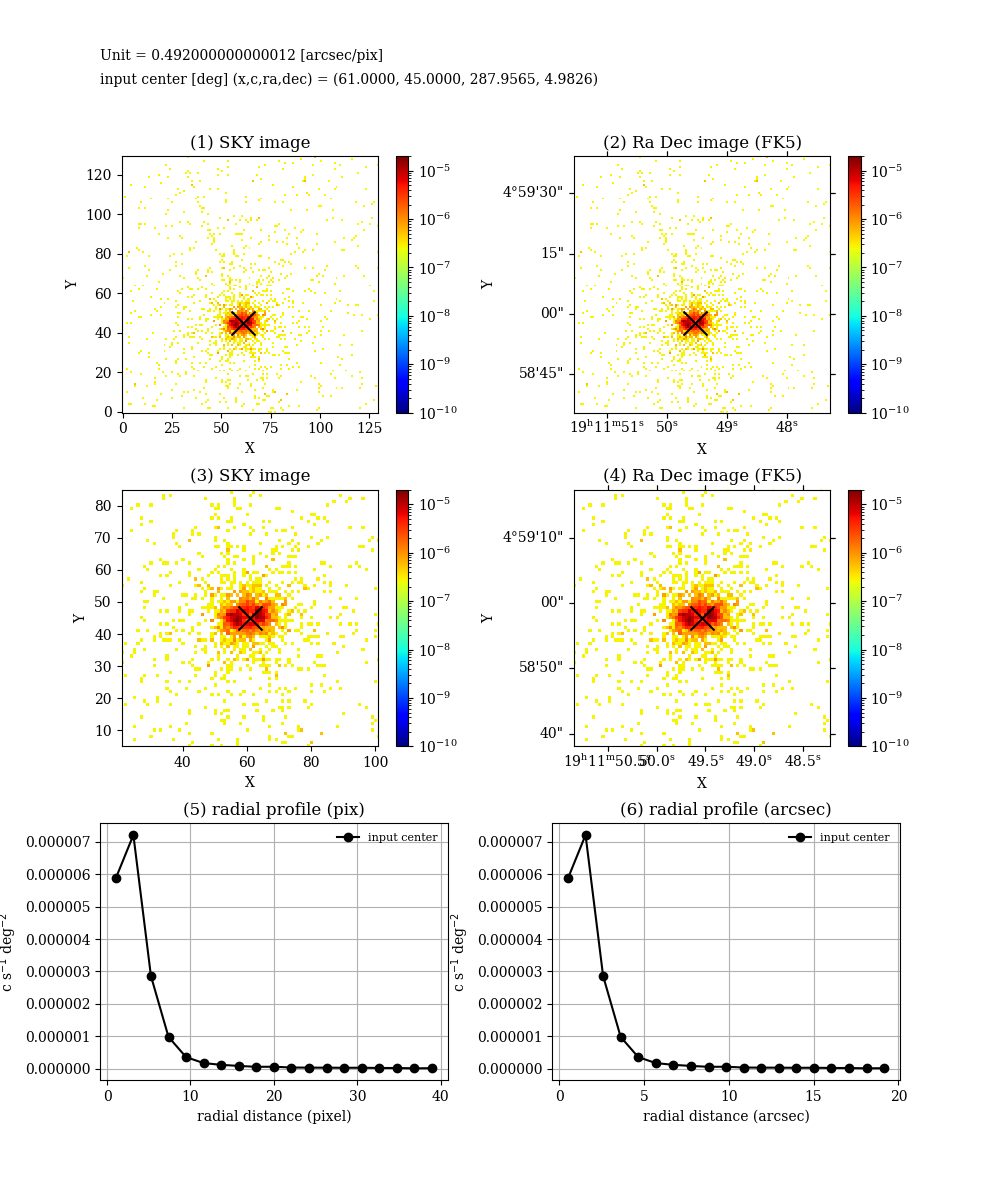
python qiita_mk_radialprofile.py ss433_659_broad_flux.img
とすると,次のような絵が作成される.同時に radial profile をテキストにダンプしたり,debug 用途のイメージの保存してくれる.
サンプルのダウンロード
- qiita_mk_radialprofile.py or qiita_mk_radialprofile.py
- Chandra の SS433 のイメージ or Chandra の SS433 のイメージ
X線衛星の例
XMM Newton の場合
XMM-Newton 衛星のデータ解析について易しい日本語で解説してみた に,xmm_process_radialprofile.py というソースコードで紹介している.
Chandra の場合
ciao というツール群を使っても作成可能.make a radial profile というスレッドに下記の方法が紹介されている.
$ download_chandra_obsid 17395
$ chandra_repro 17395 outdir=./
$ fluximage hrcf17395_repro_evt2.fits coma
$ dmextract "hrcf17395_repro_evt2.fits[bin sky=annulus(16635,15690,0:3200:100)]" coma_prof.rad \
  exp=coma_wide_thresh.expmap clob+ op=generic
Chandra衛星の全般的なことは,Chandra 衛星のデータ解析について易しい日本語で解説してみたを参照されたい.
コード
import os
import sys
import math
import subprocess
import re
import sys

# for I/O, optparse
import optparse

# numpy
import numpy as np
from numpy import linalg as LA

# conver time into date
import datetime

# matplotlib http://matplotlib.org
import matplotlib.cm as cm
import matplotlib.mlab as mlab
import matplotlib.pyplot as plt
from matplotlib.ticker import MultipleLocator, FormatStrFormatter, FixedLocator
import matplotlib.colors as cr
from matplotlib.font_manager import fontManager, FontProperties
import matplotlib.pylab as plab

## for FITS IMAGE
from matplotlib import pyplot as plt
from astropy.io import fits
from astropy.wcs import WCS
from astropy.utils.data import get_pkg_data_filename

params = {'xtick.labelsize': 10, # x ticks
          'ytick.labelsize': 10, # y ticks
          'legend.fontsize': 8
                    }
plt.rcParams['font.family'] = 'serif'
plt.rcParams.update(params)


# Fits I.O class
class Fits():
    # member variables
    debug = False

    def __init__ (self, eventfile, debug):

        self.eventfilename = eventfile
        self.debug = debug

        #extract header information
        if os.path.isfile(eventfile):
            self.filename = get_pkg_data_filename(eventfile)
            self.hdu = fits.open(self.filename)[0]

#            self.dateobs = self.hdu.header['DATE-OBS']
#            self.object = self.hdu.header['OBJECT']

            self.wcs = WCS(self.hdu.header)
            self.cdelt = self.wcs.wcs.cdelt
            self.p2deg = np.abs(self.cdelt[0]) # [deg/pixel]
            self.p2arcsec = 3600. * np.abs(self.cdelt[0]) # [arcsec/pixel]

            self.dirname = eventfile.replace(".fits","").replace(".gz","")

            print("..... __init__ ")
#            print "      self.dateobs    = ", self.dateobs
#            print "      self.object     = ", self.object
            print("      self.p2deg      = ", self.p2deg, " [deg/pixel]")
            print("      self.p2arcsec   = ", self.p2arcsec, " [arcsec/pix]")

            self.data = self.hdu.data
            self.data[np.isnan(self.data)] = 0 # nan ==> 0, note that radio data include negative values
            self.data = np.abs(self.data) # data is forced to be positive (Is it right?)

            if self.debug:
                print("... in __init__ Class Fits ()")
                print("filename = ", self.filename)
                print("hdu = ", self.hdu)
                print("data.shape = ",self.data.shape)
                self.wcs.printwcs()

        else:
            print("ERROR: cat't find the fits file : ", self.eventfilename)
            quit()


    def plotwcs(self, vmin = 1e-1, vmax = 20, manual = False):
        """
        just plot the entire image
        """
        print("\n..... plotwcs ...... ")
        if not manual:
            vmin = np.amin(self.hdu.data) + 1e-10
            vmax = np.amax(self.hdu.data)


#        plt.figtext(0.1,0.97, "OBJECT = " + self.object + " DATE = " + self.dateobs)
        plt.figtext(0.1,0.95, "Unit = " + str(self.p2arcsec) + " [arcsec/pix]" )

        plt.imshow(self.data, origin='lower', cmap=plt.cm.jet, norm=cr.LogNorm(vmin=vmin,vmax=vmax))
        plt.colorbar()
        plt.xlabel('RA')
        plt.ylabel('Dec')

        outputfiguredir = "fig_image_" + self.dirname
        subprocess.getoutput('mkdir -p ' + outputfiguredir)
        plt.savefig(outputfiguredir + "/" + "plotwcs.png")


    def plotwcs_ps(self, detx, dety, ds = 40, vmin = 1e-1, vmax = 20, manual = False):
        """
        just plot the enlarged image around (detx,dety)
        """

        print("\n..... plotwcs_ps ...... ")
        if not manual:
            vmin = np.amin(self.hdu.data) + 1e-10
            vmax = np.amax(self.hdu.data)

        self.detx = detx
        self.dety = dety

        gpixcrd = np.array([[ self.detx, self.dety]], np.float_)
        gwrdcrd = self.wcs.all_pix2world(gpixcrd,1)
        ra = gwrdcrd[0][0]
        dec = gwrdcrd[0][1]
        self.ra = ra
        self.dec = dec

        print("detx, dety = ", detx, dety)
        print("ra, dec    = ", ra,  dec)

        F = plt.figure(figsize=(12,8))

#        plt.figtext(0.1,0.97, "OBJECT = " + self.object + " DATE = " + self.dateobs)
        plt.figtext(0.1,0.95, "Unit = " + str(self.p2arcsec) + " [arcsec/pix]" )

        ax = plt.subplot(111, projection=self.wcs)

        plt.imshow(self.data, origin='lower', cmap=plt.cm.jet, norm=cr.LogNorm(vmin=vmin,vmax=vmax))

        print(" self.hdu.data[detx][dety] = ", self.hdu.data[detx][dety] , " (detx,dety) = (", detx, ",", dety, ")")

        ax.set_xlim(detx - ds, detx + ds)
        ax.set_ylim(dety - ds, dety + ds)
        plt.colorbar()
        plt.xlabel('RA')
        plt.ylabel('Dec')

        outputfiguredir = "fig_image_ps_" + self.dirname
        subprocess.getoutput('mkdir -p ' + outputfiguredir)
        plt.savefig(outputfiguredir + "/" + "plotwcs_ps_detx" + str("%d" % detx) + "_dety" + str("%d" % dety) + ".png")

    def mk_radialprofile(self, detx, dety, ds = 40, ndiv = 20, vmin = 1e-1, vmax = 20, manual = False):
        """
        create the radial profiles
        """

        print("\n..... mk_radialprofile ...... ")
        if not manual:
            vmin = np.amin(self.hdu.data) + 1e-10
            vmax = np.amax(self.hdu.data)


        self.detx = detx
        self.dety = dety

        gpixcrd = np.array([[ self.detx, self.dety]], np.float_)
        gwrdcrd = self.wcs.all_pix2world(gpixcrd,1)
        ra = gwrdcrd[0][0]
        dec = gwrdcrd[0][1]
        self.ra = ra
        self.dec = dec
        print("detx, dety = ", detx, dety)
        print("ra, dec    = ", ra,  dec)

        # radial profiles around the input (ra, dec)
        rc, rp = calc_radialprofile(self.data, detx, dety, ds = ds, ndiv = ndiv)

        # plot images and radial profiles
        F = plt.figure(figsize=(10,12))
        F.subplots_adjust(left=0.1, bottom = 0.1, right = 0.9, top = 0.87, wspace = 0.3, hspace=0.3)
#        plt.figtext(0.1,0.97, "OBJECT = " + self.object + " DATE = " + self.dateobs)
        plt.figtext(0.1,0.95, "Unit = " + str(self.p2arcsec) + " [arcsec/pix]" )
        plt.figtext(0.1,0.93, "input center [deg] (x,c,ra,dec) = (" + str("%3.4f" % detx) + ", " + str("%3.4f" % dety) + ", "+ str("%3.4f" % ra) + ", " + str("%3.4f" % dec) + ")")

        ax = plt.subplot(3,2,1)
        plt.title("(1) SKY image")
        plt.imshow(self.data, origin='lower', cmap=plt.cm.jet, norm=cr.LogNorm(vmin=vmin,vmax=vmax))
#        ax.set_xlim(detx - ds, detx + ds)
#        ax.set_ylim(dety - ds, dety + ds)
#        plt.imshow(self.hdu.data, origin='lower', cmap=plt.cm.viridis)
        plt.colorbar()
        plt.scatter(detx, dety, c="k", s=300, marker="x")
        plt.xlabel('X')
        plt.ylabel('Y')

        ax = plt.subplot(3,2,2, projection=self.wcs)
        plt.title("(2) Ra Dec image (FK5)")
        plt.imshow(self.data, origin='lower', cmap=plt.cm.jet, norm=cr.LogNorm(vmin=vmin,vmax=vmax))
        plt.colorbar()
        plt.scatter(detx, dety, c="k", s=300, marker="x")
        plt.xlabel('X')
        plt.ylabel('Y')

        ax = plt.subplot(3,2,3)
        plt.title("(3) SKY image")
        plt.imshow(self.data, origin='lower', cmap=plt.cm.jet, norm=cr.LogNorm(vmin=vmin,vmax=vmax))
        ax.set_xlim(detx - ds, detx + ds)
        ax.set_ylim(dety - ds, dety + ds)
        plt.colorbar()
        plt.scatter(detx, dety, c="k", s=300, marker="x")
        plt.xlabel('X')
        plt.ylabel('Y')


        ax = plt.subplot(3,2,4, projection=self.wcs)
        plt.title("(4) Ra Dec image (FK5)")
        plt.imshow(self.data, origin='lower', cmap=plt.cm.jet, norm=cr.LogNorm(vmin=vmin,vmax=vmax))
        ax.set_xlim(detx - ds, detx + ds)
        ax.set_ylim(dety - ds, dety + ds)
        plt.colorbar()
        plt.scatter(detx, dety, c="k", s=300, marker="x")
        plt.xlabel('X')
        plt.ylabel('Y')

        ax = plt.subplot(3,2,5)
        plt.title("(5) radial profile (pix)")
        plt.errorbar(rc, rp, fmt="ko-", label="input center")
        plt.xlabel('radial distance (pixel)')
        plt.ylabel(r'c s$^{-1}$ deg$^{-2}$')
        plt.grid(True)
        plt.legend(numpoints=1, frameon=False)

        ax = plt.subplot(3,2,6)
        plt.title("(6) radial profile (arcsec)")
        plt.errorbar(rc * self.p2arcsec, rp, fmt="ko-", label="input center")
        plt.xlabel('radial distance (arcsec)')
        plt.ylabel(r'c s$^{-1}$ deg$^{-2}$')
        plt.legend(numpoints=1, frameon=False)
        plt.grid(True)

        outputfiguredir = "fig_image_xy_" + self.dirname
        subprocess.getoutput('mkdir -p ' + outputfiguredir)
        plt.savefig(outputfiguredir + "/" + "mkrad_detx" + str("%d" % detx) + "_dety" + str("%d" % dety) + ".png")


        # dump the radial profiles into the text file
        outputfiguredir = "txt_image_xy_" + self.dirname
        subprocess.getoutput('mkdir -p ' + outputfiguredir)

        fout = open(outputfiguredir + "/" + "mkrad_detx" + str("%d" % detx) + "_dety" + str("%d" % dety) + ".txt", "w")
        for onex, oney1 in zip(rc * self.p2arcsec, rp):
            outstr=str(onex) + " " + str(oney1) + " \n"
            fout.write(outstr)
        fout.close()


def calc_radialprofile(data, xg, yg, ds = 10, ndiv = 10, debug = False):
    """
    calc simple peak (just for consistendety check) and baricentric peak.
    """
    tmp = data.T
    nr  = np.linspace(0, ds, ndiv)
    rc = (nr[:-1] + nr[1:]) * 0.5
    rp = np.zeros(len(nr)-1)
    nrp = np.zeros(len(nr)-1)

    for i in range(ds*2):
        for j in range(ds*2):
            itx = int(xg - ds + i)
            ity = int(yg - ds + j)
            val = tmp[itx][ity]
            dist = dist2d(itx, ity, xg, yg)
            for k, (rin,rout) in enumerate(zip(nr[:-1], nr[1:])):
                if dist >=  rin and dist < rout:
                    rp[k] = rp[k] + val

    # normalize rp
    for m, (rin,rout) in enumerate(zip(nr[:-1], nr[1:])):
        darea = np.pi *  ( np.power(rout,2) - np.power(rin,2) )
        nrp[m] = rp[m] / darea
        if debug:
            print(m, rp[m], nrp[m], rin, rout, darea)

    return rc, nrp


def dist2d(x, y, xg, yg):
    return np.sqrt( np.power( x - xg  ,2) + np.power( y - yg  ,2) )

def calc_center(data, idetx, idety, ds = 10):
    """
    calc simple peak (just for consistendety check) and baricentric peak.
    """
    tmp = data.T

    xmax = -1.
    ymax = -1.
    zmax = -1.

    xg = 0.
    yg = 0.
    tc = 0.

    for i in range(ds*2):
        for j in range(ds*2):
            tx = idetx - ds + i
            ty = idety - ds + j
            val = tmp[tx][ty]
            tc = tc + val
            xg = xg + val * tx
            yg = yg + val * ty

            if  val > zmax:
                zmax = val
                xmax = idetx - ds + i
                ymax = idety - ds + i

    if tc > 0:
        xg = xg / tc
        yg = yg / tc
    else:
        print("[ERROR] in calc_center : tc is negaive. Something wrong.")
        sys.exit()

    print("..... in calc_center : [simple peak] xmax, ymax, zmax = ", xmax, ymax, zmax)
    print("..... in calc_center : [total counts in ds] tc = ", tc)

    if zmax < 0:
        print("[ERROR] in calc_center : zmax is not found. Something wrong.")
        sys.exit()

    return xg, yg, tc


def main():

    """ start main loop """
    curdir = os.getcwd()

    """ Setting for options """
    usage = '%prog FileList '
    version = __version__
    parser = optparse.OptionParser(usage=usage, version=version)

    parser.add_option('-d', '--debug', action='store_true', help='The flag to show detailed information', metavar='DEBUG', default=False)
    parser.add_option('-m', '--manual', action='store_true', help='The flag to use vmax, vmin', metavar='MANUAL', default=False)
    parser.add_option('-x', '--detx', action='store', type='int', help='det x', metavar='DETX', default=61)
    parser.add_option('-y', '--dety', action='store', type='int', help='det y', metavar='DETY', default=45)
    parser.add_option('-a', '--vmax', action='store', type='float', help='VMAX', metavar='VMAX', default=4e-6)
    parser.add_option('-i', '--vmin', action='store', type='float', help='VMIN', metavar='VMIN', default=1e-10)
    parser.add_option('-s', '--dataExtractSize', action='store', type='int', help='data size to be extracted from image', metavar='DS', default=40)
    parser.add_option('-n', '--numberOfDivision', action='store', type='int', help='number of division of annulus', metavar='NDIV', default=20)

    options, args = parser.parse_args()

    print("---------------------------------------------")
    print("| START  :  " + __file__)

    debug =  options.debug
    manual =  options.manual
    detx =  options.detx
    dety =  options.dety
    vmax =  options.vmax
    vmin =  options.vmin

    ds =  options.dataExtractSize
    ndiv =  options.numberOfDivision

    print("..... detx    ", detx)
    print("..... dety    ", dety)
    print("..... ds    ", ds,  " (bin of the input image)")
    print("..... ndiv  ", ndiv)
    print("..... debug ", debug)
    print("..... manual ", manual)
    print("..... vmax ", vmax)
    print("..... vmin ", vmin)


    argc = len(args)

    if (argc < 1):
        print('| STATUS : ERROR ')
        print(parser.print_help())
        quit()

    filename=args[0]

    print("\n| Read each file and do process " + "\n")

    print("START : ", filename)
    eve = Fits(filename, debug)
    eve.plotwcs(vmax = vmax, vmin = vmin, manual = manual) # plot the entire  image
    eve.plotwcs_ps(detx, dety, ds = ds, vmax = vmax, vmin = vmin, manual = manual) # plot the enlarged image around (detx,dety).
    eve.mk_radialprofile(detx, dety, ds = ds, ndiv = ndiv, vmax = vmax, vmin = vmin, manual = manual) # create detailed plots and radial profiles
    print("..... finish \n")

if __name__ == '__main__':
    main()