はじめに
Pythonを用いて、円と長方形の重なる部分の面積を計算し、その結果をMatplotlibで可視化する方法を紹介します。円と長方形の重なりに関しては、一般的な状況で適用可能な単純な閉じた形式の解(簡潔な数式)が存在しないことが多いです。
このプログラムは、幾何学的な形状の交差を計算するためのShapelyライブラリを使用し、計算結果を図示するためにMatplotlibを利用します。Shapelyを使わない方法として、「モンテカルロ法」と、「ドロネー三角形分割」を用いた方法についても紹介します。
この記事の内容は google colab で再現できるようにしてますので、
を参考にしてください。
最短の方法 (shapelyのareaを用いる)
Shapelyライブラリを用いて円と長方形の形状を作成します。次に、これらの形状の交差部分を計算し、その面積を求めます。最後に、Matplotlibで円、長方形、およびその交差部分を図示します。
重なり部分は、
を用いて計算しています。
アルゴリズムは、Dimensionally Extended Nine-Intersection Model (DE-9IM) という考え方に基づいて、
あたりで計算してる気がしますが、、詳細は追えてません。
サンプルの図形
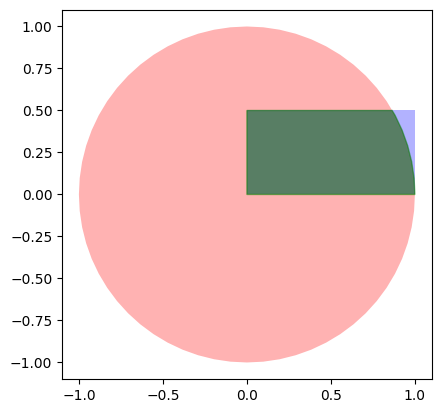
以下の例では、半径1の円と1x0.5の長方形の重なる部分の面積を計算しています。円の中心は原点に、長方形の中心は(0.5, 0.25)に設定されています。
重なり部分の面積は、解析的に、
answer = math.sqrt(3)/8 + math.pi / 12
のように、斜辺が1で角度が60度の三角形(1/2 x 1/2 x sqrt(3)/2)と、角度が30度の扇型(pi x 30/360)の和として、簡単に計算できます。
import matplotlib.pyplot as plt
import shapely.geometry as geometry
import math
import numpy as np
from shapely.geometry import Point, Polygon

def calculate_circle_rectangle_overlap_area(circle_radius, circle_center, rectangle_corners):
    """
    円と長方形の重なる部分の面積を計算します。

    :param circle_radius: 円の半径
    :param circle_center: 円の中心を表すタプル (x, y)
    :param rectangle_corners: 長方形の角の座標リスト [(x1, y1), (x2, y2), (x3, y3), (x4, y4)]
    :return: 重なる部分の面積, 円のオブジェクト
    """

    # 円と長方形を作成
    circle = Point(circle_center).buffer(circle_radius)
    rectangle = Polygon(rectangle_corners)

    # 交差部分を計算
    intersection = circle.intersection(rectangle)

    # Matplotlibで可視化
    fig, ax = plt.subplots()
    x, y = circle.exterior.xy
    ax.fill(x, y, alpha=0.3, fc='r', ec='none')
    x, y = rectangle.exterior.xy
    ax.fill(x, y, alpha=0.3, fc='b', ec='none')
    x, y = intersection.exterior.xy
    ax.fill(x, y, alpha=0.5, fc='g', ec='g')
    ax.set_aspect('equal', adjustable='box')
    plt.savefig("step1.png")
    plt.show()

    return intersection.area, circle

# 例の使用
circle_radius = 1
circle_center = (0, 0)
rectangle_corners = [(0, 0), (1, 0), (1, 0.5), (0, 0.5)]

overlap_area, circle = calculate_circle_rectangle_overlap_area(circle_radius, circle_center, rectangle_corners)
print("重なる部分の面積:", overlap_area)
answer = math.sqrt(3)/8 + math.pi / 12
print("解析的な解の面積:", answer)
print("誤差の割合:", np.abs(overlap_area/answer)*100, " %")
上のコードを実行すると、重なる部分の面積が計算され、図に可視化されます。また、解析的な解と計算結果の誤差の割合も表示されます。
実行結果は、
重なる部分の面積: 0.4778908908029972
解析的な解の面積: 0.47830573874525906
誤差の割合: 99.91326720366138  %
CPU times: user 431 ms, sys: 56.2 ms, total: 487 ms
Wall time: 525 ms
となりました。
この方法を使用すると、円と長方形の重なる部分の面積を簡単に計算し、可視化することができます。ShapelyとMatplotlibを使用することで、もっと複雑な幾何学的な問題も効率的に解決できます。
モンテカルロ法を用いた求積方法
Pythonを使って円と長方形の重なる部分の面積をモンテカルロ法で計算し、Matplotlibで可視化する方法を紹介します。モンテカルロ法はランダムなサンプリングを用いて様々な問題の近似解を求める手法です。
手順
以下の手順でプログラムを実装します:
-
パラメータの設定:円の半径、長方形の幅と高さ、および円と長方形の中心間のx軸とy軸の距離をパラメータとして指定します。
-
モンテカルロ法の適用:ランダムに生成された点が円内にあり、かつ長方形内にも含まれるかを確認します。この確認を多数回繰り返すことで、重なる部分の面積を推定します。
-
可視化:Matplotlibを用いて円と長方形を描画し、視覚的に重なる部分を確認できるようにします。
極座標表示における乱数の発生方法の注意点
円の中に一様な密度で点を生成すればよいのですが、注意が必要です。
例えば、
    for _ in range(num_points):
        # Generate a random point within the circle
        angle = random.uniform(0, 2 * 3.14159265359)
        r = radius * random.uniform(0, 1)
        x = r * cos(angle)
        y = r * sin(angle)
としてしまうと、円の中心からランダムな角度と半径で点を選びますが、この単純な方法では、円の中心に点が密集する傾向が生じます。円内に一様に点を分布させるには、点の半径を均等に分布させるのではなく、半径の二乗について均等に分布させる必要があります。これは、円の面積が半径の二乗に比例するため、中心から遠ざかるほど、たくさん乱数を発生させないと密度が変わってしまうためです。
そのため、動径方向の乱数は、
r = math.sqrt(random.uniform(0, 1)) * radius
として、2乗したときに一様となるように乱数を発生させる必要があります。
モンテカルロ法なので、
    # モンテカルロ法に使用する点の数
    num_points = 10000
で指定した数が多いほど精度が高くなりますが、計算量も高くなります。
%%time
import random
import math
import matplotlib.pyplot as plt
import matplotlib.patches as patches
import numpy as np

def overlap_area(radius, width, height, center_distance_x, center_distance_y):
    """
    円と長方形の重なる部分の面積を計算します。

    :param radius: 円の半径
    :param width: 長方形の幅
    :param height: 長方形の高さ
    :param center_distance_x: 円と長方形の中心間のx軸距離
    :param center_distance_y: 円と長方形の中心間のy軸距離
    :return: 重なる部分の面積の近似値
    """

    # モンテカルロ法に使用する点の数
    num_points = 10000

    # 長方形の境界を定義
    rect_x_min = -width / 2 + center_distance_x
    rect_x_max = width / 2 + center_distance_x
    rect_y_min = -height / 2 + center_distance_y
    rect_y_max = height / 2 + center_distance_y

    # 円と長方形の両方に含まれる点の数を数える
    overlap_count = 0
    for _ in range(num_points):
        # 一様な密度で円内の点を生成
        angle = random.uniform(0, 2 * math.pi)
        r = math.sqrt(random.uniform(0, 1)) * radius
        x = r * math.cos(angle)
        y = r * math.sin(angle)

        # この点が長方形の内部にも含まれるかチェック
        if rect_x_min <= x <= rect_x_max and rect_y_min <= y <= rect_y_max:
            overlap_count += 1

    # 円の面積を計算
    circle_area = math.pi * radius ** 2

    # 重なる部分の面積を推定
    estimated_overlap_area = circle_area * (overlap_count / num_points)

    # Matplotlibで可視化
    fig, ax = plt.subplots()
    circle_patch = patches.Circle((0, 0), radius, fc='g', ec='r', alpha=0.4)
    rectangle_patch = patches.Rectangle((center_distance_x - width / 2, center_distance_y - height / 2),
                                        width, height, ec='#000000', fill=True, color="blue", alpha=0.4)
    ax.add_patch(circle_patch)
    ax.add_patch(rectangle_patch)
    ax.set_xlim(-radius, radius)
    ax.set_ylim(-radius, radius)
    ax.set_aspect('equal', adjustable='box')
    plt.savefig("step2.png")
    plt.show()

    return estimated_overlap_area

# 例の使用
monte_area = overlap_area(1, 1, 0.5, 0.5, 0.25)

print("重なる部分の面積:", monte_area)
answer = math.sqrt(3) / 8 + math.pi / 12
print("解析的な解の面積:", answer)
print("誤差の割合:", np.abs(monte_area / answer) * 100, " %")
実行結果は、
重なる部分の面積: 0.4778908908029972
解析的な解の面積: 0.47830573874525906
誤差の割合: 99.91326720366138  %
CPU times: user 431 ms, sys: 56.2 ms, total: 487 ms
Wall time: 525 ms
となり、この場合はShapelyと大差ない精度が出てることがわかります。
ドロネー三角形分割を用いた方法
ドロネー三角形分割を用いて重なり部分を計算し、ShapelyとMatplotlibで図示する方法を示します。
ドロネー三角形分割アルゴリズム(例えば分割統治法や増分法)は、計算量が点の数に対してO(n log n)またはそれに近いオーダーであることが多く、大量のデータに対しても比較的高速に処理できる点でメリットがあります。
ここでは、scipy.spatial.Delaunayを用いて、ドロネー三角形分割を計算します。
方法
円と長方形の重なり部分を計算するには、
- まず円の周囲と内部に点を生成し、これらの点を用いてドロネー三角形分割を行います。
- 次に、生成された三角形のそれぞれが長方形と重なっているかを判定し、重なっている部分の面積を合計します。
重なり判定は、下記の2つの関数を用いています。
- shapely.intersects (重なるとTrueを返す):
- shapely.intersection (重なるジオメトリを返す):
重なるジオメトリは、PolygonであればPolygonで、LINESTRINGで重なっていればLINESTRINGで返してくれる優れものです。
%%time
import matplotlib.pyplot as plt
import matplotlib.patches as patches
from scipy.spatial import Delaunay
import numpy as np
from shapely.geometry import Polygon, Point
import math

def plot_circle_square_overlap_with_grid_points(circle_radius, circle_center=(0, 0), square_center=(0, 0), width=1, height=0.5, num_points=100, grid_density=10):
    """
    円と長方形の重なる部分をドロネー三角形分割を用いて可視化する関数です。
    さらに、円内部に格子点を追加して、三角形分割の精度を向上させます。

    :param circle_radius: 円の半径
    :param circle_center: 円の中心座標 (x, y)
    :param square_center: 長方形の中心座標 (x, y)
    :param width: 長方形の幅
    :param height: 長方形の高さ
    :param num_points: 円周上の点の数
    :param grid_density: 円内部の格子点の密度
    :return: 重なる部分の面積と、結合された点の集合
    """

    # 円周上の点を生成
    angles = np.linspace(0, 2 * np.pi, num_points, endpoint=False)
    points_on_circle = np.array([
        (circle_center[0] + circle_radius * np.cos(angle), circle_center[1] + circle_radius * np.sin(angle))
        for angle in angles
    ])

    # 円内部の格子点を生成
    grid_points = []
    for x in np.linspace(circle_center[0] - circle_radius, circle_center[0] + circle_radius, grid_density):
        for y in np.linspace(circle_center[1] - circle_radius, circle_center[1] + circle_radius, grid_density):
            if (x - circle_center[0])**2 + (y - circle_center[1])**2 <= circle_radius**2:
                grid_points.append((x, y))
    grid_points = np.array(grid_points)

    # 円周上の点と格子点を結合
    combined_points = np.vstack((points_on_circle, grid_points))
    npoints = len(combined_points)

    # ドロネー三角形分割を実行
    triangulation = Delaunay(combined_points)

    # 長方形を作成
    square_polygon = Polygon([
        (square_center[0] - width / 2, square_center[1] - height / 2),
        (square_center[0] + width / 2, square_center[1] - height / 2),
        (square_center[0] + width / 2, square_center[1] + height / 2),
        (square_center[0] - width / 2, square_center[1] + height / 2)
    ])

    # プロットの作成
    fig, ax = plt.subplots()

    # 長方形をプロット
    square = patches.Rectangle(
        (square_center[0] - width / 2, square_center[1] - height / 2),
        width, height, fill=True, edgecolor='blue', linestyle='--', alpha=0.5
    )
    ax.add_patch(square)

    # 円をプロット
    circle = plt.Circle(circle_center, circle_radius, fill=False, edgecolor='green', linestyle='--', alpha=0.5)
    ax.add_patch(circle)

    # 三角形分割をプロットし、重なる部分の面積を計算
    overlap_area = 0
    for triangle in triangulation.simplices:
        triangle_points = combined_points[triangle]
        triangle_polygon = Polygon(triangle_points)
        x = triangle_points[:, 0]
        y = triangle_points[:, 1]
        if triangle_polygon.intersects(square_polygon):
            overlap_area += triangle_polygon.intersection(square_polygon).area
            ax.fill(x, y, 'b-', alpha=0.1, ec="k")
        else:
            ax.fill(x, y, 'b-', alpha=0.05, ec="m")

    # 軸の設定とラベル
    ax.set_xlim(circle_center[0] - circle_radius, circle_center[0] + circle_radius)
    ax.set_ylim(circle_center[1] - circle_radius, circle_center[1] + circle_radius)
    ax.set_aspect('equal', adjustable='box')
    ax.set_aspect('equal', adjustable='box')
    plt.xlabel('X-axis')
    plt.ylabel('Y-axis')
    plt.title('Overlap of Circle and Square with Grid Points of ' + str(npoints))

    # Show plot
    plt.show()
    plt.savefig("step3.png")
    return overlap_area, combined_points

# Example usage
overlap_area, npoints = plot_circle_square_overlap_with_grid_points(1, circle_center=(0, 0), square_center=(0.5, 0.25), width=1, height =0.5, grid_density=40)
print("重なる部分の面積:", overlap_area)
answer = math.sqrt(3)/8 + math.pi / 12
print("解析的な解の面積:", answer)
print("誤差の割合:", np.abs(overlap_area/answer)*100, " %")
計算結果は、grid_densityというどのくらい分割するかに依存しますが、上の場合は、
    重なる部分の面積: 0.4781349901076382
    解析的な解の面積: 0.47830573874525906
    誤差の割合: 99.96430136128646  %
    CPU times: user 4.13 s, sys: 137 ms, total: 4.26 s
    Wall time: 4.2 s
となり、若干時間がかかります。
のように、ドロネー三角形分割が行われ、overlapしている領域の面積が計算されていることがわかるかと思います。
面積の計算は、
overlap_area += triangle_polygon.intersection(square_polygon).area
の部分で、三角形と四角形の重なり部分を .area という変数で返してくれるので、精度は三角形分割の精度ではなくて、Shapely の intersection の精度で決まります。
このようにして、ドロネー三角形分割とShapelyの幾何学的操作を組み合わせることで、円と長方形の重なる部分の面積を計算し、可視化することができました。複雑な形状の交差部分も計算することができます。
ただし、ドロネー三角形分割の個数が増えると計算量が膨大になることには注意が必要です。

