現在の環境
- ASUS C300
- Chrome OS(linux-64)
- miniconda3-3.18.3
- python 3.5.1
- jupyter 4.0.6
- chromebrew+gitインストール済み
RISE
- 以前からlive_revealを使って動的なHTMLが生成できたが、最近はRISEというプロジェクトが良い様子
- ipython 3.x+live_revealの時はなぜか環境構築できなかったが、今回はさくっと入った
git clone https://github.com/damianavila/RISE
cd RISE
python setup.py install
- これでlocalhostのjupyterにスライドショーボタンが追加される
- 動的なHTMLでプレゼンできて、中のコードまで書き換えられる
- とういうところまで書いて、すでに素晴らしいQiitaの記事があったのに気づいた。
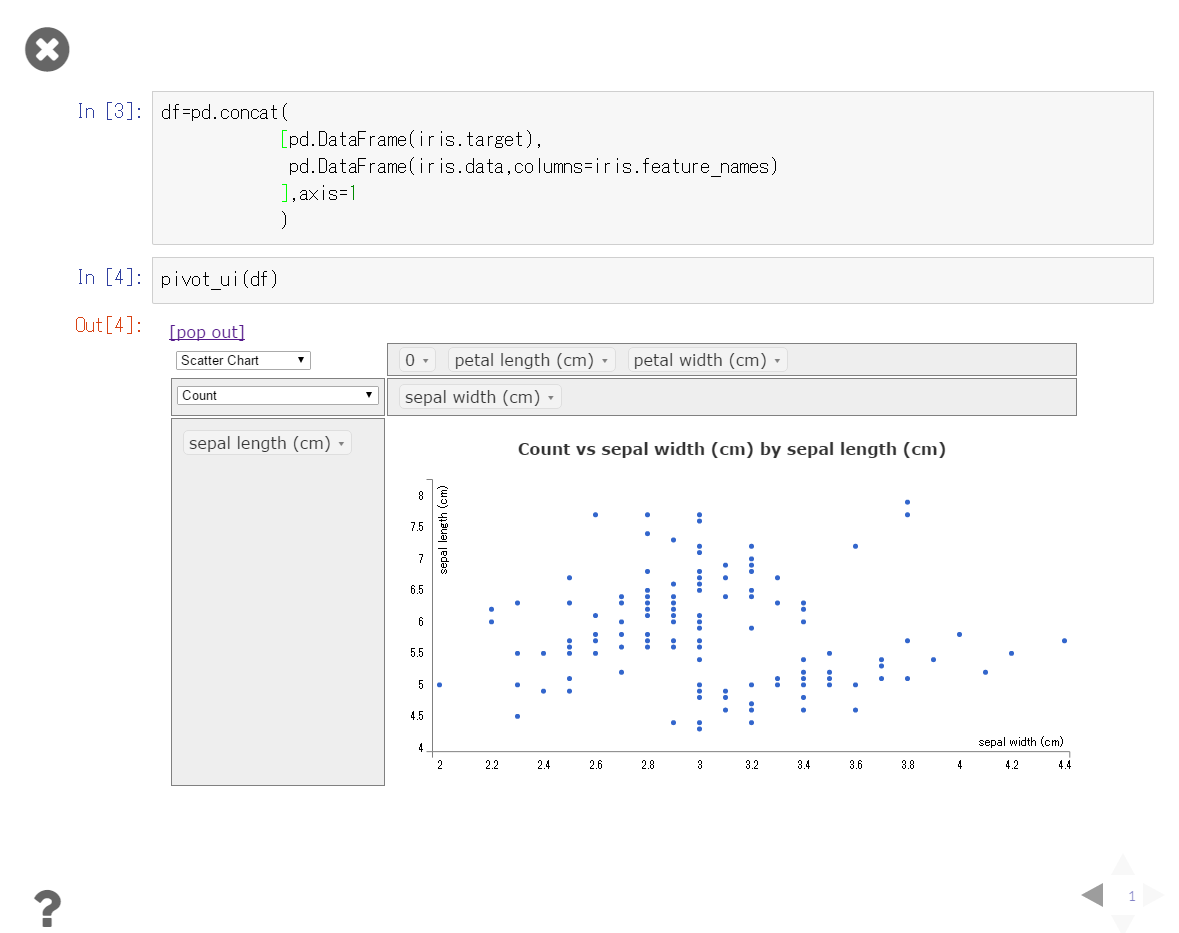
pivottablejs
conda install pivottablejs
ipywidgets.interact
- こちらも素晴らしいQiitaの記事がある。
- Jupyter 4.xではIPython.html.widgetsは非推奨になりipywidgetsになった。
- インストール
conda install ipywidgets
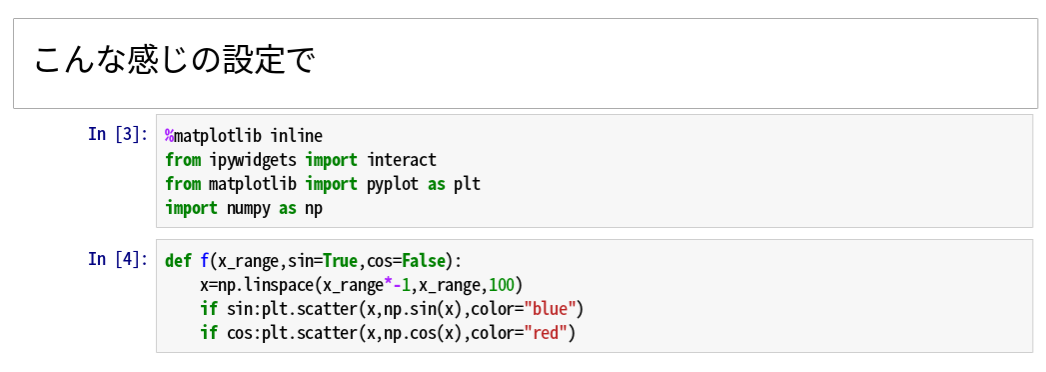
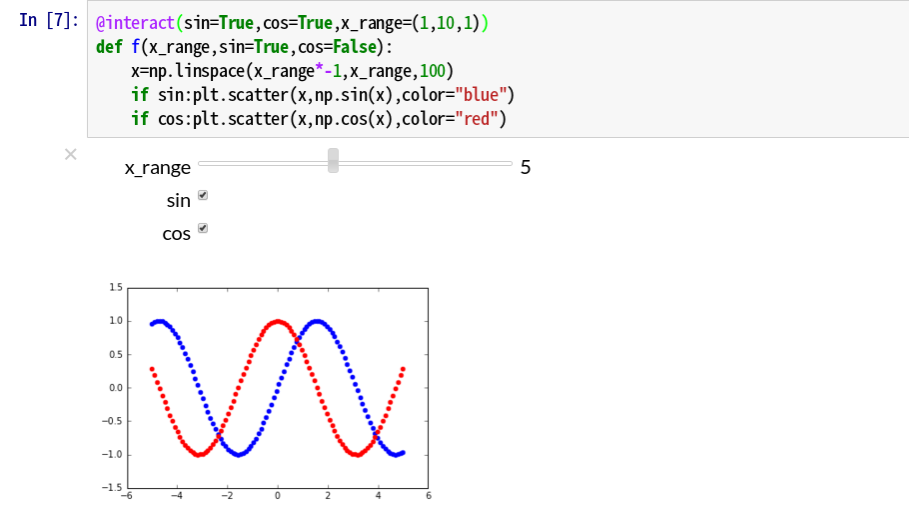
interactに関数とパラメータを渡すと、パラメータを変化させるwidgetが生成します。
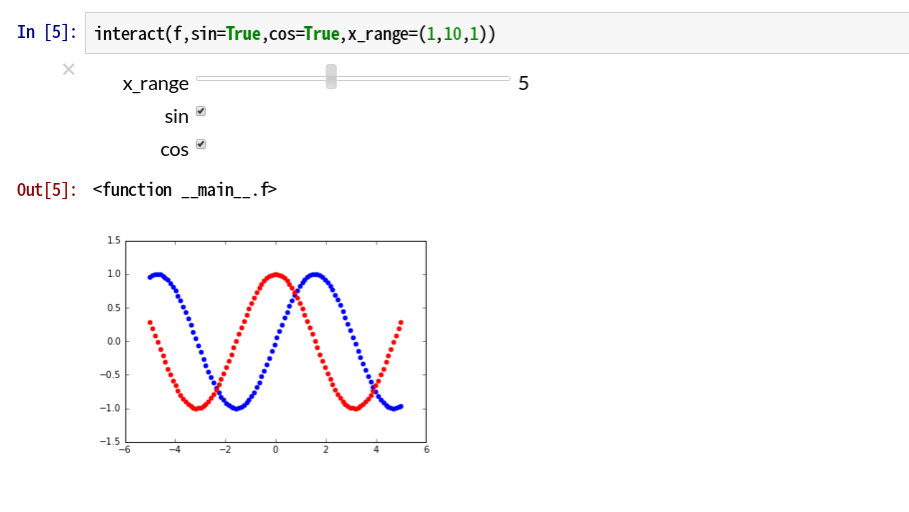
interactを関数のデコレータとして使うこともできて、
こちらの方法もかなりスマートです。
bokeh
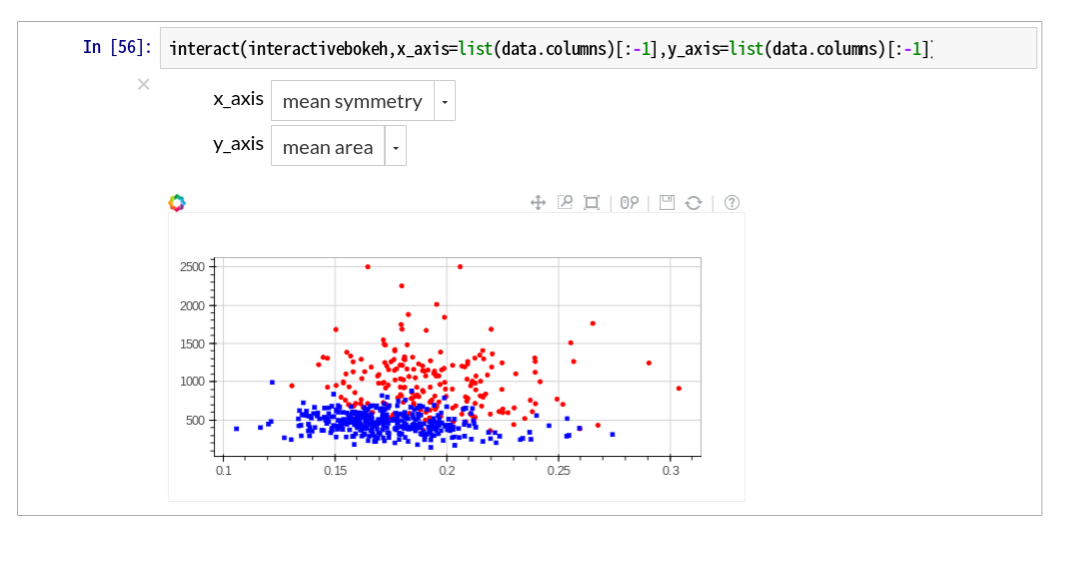
- まだバージョンアップが頻繁でAPIが安定していないが、bokehというヴィジュアライズの拡大縮小などができるライブラリがある。
- 参考
- interectにパラメータの指定をさせて、bokehで描画するとspotfireとかtableauとかを使っている気分になる。
conda install bokeh
使用例
from sklearn.datasets import load_breast_cancer
import pandas as pd
cancer=load_breast_cancer()
data=pd.DataFrame(cancer.data,columns=cancer.feature_names)
data["target"]=[cancer.target_names[i] for i in cancer.target]
def interactivebokeh(x_axis,y_axis):
    fig=bplt.figure(plot_width=640, plot_height=320)
    fig.circle(
                data[data.target=="malignant"][x_axis],
                data[data.target=="malignant"][y_axis],
                line_color="red",fill_color="red"
                )
    fig.square(
                data[data.target=="benign"][x_axis],
                data[data.target=="benign"][y_axis],
                line_color="blue",fill_color="blue"
                )
    bplt.show(fig)
