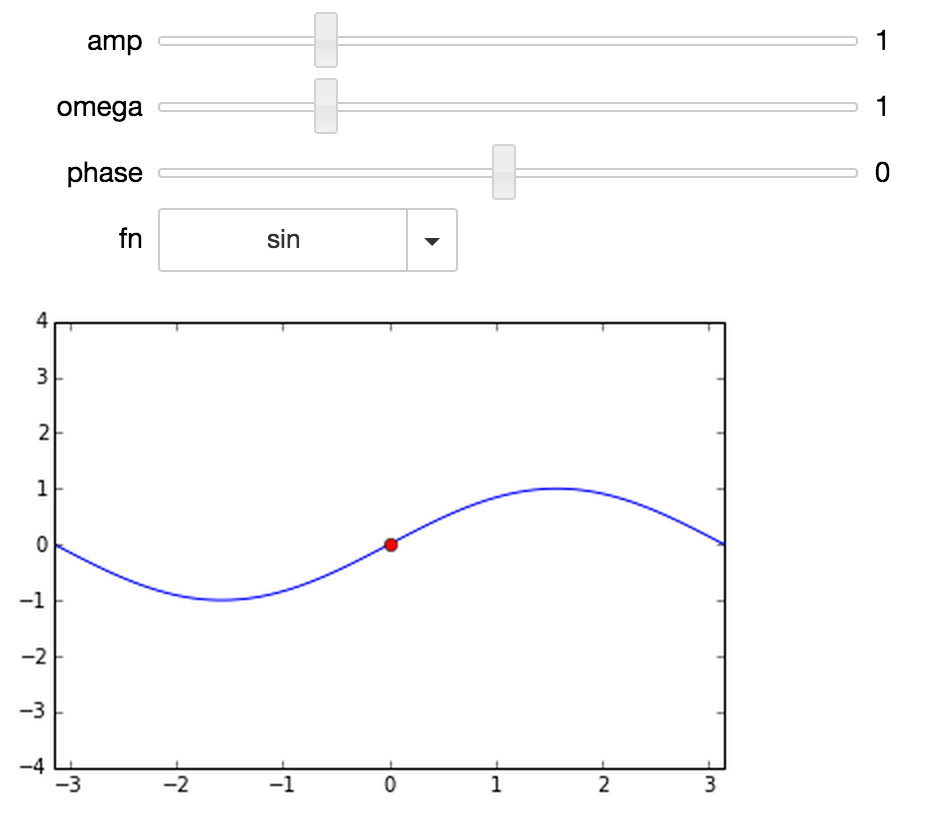
IPythonでクリクリできる図を作る方法を紹介します。一番簡単なのはインタラクティブなUIを自動的に作成するinteract関数 (IPython.html.widgets.interact) を使う方法です。
-
注1)この記事よりもう少し詳しい説明はInteractの使い方としてnbviewerにまとめておきましたので、興味のある方はそちらもどうぞ。
-
注2)この記事のIPython Notebookはそのままnbviewerからダウンロードできます。インタラクティブな描画を手軽に試したい方はどうぞ。
最初に必要となるモジュールを読み込みます。
from __future__ import print_function
from IPython.html.widgets import interact, interactive, fixed
from IPython.html import widgets
その上で、まずはインタラクティブに操作したい関数を定義します。
def f(x):
    print(x)
次に、interact関数の第一引数に操作したい関数を渡し、キーワード引数としてそれっぽい引数(widget abbreviation)を渡します。たったこれだけです。下のコードを実行するとスライダーが現れ、クリクリできて楽しいです。
interact(f, x=(-10, 10, 2));
んで、上と下はまったく同義。上がwidget abbreviationを渡す方法で、下がwidgetのインスタンスを渡す方法です。
interact(f, x=widgets.IntSliderWidget(min=-10, max=10, step=2, value=0));
初期値を設定したい場合はinteractをデコレータとして使います。
@interact(x=(-10, 10, 2))
def g(x=8):
    print(x)
代表的なウィジェットには以下のようなものがあります。interact関数のキーワード引数に渡すのは、左側のそれっぽい引数(widget abbreviation)か、右側のwidgetのインスタンスのどちらかです。
| キーワード引数 | ウィジェット |
|---|---|
True or False
|
CheckboxWidget |
u'こんにちは世界!' |
TextareaWidget |
整数を用いた value or (min,max) or (min,max,step)
|
IntSliderWidget |
実数を用いた value or (min,max) or (min,max,step)
|
FloatSliderWidget |
('orange','apple') or {'one':1,'two':2}
|
DropdownWidget |
描画と合わせると、さらにクリクリするのが楽しくなります。以下の図は $y = A,sin(\omega x + \alpha)$ をダイナミックに描画するデモです。$A \in [0.1, 4.0], \omega \in [0.1, 4.0], \alpha \in [-\pi, \pi]$という3つのパラメータをスライダーで変化させると、それにあわせて図が変化します。こりゃ楽しい!
%matplotlib inline
import matplotlib.pyplot as plt
import numpy as np
@interact(amp=(0.1, 4.0, 0.1), omega=(0.1, 4.0, 0.1), phase=(-np.pi, np.pi, 0.1),
          fn = {'sin': np.sin, 'cos': np.cos, 'tan': np.tan})
def h(amp=1.0, omega=1.0, phase=0.0, fn=np.sin):
    domain=[-np.pi, np.pi]
    x = np.linspace(domain[0], domain[1], 100)
    y  = amp * fn(omega * x + phase)
    plt.plot(x, y)
    plt.plot(-phase/omega, 0, 'or')
    plt.xlim(domain)
    plt.ylim([-4, 4])


