準備 - Preparation
vecs #numpyの2重配列
Name #ラベル
主成分分析 - Principal Component Analysis
from sklearn.decomposition import PCA #主成分分析器

pca = PCA(n_components=2)
pca.fit(vecs)
x = pca.transform(vecs)

X = []
Y = []
for j in range(len(x)):
  X.append(x[j][0])
  Y.append(x[j][1])
可視化 - Visualization
fig, ax = pyplot.subplots(figsize=(15,15))
ax.scatter(X, Y)
for i, txt in enumerate(Name):
  ax.annotate(txt, (X[i], Y[i]))
pyplot.savefig("img.png") # 保存
例 - Example
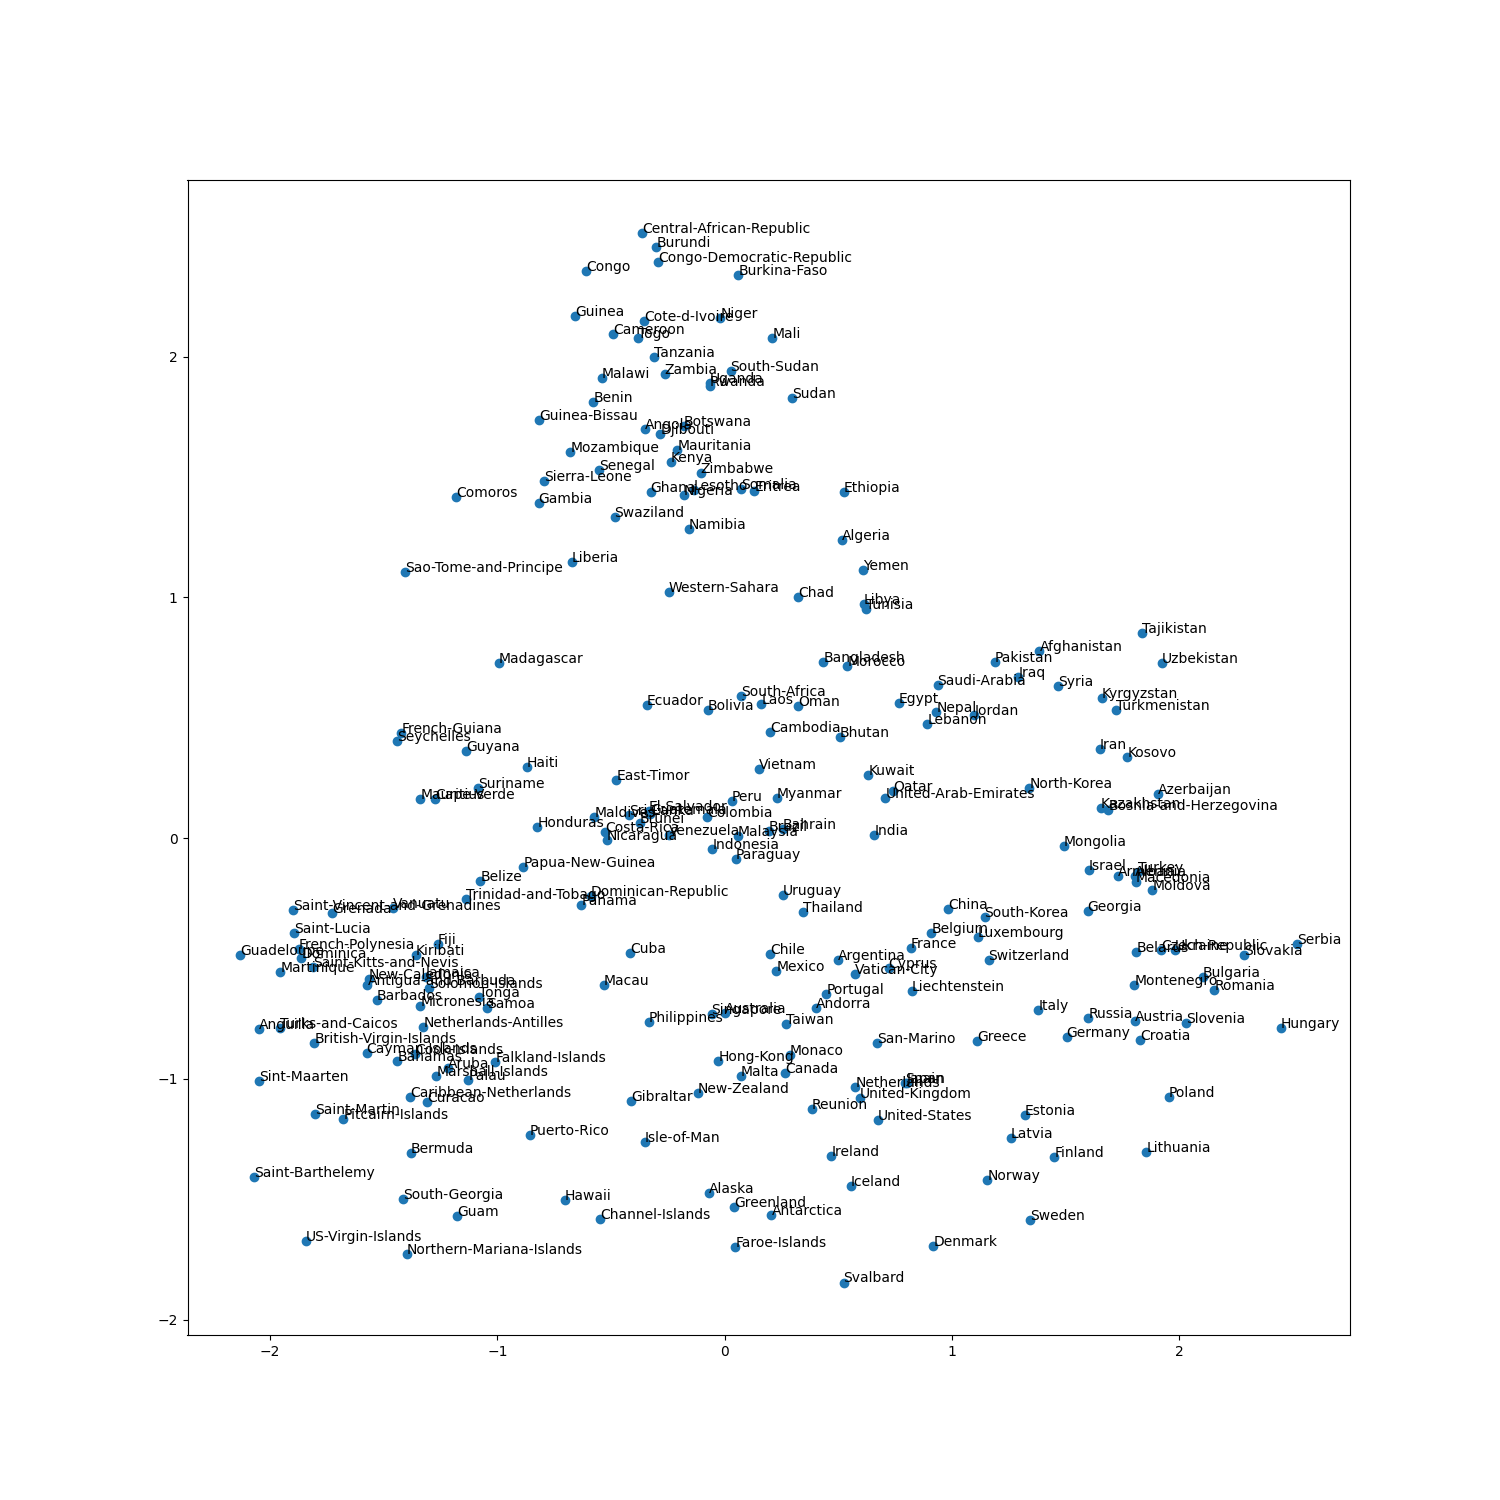
Wikipedia2Vecの事前学習モデルから国名に対応するベクトルを抽出し,可視化した結果
Visualization of country vectors, which was extracted Wikipedia2Vec model.