ごく稀に必要になるので,自分用にメモ
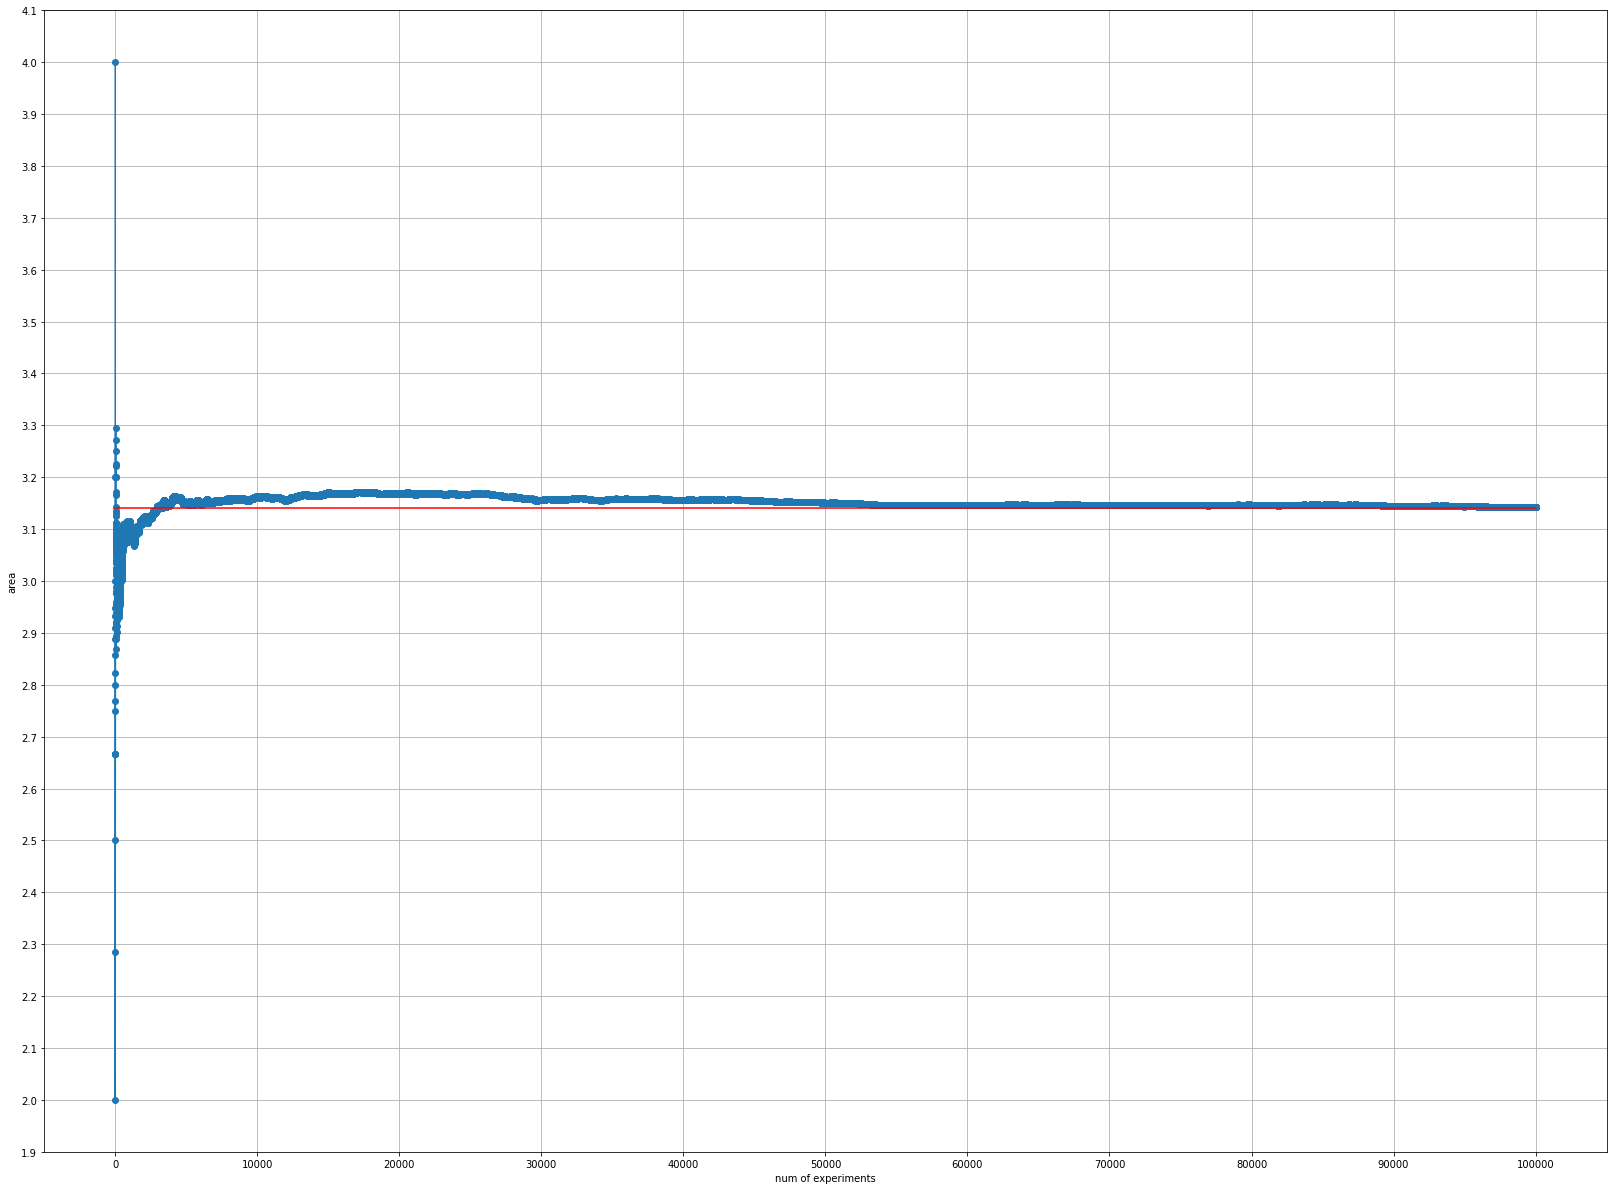
モンテカルロ法を例に
import random
import math

result = []
in_circle = 0
out_circle = 0
for i in range( 100000 ):
  x = random.uniform( -1.0, 1.0 )
  y = random.uniform( -1.0, 1.0 )
  distance = math.sqrt( x ** 2 + y ** 2 )
  if distance <= 1:
    in_circle += 1
  else:
    out_circle += 1
  result.append( ( in_circle / ( in_circle + out_circle ) ) * 4)
import numpy as np
import matplotlib.pyplot as plt

plt.figure(figsize=(28,21))
plt.plot(range(1, len(result)+1), result, "-o")
plt.ylabel('area')
plt.xlabel('num of experiments')
plt.xticks(np.arange(0, len(result) + 1, 10000))
plt.yticks(np.arange(0, 4.5, 0.1))
plt.plot([0, len(result)], [math.pi, math.pi], "red", linestyle='solid')
plt.grid()
plt.show()